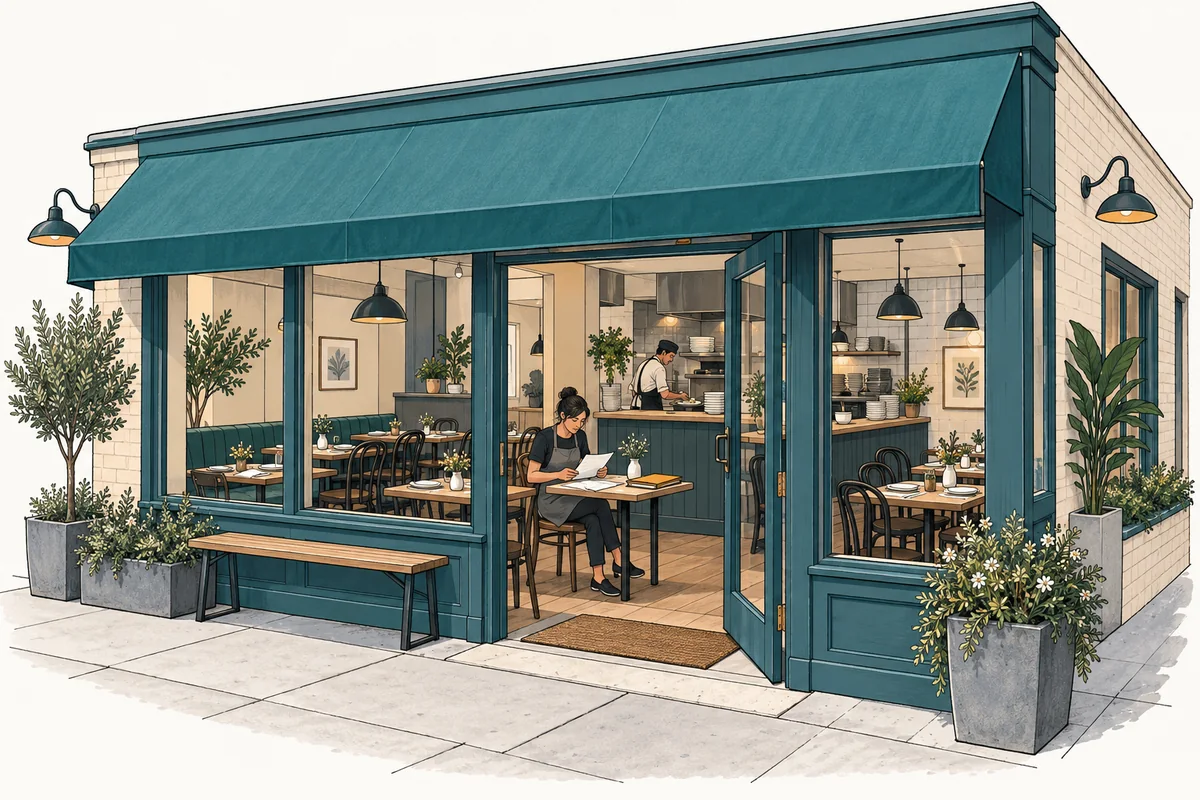
The pop-up and guest-chef residency case models five separate March–May residencies in the United States, one per year from 2027 through 2031. It uses 40 seats and one Thursday–Saturday sitting in equipped host premises. These Base-case dates, prices, and renewal windows are analytical assumptions; future host access is not a signed commitment.
Which dates can actually earn sales?
Revenue follows enabled service dates inside each residency’s start and end dates. The 2027 calendar contains 39 Thursday–Saturday dates from March 1 through May 31. The later selected windows contain 39, 40, 40, and 40 dates. Nine months of every forecast year have no trading, even though some costs continue.
The 2027 menu is $115 net per served guest, with an optional $20 nonalcoholic pairing. The operator sells the meal itself and pays the host for access; host bar or hotel sales do not belong to this operator. Payment occurs after service, with no advance-ticket or cancellation-fee income assumed.
Bookings are limited by seats, equipment, and paid kitchen and service time. The kitchen prepares every accepted menu, but attendance is 97% with whole-guest rounding per sitting. Pairings are a subset of served guests. Extending a residency therefore needs both available dates and a supported service plan; a longer date range alone is not earned revenue.
How much of the host-access day is sellable?
The eight-hour access allowance includes the work surrounding dinner. Three hours of preparation, 150 dining minutes, 30 reset minutes, and one hour of teardown total seven hours: 3 + 150 ÷ 60 + 30 ÷ 60 + 1. The remaining hour is slack within the selected contract.
Two complete sittings with the same setup and teardown would require ten hours: 3 + 2 × (150 + 30) ÷ 60 + 1. They do not fit the saved eight-hour allowance. A second sitting would require revised access and staffing assumptions before its sales could enter the forecast.
The host retainer is $9,000 per active month for up to 15 reserved dates. Three active months therefore cost $27,000 in 2027 regardless of whether all reserved dates are used. Allocated across the actual 39 service dates, that is $692.31 per used date, rather than the $600 date-equivalent at full use of 45 available dates. These are two allocations of the same selected retainer, not alternative market quotes.

Which costs continue outside March through May?
The cost schedule extends before and after dining. The guest chef starts in February, while the owner remains paid at 0.25 full-time equivalent year-round. Each year’s dated chef and crew rows represent a separate residency team; adding all five years’ rows would overstate simultaneous headcount.
On a narrow screen, scroll within the table to read all columns.
| Period | Sales activity | Paid commitments | Planning implication |
|---|---|---|---|
| January | No dining | Owner, recurring overhead, initial formation and financing expenses | Cash is used before the residency begins. |
| February | No dining | Guest-chef preparation, owner, overhead, and $22,000 portable CAPEX | Preparation payroll and assets are different uses of cash. |
| March–May | 39 selected service dates | $27,000 host retainer, service team, ingredients, owner, overhead, and launch/logistics costs | Fewer dates do not automatically reduce the retainer. |
| June–December | No dining | Owner and continuing overhead | Closing the dining window does not close the business's commitments. |
| Later years | Separately assumed March–May windows | Renewed host/team budgets; $4,000 equipment replacement in January 2030 | Recheck renewal availability and the cash needed before each season. |
The recurring 2027 overhead is $1,250 per month: insurance $200, software $100, administration $250, storage $100, marketing $300, maintenance $50, and courier/travel $250. The nine nontrading months therefore carry $11,250 of this overhead alone. That calculation excludes paid owner time, any chef preparation, debt service, and capital spending.
The equipped host bundle includes premises, basic furniture and courseware, utilities, and host dishwashing. The operator’s capital budget buys portable and supplemental assets. Buying the host’s full kitchen again would duplicate scope, while omitting the operator’s storage and off-season administration would miss ongoing costs.
Why can a profitable service month fail to recover the project?
The saved Base results first reach a nonnegative operating month in April 2027, but subsequent off-season commitments reverse operating performance. Cumulative project cash does not first cross zero until May 2031. It then returns below zero, ending December 2031 at negative $3,182. That is temporary recovery within the horizon, not durable capital recovery.
This project-cash measure includes capital purchases, operating deficits, tax, and working-capital changes before financing; it excludes financing receipts, interest, and terminal sale proceeds. The retained cash funded by equity and borrowing is a different balance. In this case, the lowest funded cash occurs in February 2029, showing why the funding review must extend beyond the first opening.
How should the trading target be evaluated?
Use the complete annual expense calendar when judging the sales required from the short service window. The workbook’s annual pretax break-even estimate divided by twelve is an average over calendar months. It is not a required sales target for each of three trading months or for one dinner event.
Confirm host access, service dates, staff start and end dates, and off-season commitments together. The break-even and payback guide explains the different milestones; the residency model lets the finite selling period be read alongside the full cash calendar. Its monthly expense allocation is an annual-share approximation, so it should not be treated as an event-by-event purchasing ledger.