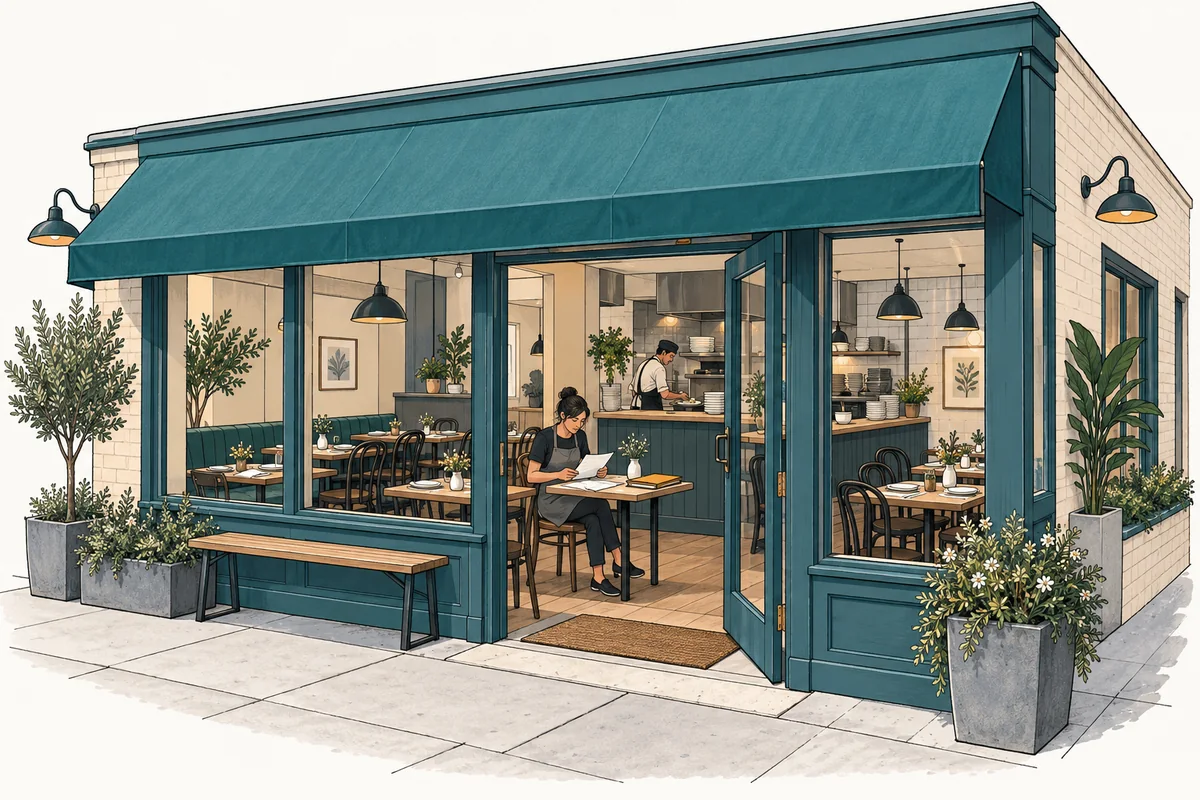
This article follows the Base case in the full-service restaurant workbook. It represents one alcohol-free U.S. restaurant with 80 seats, lunch and dinner service, and a January 2027–December 2031 forecast. Its traffic, dwell times, and productivity rates are explicit planning assumptions. They are not validated demand for a particular site or guaranteed staffing and equipment performance.
Begin with requests, then calculate service
The case starts with lunch requests of 80 per open day and dinner requests of 120, increasing to 94 and 140 respectively over five years. Opening demand ramps from 60% to 100% over six months. Actual open calendar days are counted for a Tuesday–Sunday schedule. Calendar demand multipliers are set to 1.00, so the model does not impose an unsupported national seasonal pattern.
Those values describe the demand presented to the operation. They do not override its capacity. A demand assumption belongs in its own input because it needs a different kind of evidence from a seating plan or paid staffing schedule. The SBA’s market-research guidance identifies demand, location, market size, competition, and pricing as questions to investigate. None of those questions is answered by choosing a capacity number. SBA’s market-research guidance.
Follow the limiting resource
- Estimate requests: apply open days and the demand ramp to lunch and dinner requests.
- Check four service limits: usable seat turns, equipment throughput, funded productive kitchen labor, and funded productive service labor.
- Select guests served: take the minimum of demand and the applicable limits, allocating shared labor only once.
- Calculate net revenue: multiply each service's guests served by its net spend per guest, then combine the services.
The sequence explains why increasing one input can leave revenue unchanged. If equipment is the limiting resource, more seats alone do not expand modeled output. If funded service hours are the limit, an increased demand assumption does not create the hours needed to serve those guests. First identify the binding constraint; then examine the operating change that could relieve it.
Convert seats and equipment to the same unit
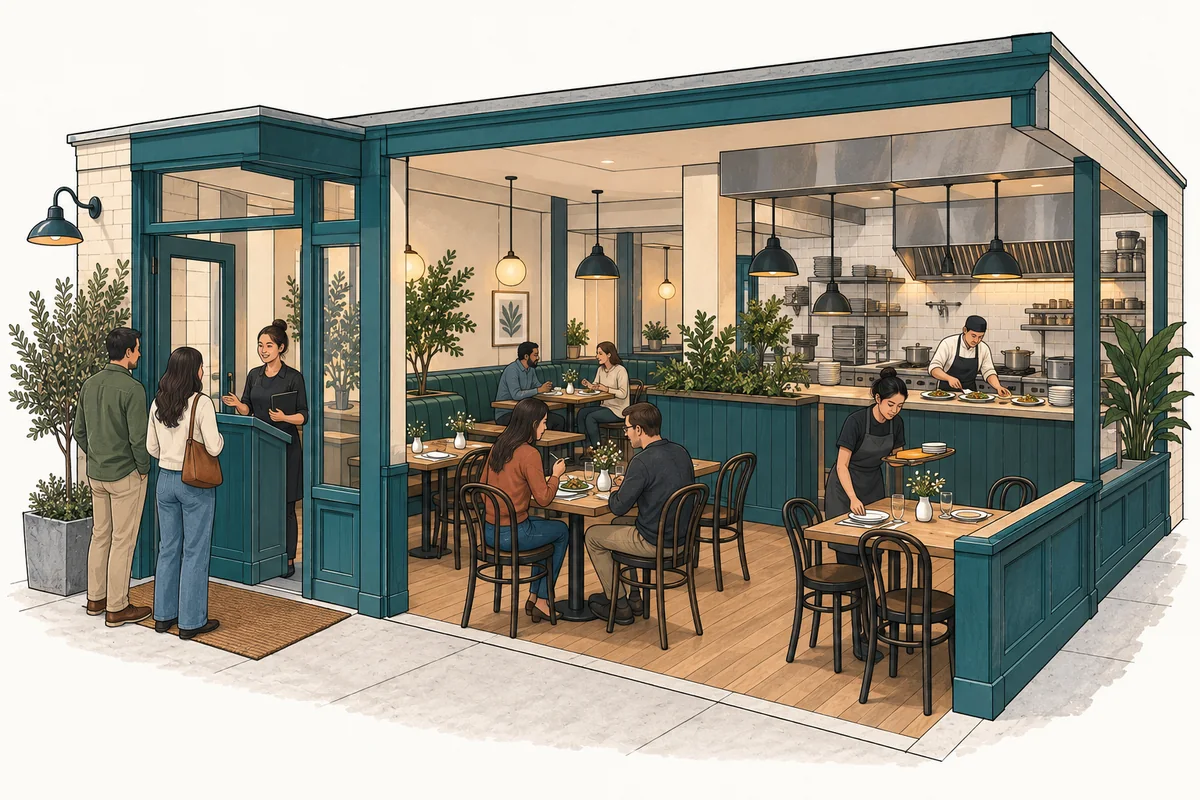
The case uses 80 physical seats with an 85% usable-seat factor. Lunch lasts three hours with a 60-minute guest dwell time. Dinner lasts 4.5 hours with a 90-minute dwell time. Equipment throughput is assumed to be 40 guests per hour during service.
For a simple service-period check, usable seat capacity equals seats multiplied by the usable factor and the number of dwell periods available. Equipment capacity equals its hourly throughput multiplied by service hours. These calculations produce comparable guest counts before demand and funded labor are applied.
On a narrow screen, scroll within the table to read all columns.
| Capacity check | Lunch | Dinner |
|---|---|---|
| Usable seat turns | 80 × 85% × 3 hours ÷ 1 hour = 204 guests | 80 × 85% × 4.5 hours ÷ 1.5 hours = 204 guests |
| Equipment throughput | 40 guests/hour × 3 hours = 120 guests | 40 guests/hour × 4.5 hours = 180 guests |
| What remains to check | Lunch requests and the allocated kitchen and service labor limits. | Dinner requests and the allocated kitchen and service labor limits. |
These are calculated ceilings under the stated assumptions, not a forecast of daily sales. The equal seat-turn results arise because each service allows three dwell periods. Lunch has fewer service hours, so its equipment ceiling is lower. Neither result establishes which constraint controls a particular forecast month; that requires the demand and labor calculations too.
Paid hours must become productive hours
The workbook funds labor through its payroll schedule. It assumes 2,080 paid hours per full-time equivalent each year. For the kitchen calculation, 75% of the funded hours are productive and the selected rate is 14 guests per productive cook hour. For servers, the assumptions are 90% productive time and ten guests per productive server hour.
The distinction matters because a paid hour is not automatically an hour available for serving additional guests. The selected productive fractions represent the case’s allowance for the difference. Before adapting them, check the actual roles, service tasks, preparation needs, breaks, and operating schedule you expect to fund.
Lunch and dinner use shared productive cook and server hours. Those hours must be allocated once across the non-overlapping services. If all available labor hours were assigned to lunch and then assigned again to dinner, the forecast would claim more productive time than the payroll funds. An apparently reasonable guest forecast could then rest on duplicated capacity.
Keep each conversion visible: funded staff to paid hours, paid hours to productive hours, productive hours to service capacity, and capacity to served guests. Do not substitute total employee headcount for the FTE and hours assumptions without checking the conversion.
Convert served guests into the right revenue measure
The initial net spend assumptions are $24 per lunch guest and $34 per dinner guest, with approximately 3% annual escalation. Revenue excludes sales tax, voluntary tips, and alcohol. Card-processing costs and employer payroll tax on tips are budgeted separately in this case.
Calculate the services separately before adding their revenue. A shift in the lunch-versus-dinner mix changes the weighted spend per guest even if the two menu-spend inputs remain fixed. Likewise, an increase in average spend can increase revenue with no increase in guests served. That is a pricing or mix effect and should be explained as such.
The model also calculates food costs as a percentage of net sales. Raising the selling-price assumption therefore changes those modeled costs as well. It does not recreate recipe-level ingredient quantities, yields, or supplier prices. Recognizing that simplification helps explain the financial response to a price change.
Test a physical change separately from a money scenario
Choose one operating question at a time. For a demand test, hold seats, equipment, staffing, and spend constant, then inspect requests, served guests, and revenue. For a staffing test, change the funded role or hours and inspect both service capacity and payroll. For a service-duration test, check the labor allocation as well as the extra theoretical seat turns.
The workbook’s Low and High money scenarios apply financial multipliers. They do not create a different floor plan, traffic pattern, or staffing schedule. Use the operating inputs when the question concerns physical throughput, and document every related change needed to make that operating case coherent.
A capacity increase also does not, by itself, prove higher profit or adequate cash. Read the resulting expense and cash schedules, including the cost of any additional equipment or staff. The opening reserve guide explains why funding needs may change, while the break-even and payback guide explains the different result milestones.
Before editing, use the assumptions review guide to record units and formula dependencies. If your revenue follows takeout orders, catering events, or contracted meals instead of seated lunch and dinner guests, start with the restaurant operating-format comparison and select the matching structure.