
Restaurant Financial Model: Full-Service Restaurant
Plan an 80-seat restaurant in Excel, connecting lunch and dinner demand to seats, funded labor, startup investment, and 60 months of cash flow.
- Excel (.xlsx)
- Forecast: 60 months · 5 years
- Starting case: 80 seats · 3,000 sq. ft.
- Display: English · USD
Planning several types? Compare 17 restaurant formats
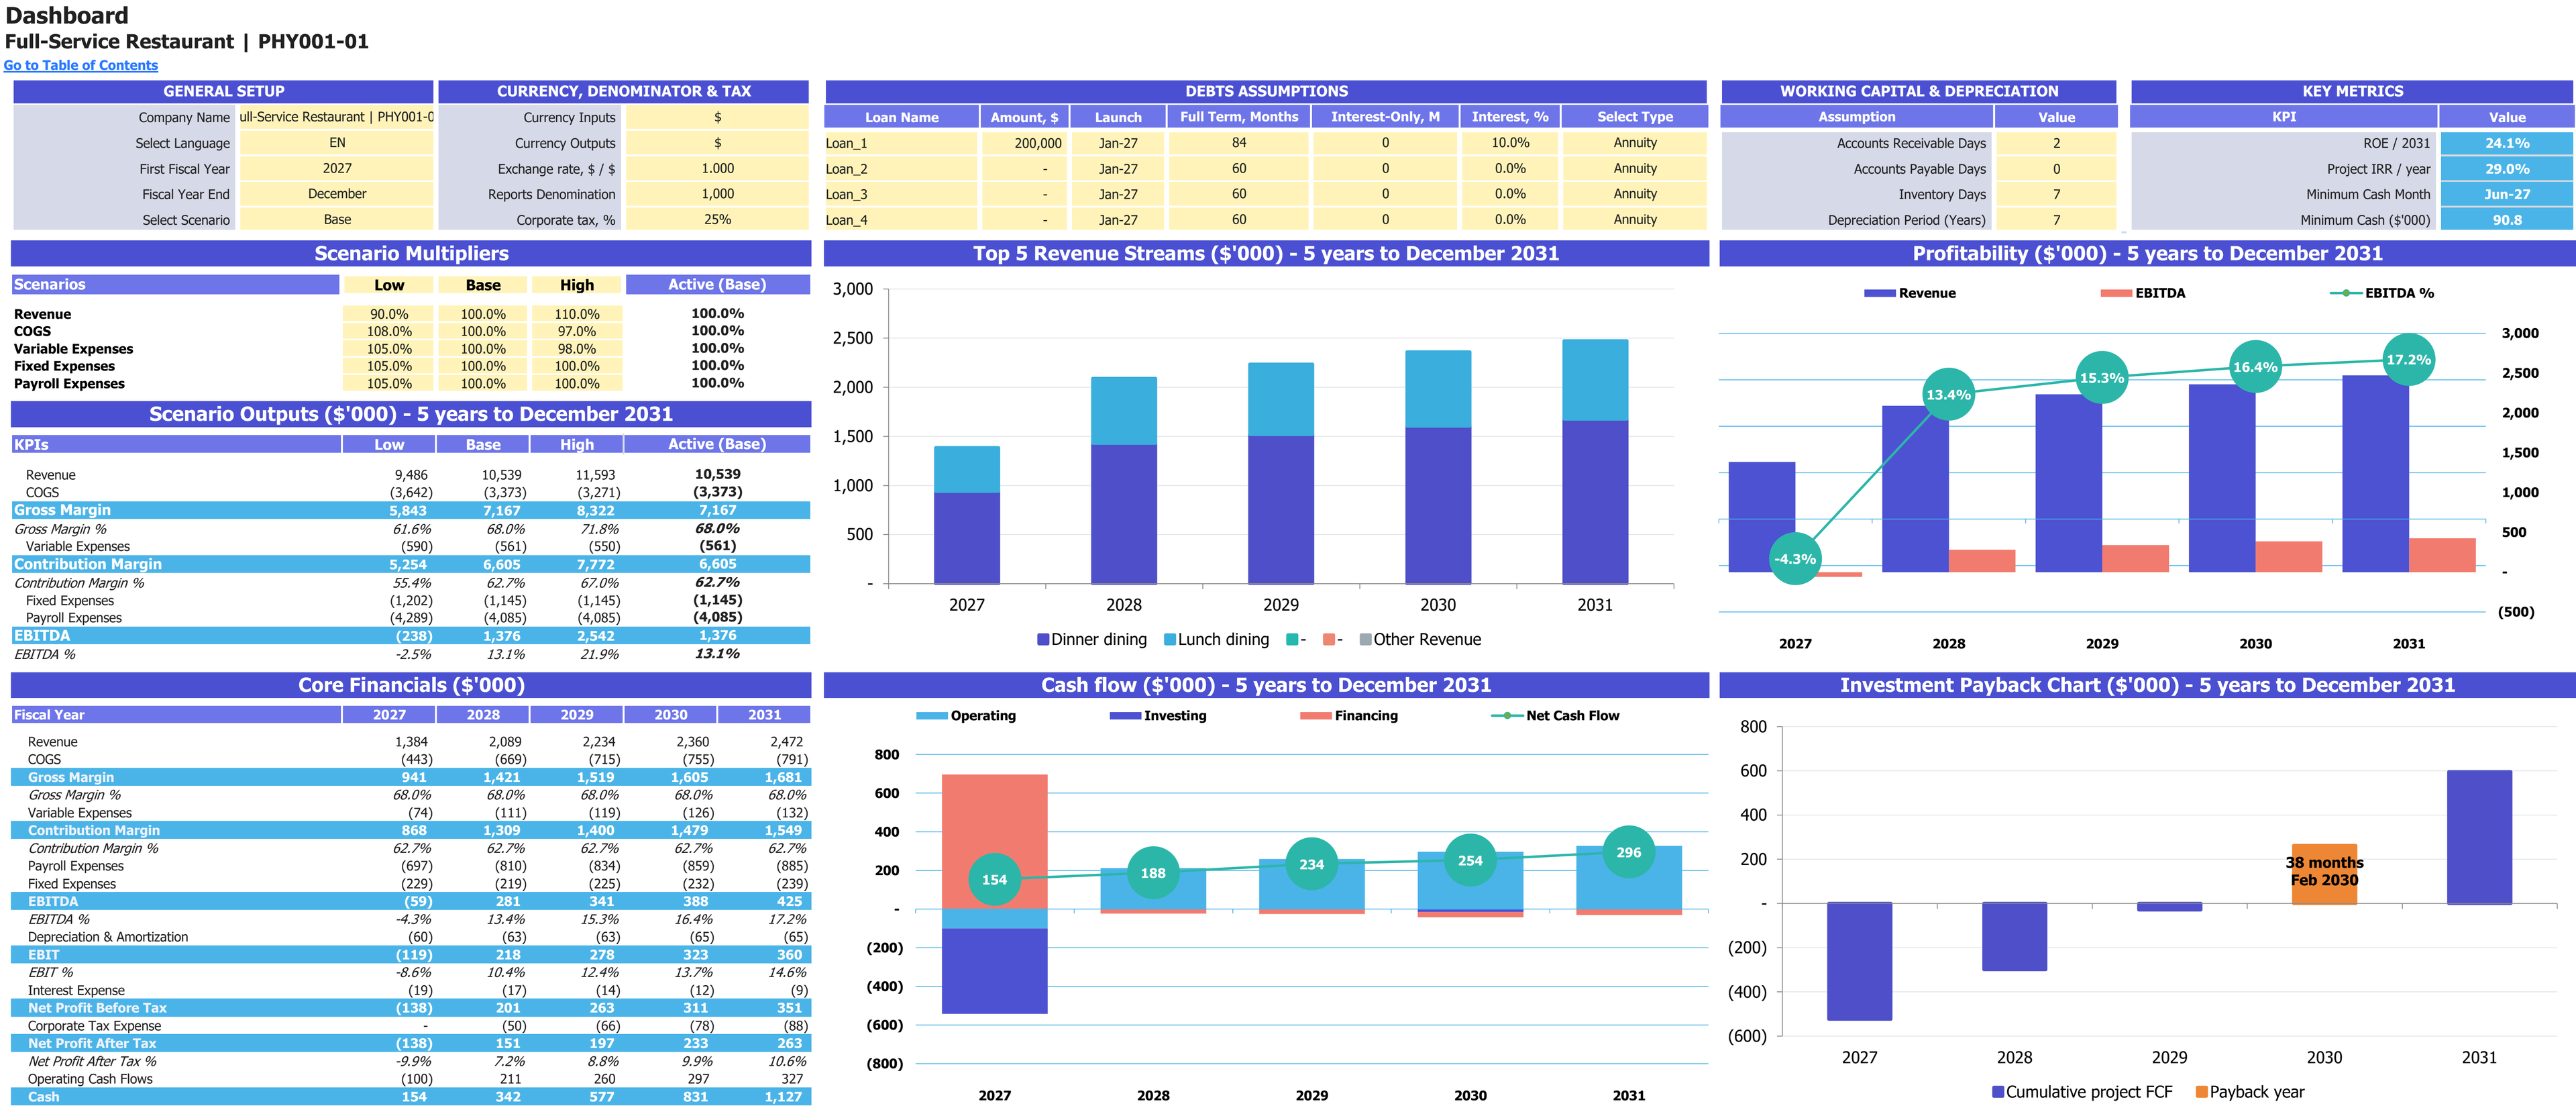
Base-case scenario controls, annual financial results and charts for 2027–2031. Financial report amounts are shown in thousands of USD; percentage measures retain their own units.
Enlarge image in a new tab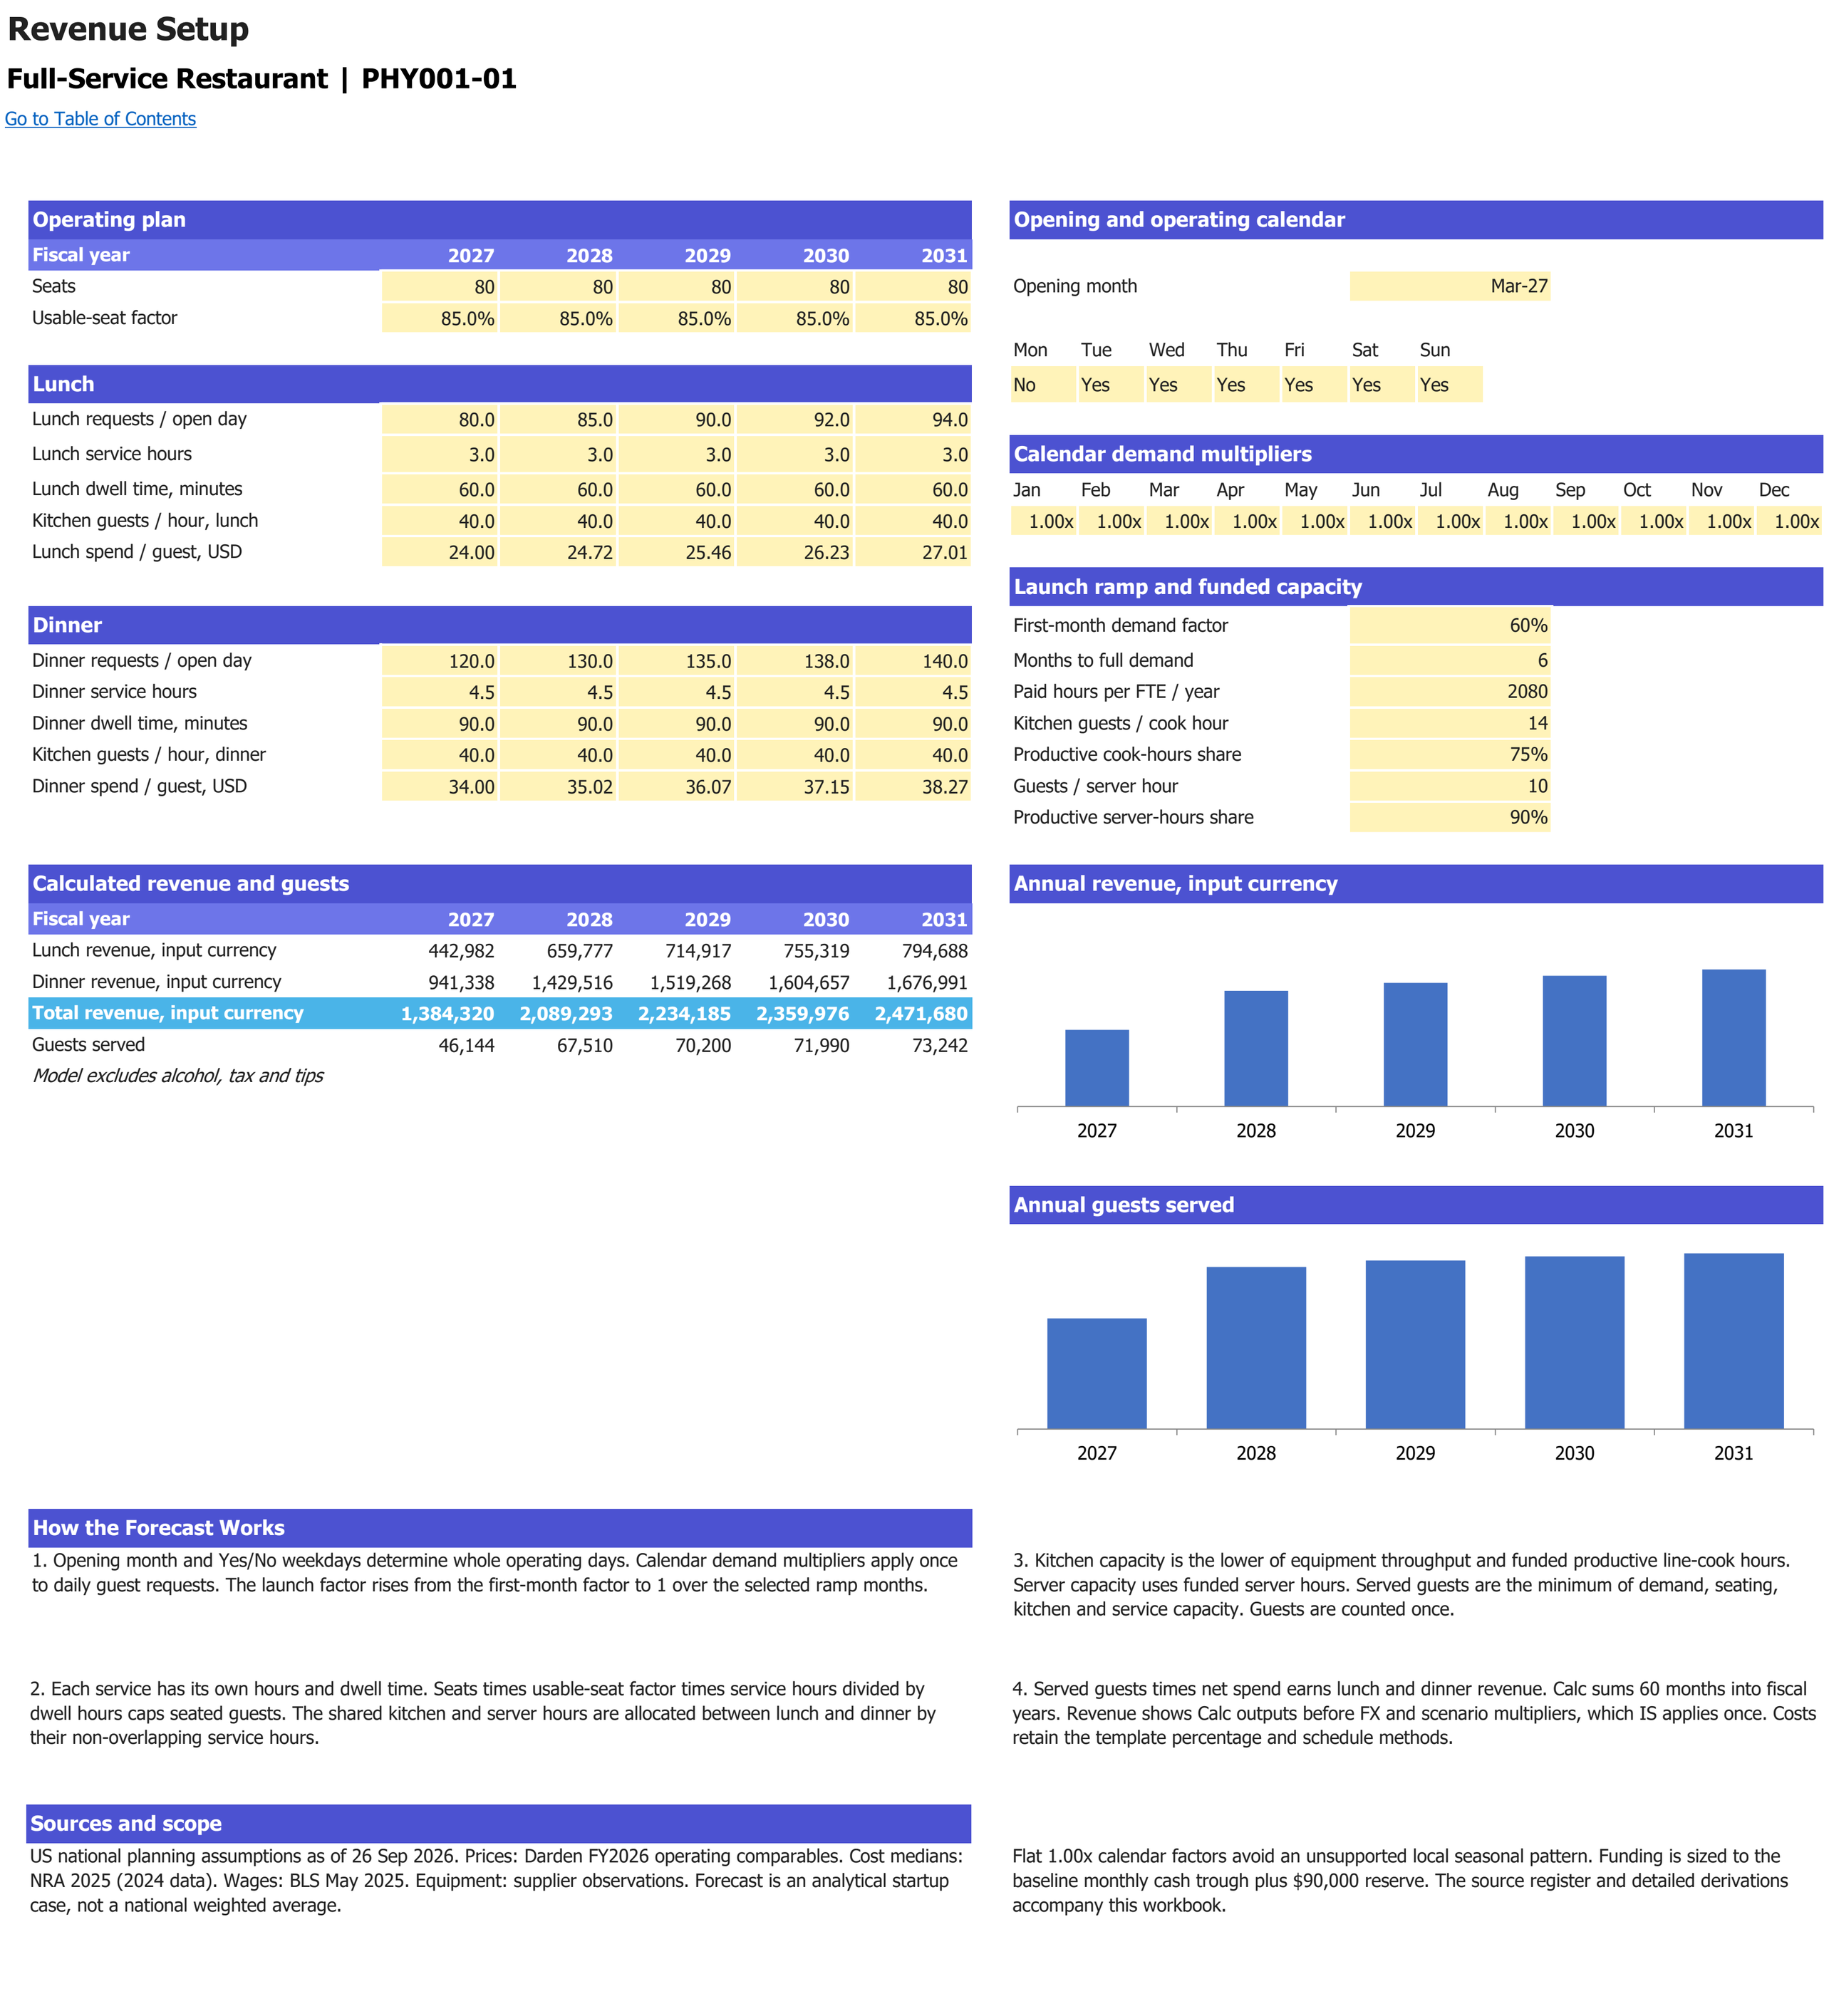
Seating, service time, kitchen capacity and guest demand assumptions with annual guest and revenue results. Monetary inputs and sales use USD; operating volumes retain their labelled units. Forecast years are 2027–2031.
Enlarge image in a new tab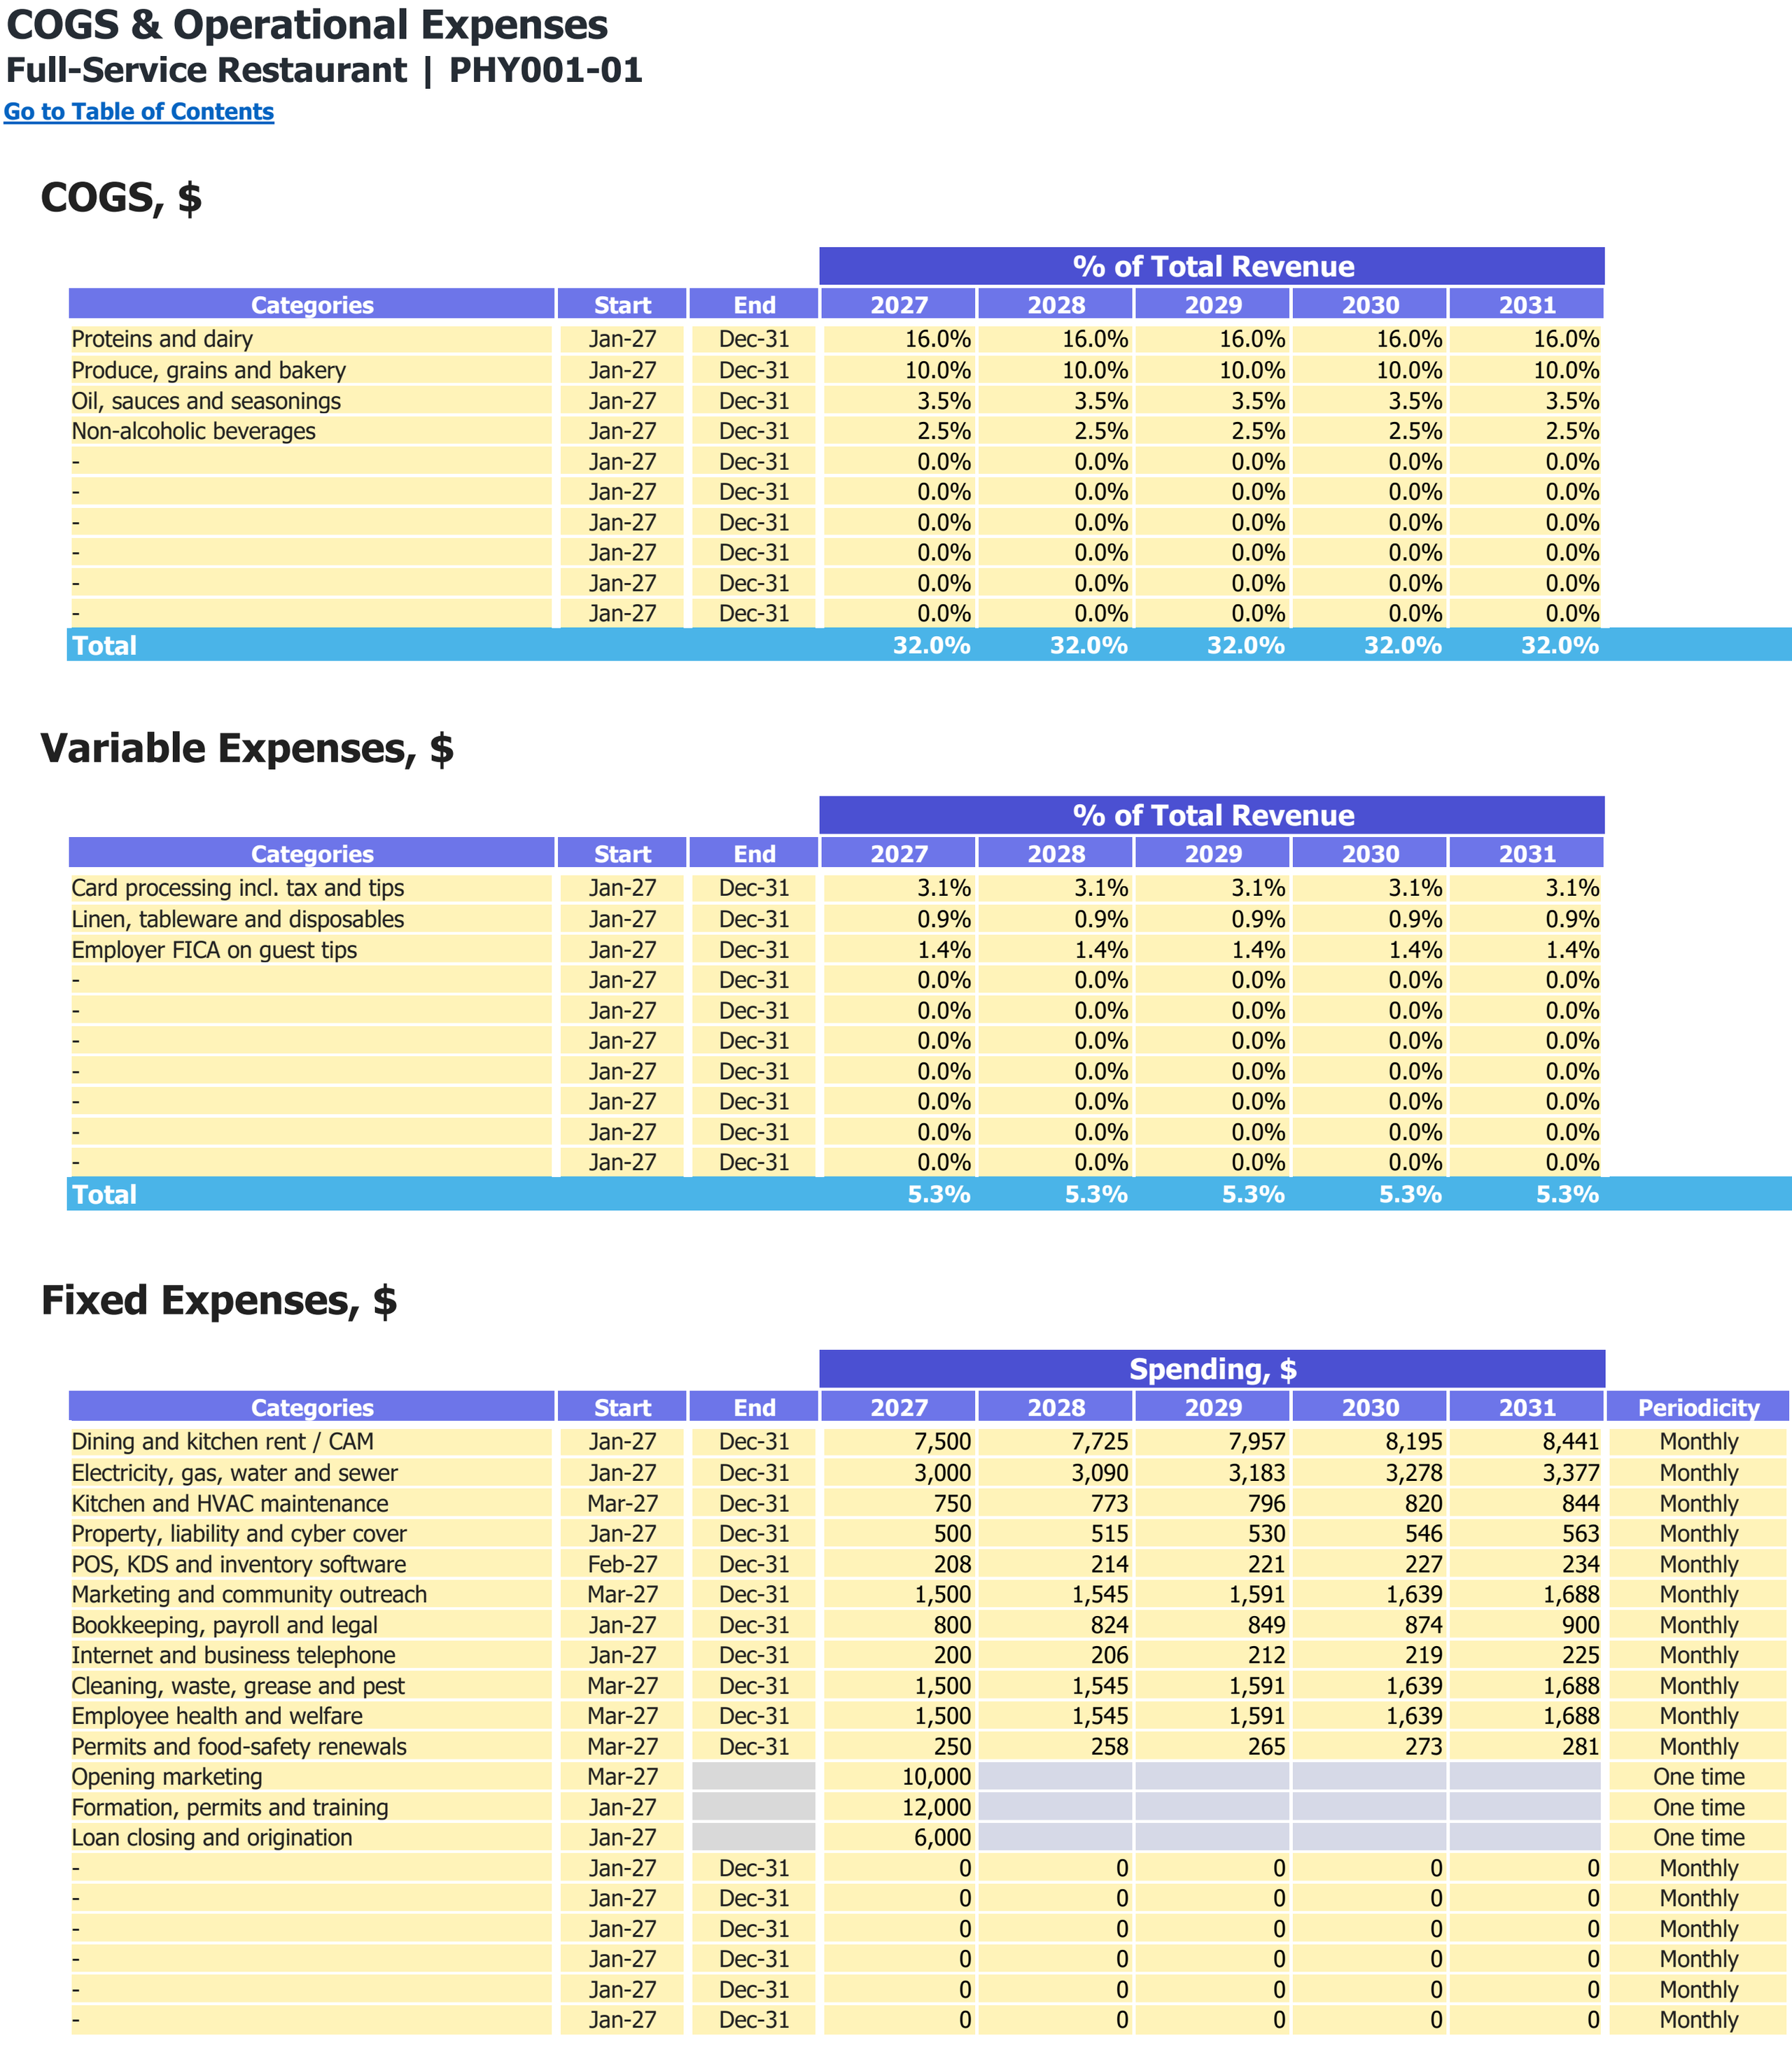
Food and other direct-cost categories, variable expense shares and fixed operating expenses. Monetary inputs are USD; the annual percentage columns are cost shares of revenue.
Enlarge image in a new tab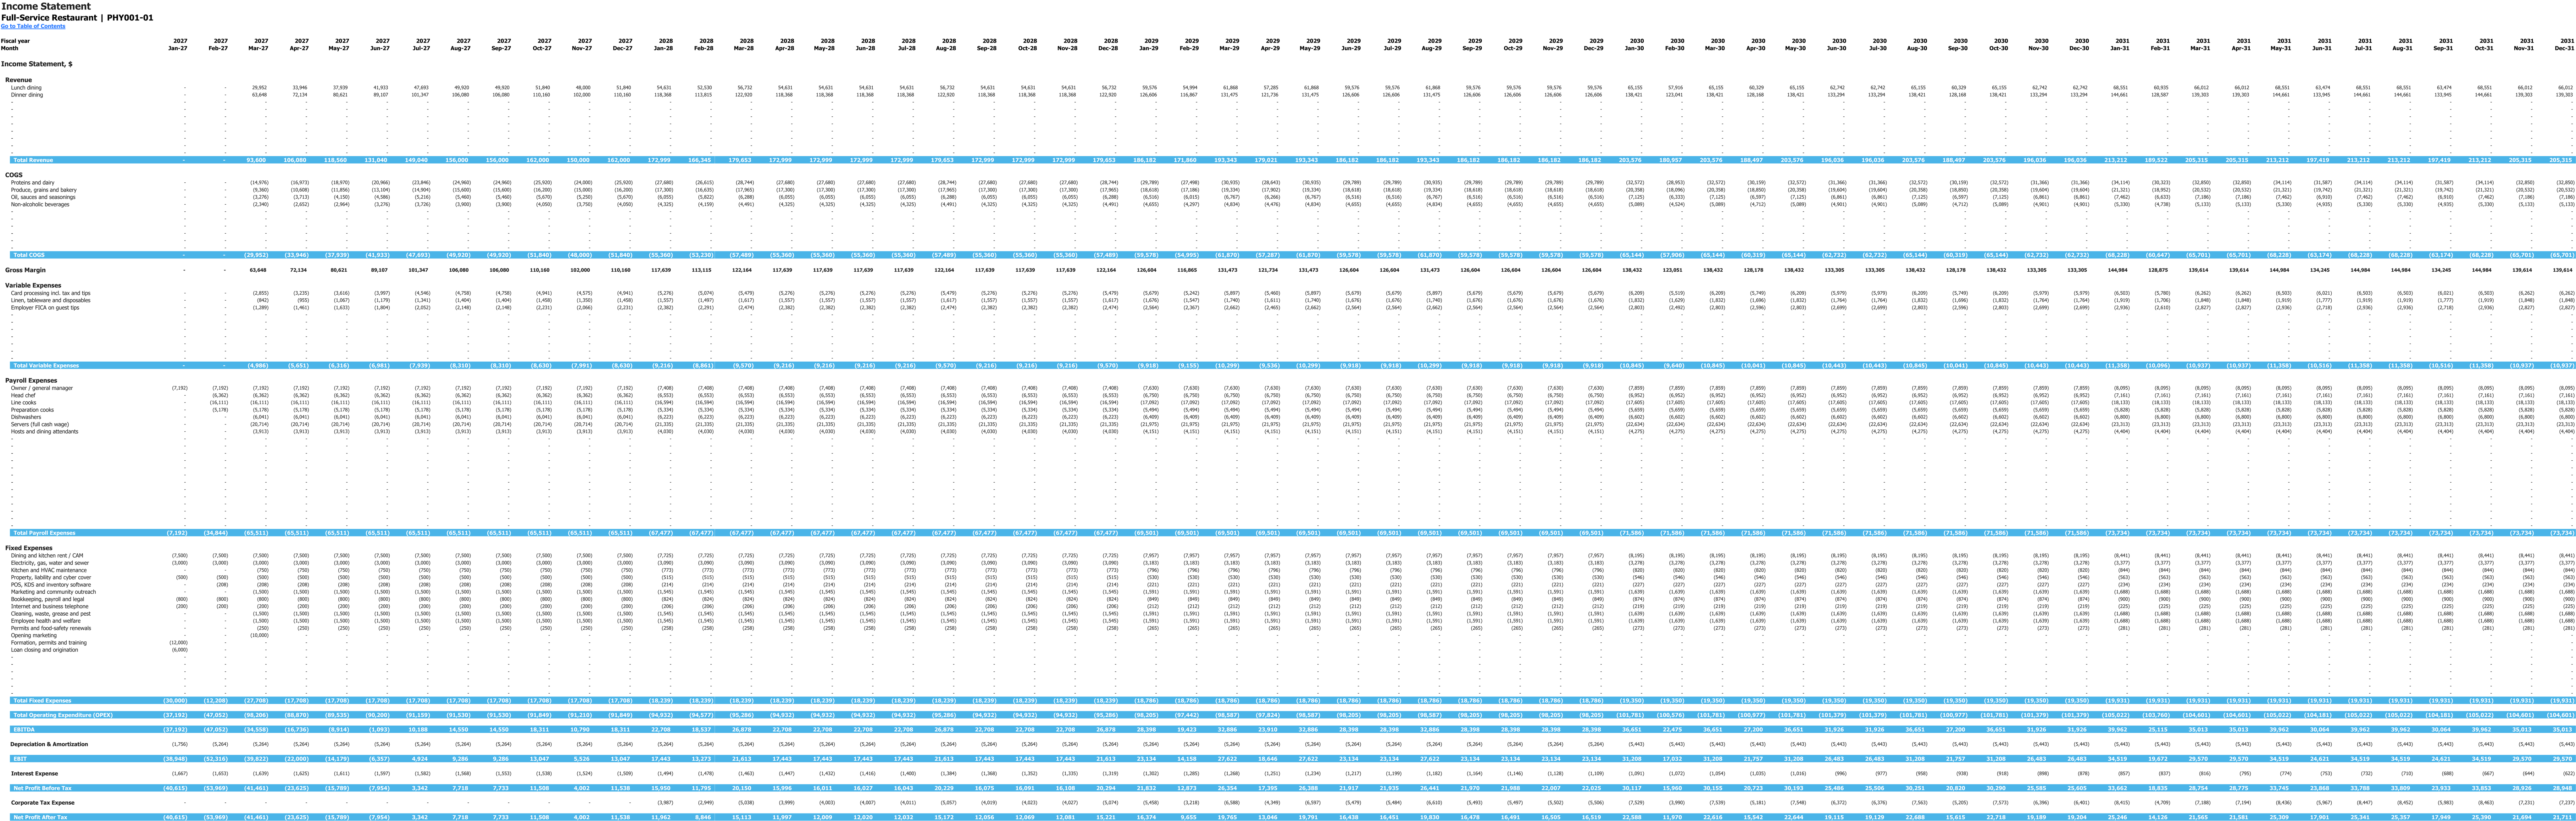
Monthly income statement for 2027–2031, in USD. This is an income statement view; it does not show payroll setup inputs. Enlarge to inspect the wide monthly table.
Enlarge image in a new tab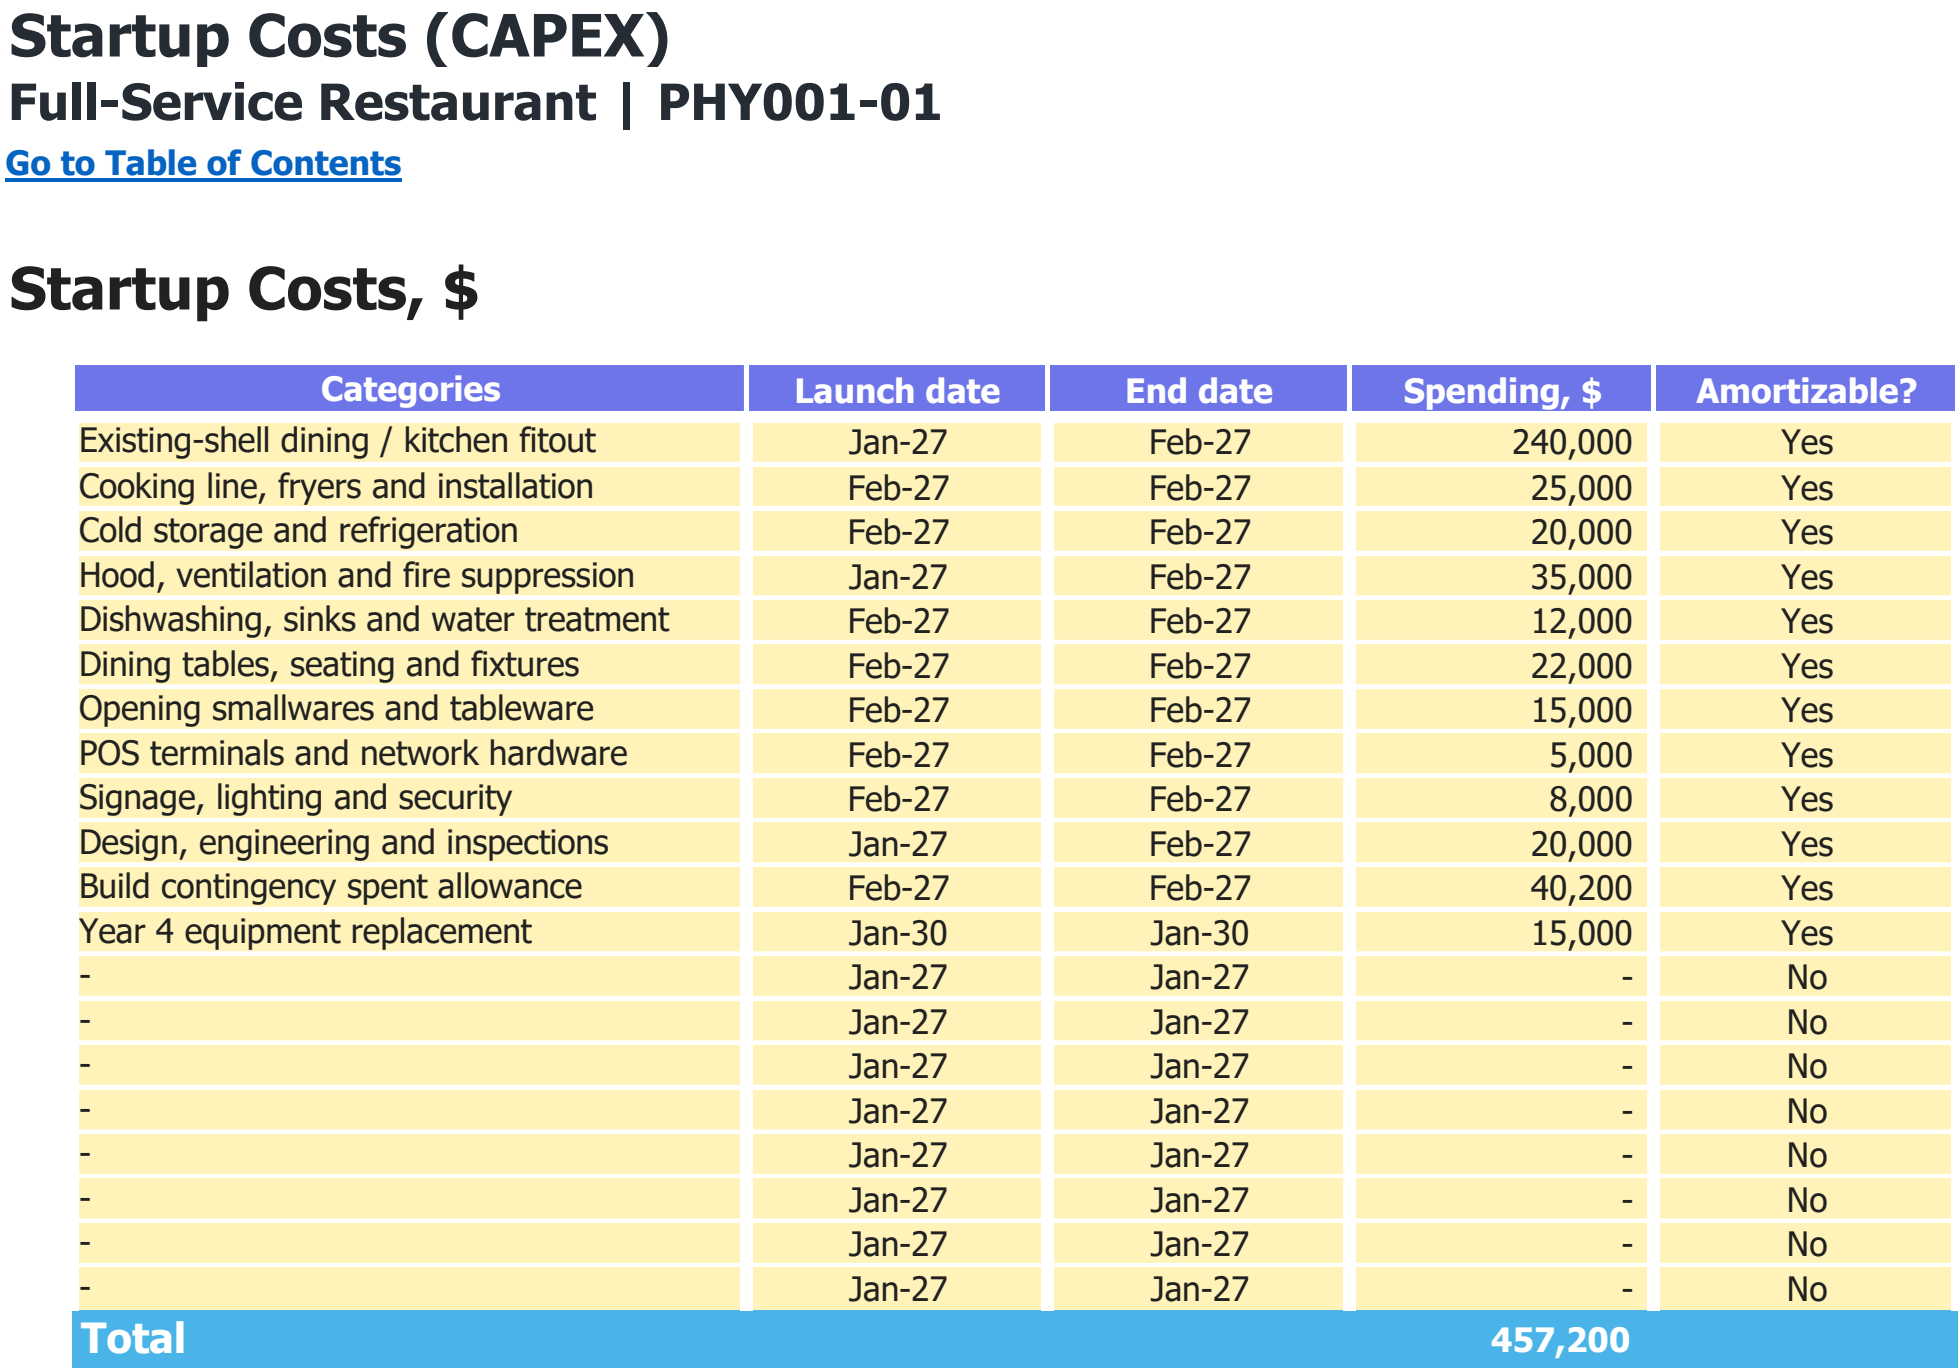
Asset categories, purchase dates and spending assumptions in USD. The total includes every scheduled purchase shown, including later replacements where present.
Enlarge image in a new tab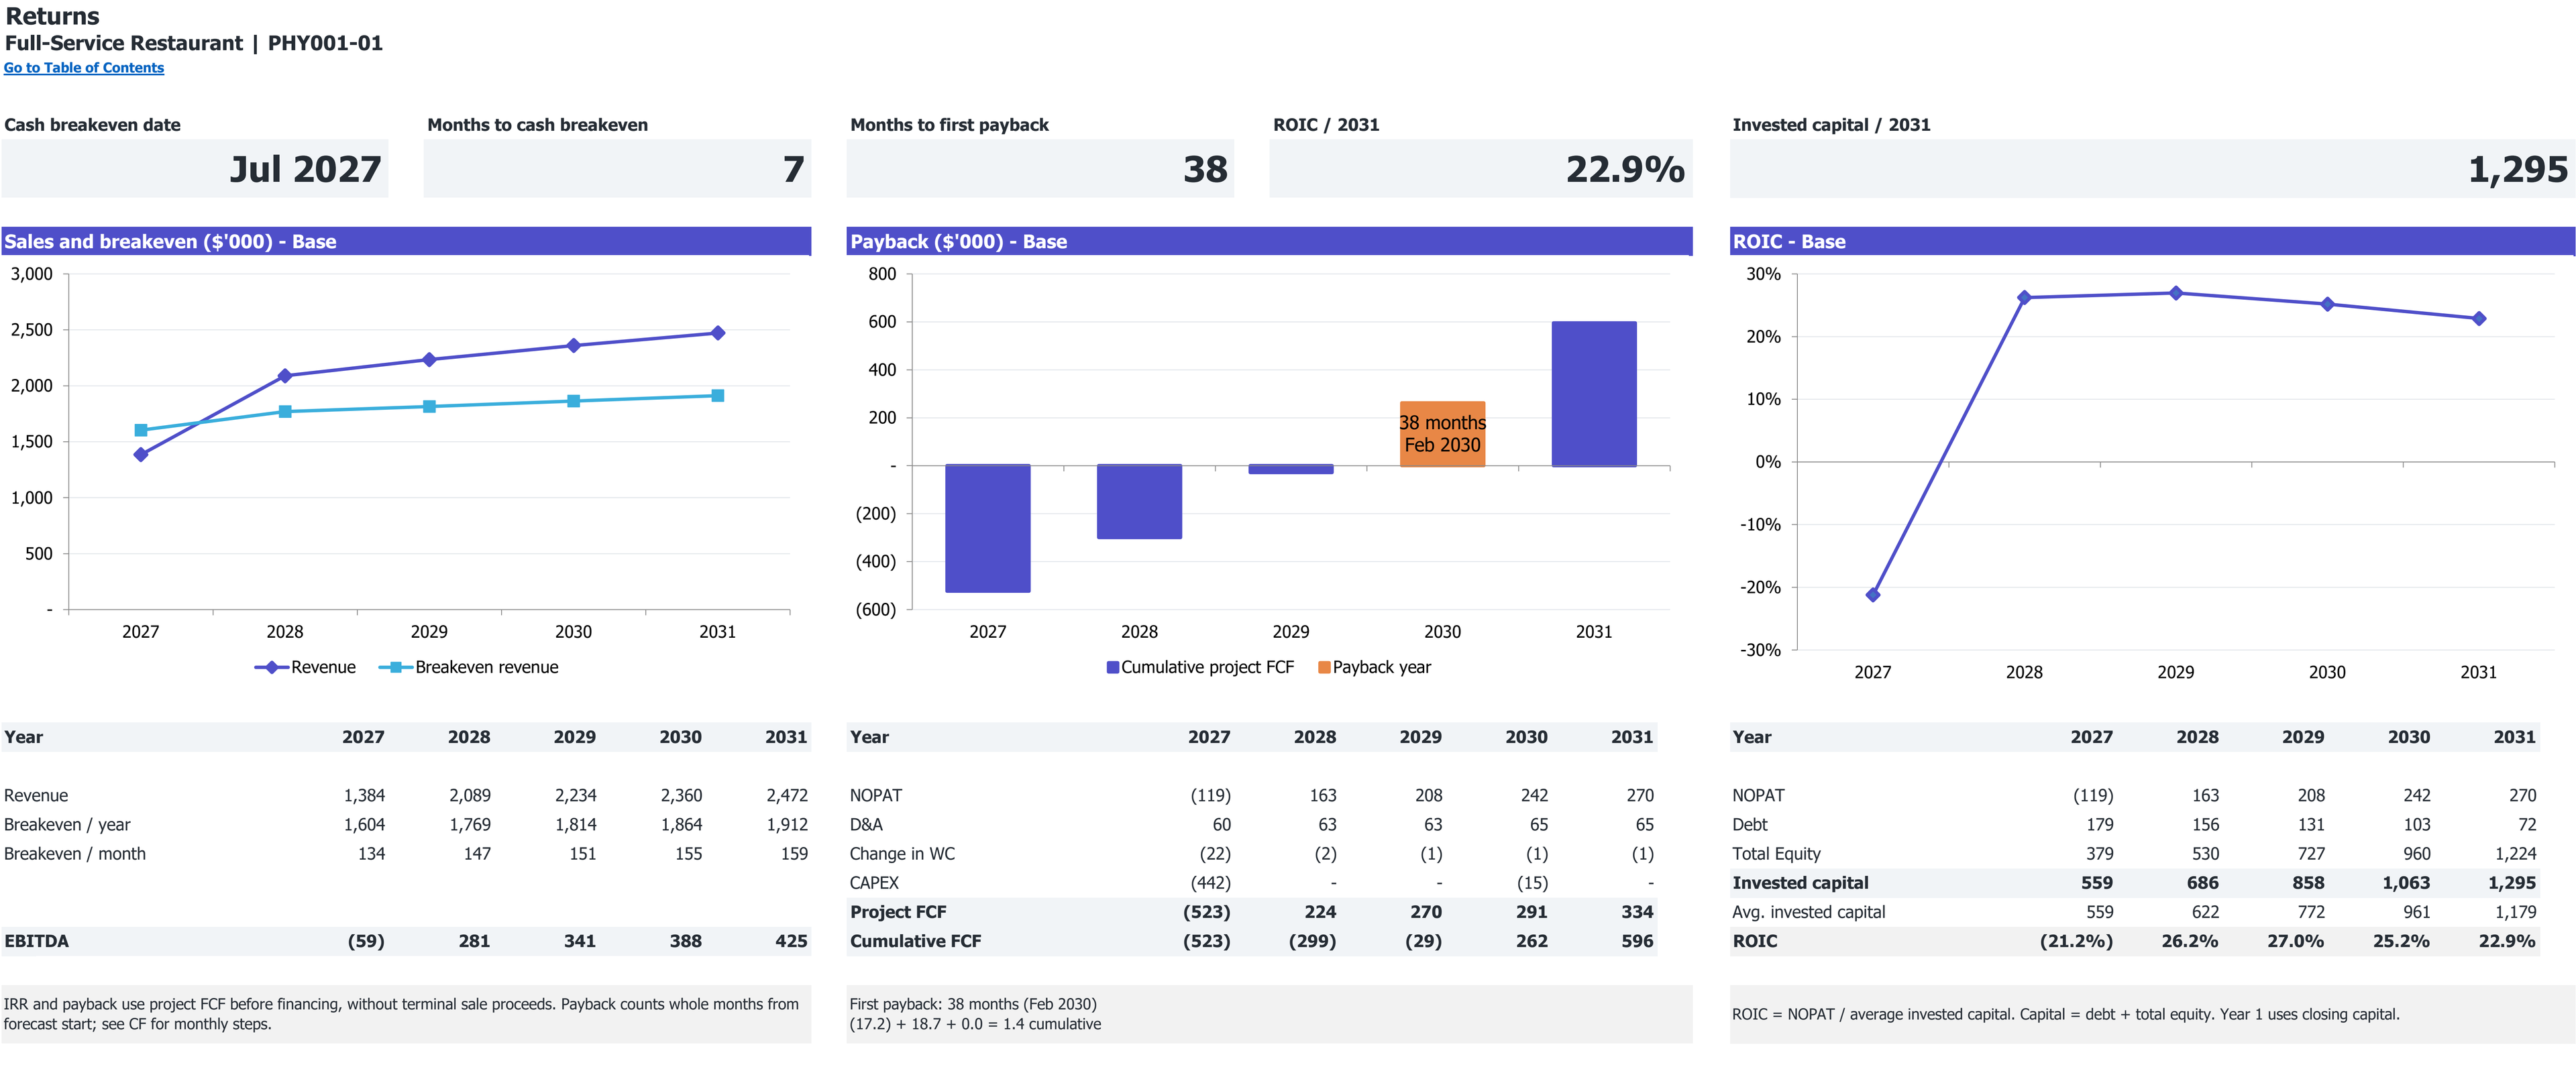
Excerpt from Returns: cumulative project free cash flow and first payback, if reached. 2027–2031 base case; dollar amounts in thousands.
Open full Returns view in a new tabExcerpt from Returns: revenue, annual and monthly break-even revenue, and EBITDA. 2027–2031 base case; dollar amounts in thousands.
Open full Returns view in a new tab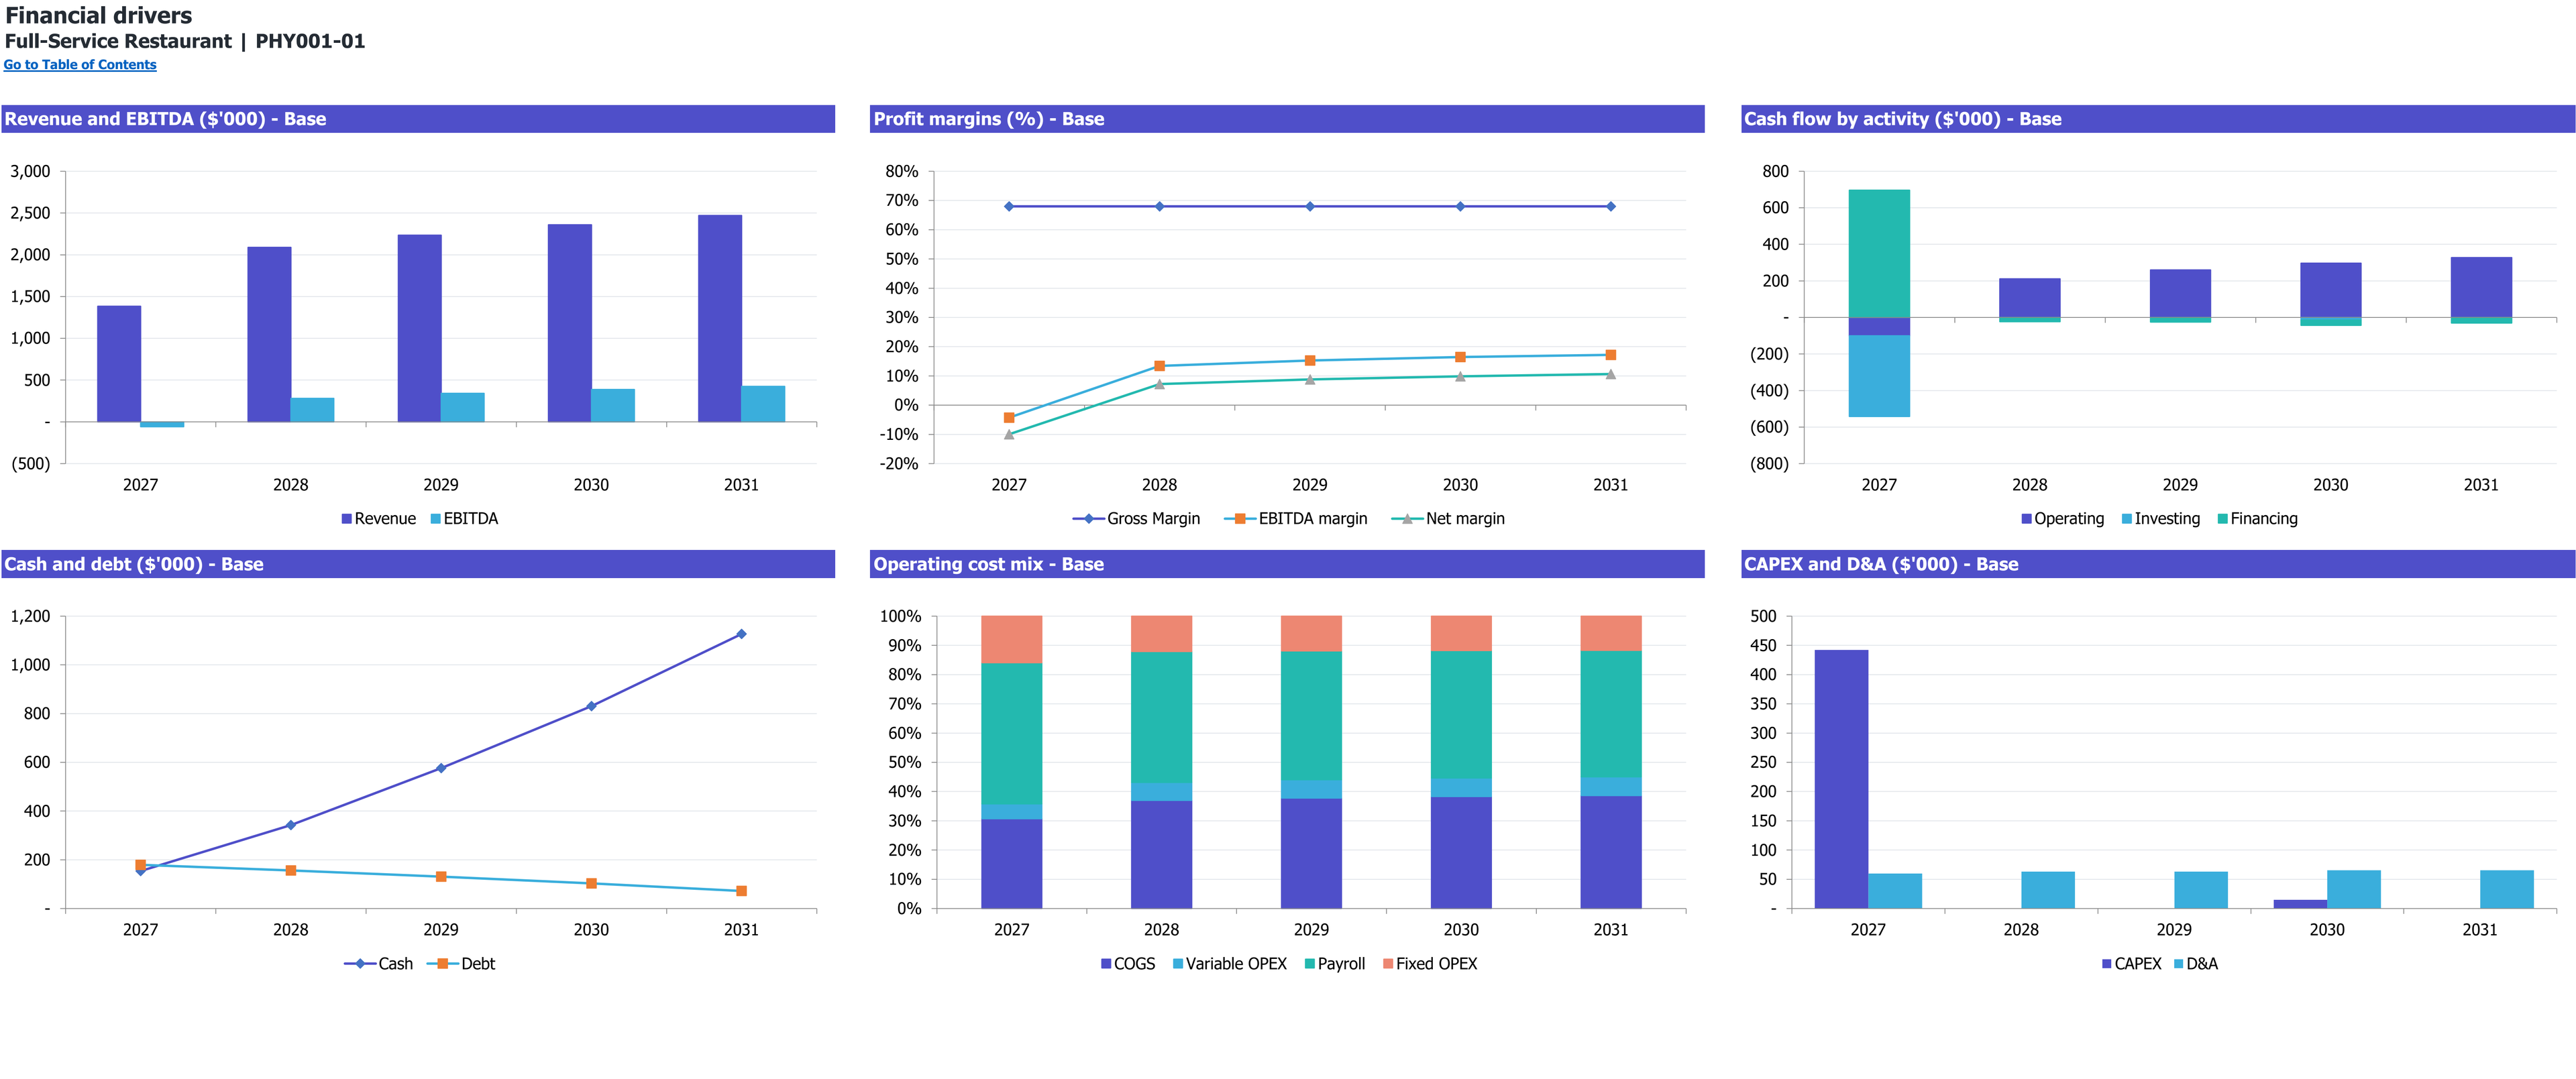
Six annual financial-driver charts for Full-Service Restaurant, 2027–2031 (Base scenario). Dollar amounts are in thousands; margins and cost mix are percentages.
Enlarge image in a new tab8 selected worksheet views. Figures show this workbook’s starting case.
Workbook availability
What is inside the Excel model
See whether a seated lunch-and-dinner operation can support its staffing and recover its opening investment. This workbook follows guests from practical service capacity through operating costs, financing, and cash.
Selected worksheets from the documented workbook. Forecast period: January 2027–December 2031. Model reference: PHY001-01.
Inputs you control. Results you can inspect.
On a small screen, scroll within the table to read every column.
| Planning area | Inputs you review | How they connect | Results to inspect |
|---|---|---|---|
| Demand and service | Open weekdays, requests per lunch and dinner, opening ramp, and net spend per guest. | Calendar trading days and served guests, capped by each service resource. | Monthly guest volumes and sales; annual revenue. |
| Practical capacity | Seats, usable-seat factor, service length, dwell time, equipment throughput, productive cook and server hours. | The lowest demand or capacity limit controls served guests. Shared labor hours are allocated once. | Capacity-constrained sales rather than unlimited demand conversion. |
| Staffing | Role-level FTE, pay, start dates, payroll load, and annual raises. | Paid labor cost and funded productive hours. | Payroll, labor intensity, and kitchen/service capacity. |
| Operating costs | Food-sales ratios, card and linen costs, employer tip tax, rent, benefits, and dated expense lines. | Variable costs follow sales; monthly and one-time expenses follow their schedules. | Income statement, margins, and operating cash flow. |
| Investment and funding | Opening and replacement CAPEX, receivable/inventory days, equity, loan terms, and tax rate. | Investment timing, working capital, debt service, and funded cash balances. | Cash trough, year-end debt, and project capital recovery. |
| Scenario review | Low/Base/High money multipliers and separately editable operating drivers. | Financial scenarios change revenue or cost amounts; physical capacity changes require operating-input edits. | Scenario cash gaps and financial results without automatic extra funding. |
Is this the right model for your business?
Check the starting case before changing the assumptions.
The starting operation
- One alcohol-free, casual restaurant in the United States, using an existing fitted shell.
- 80 seats across a 3,000-square-foot site, open Tuesday through Sunday for lunch and dinner.
- A March 2027 opening after two pre-opening months, with paid owner/manager labor and separate kitchen and service teams.
Check the boundary
A bar-led concept, delivery kitchen, caterer, or multi-location rollout requires a different operating structure. Those revenue streams are not included in this case.
Compare the other restaurant typesHow this business makes money
Connect the unit sold to the resources required by this operating case.
Revenue logic
Revenue = guests served × net spend per guest.
Lunch and dinner are limited by seating, equipment and funded staff. Sales exclude tax, tips and alcohol.
Why does a full-service restaurant need two labor-capacity checks?
A seated guest consumes both kitchen production and table-service time. Filling more seats cannot increase served volume once either the funded kitchen team or the funded service team becomes the binding limit. This case therefore constrains each meal service by demand, seat turns, equipment, cooks, and servers before applying guest spend.
- Unit sold
- A served guest, priced separately for lunch and dinner.
- Service footprint
- 80 seats; 3-hour lunch and 4.5-hour dinner; Tuesday–Sunday.
- Revenue boundary
- Dine-in food and nonalcoholic beverages; no delivery, catering, or alcohol.
- Resource coupling
- Funded cook and server hours are shared once across non-overlapping services.
What to establish for your own operation
- Observe requested guests by service and day before selecting the opening ramp.
- Test the actual menu against kitchen output and table-service work.
- Price the fitted shell, lease, deposits, and local opening requirements.
- Stress cash with realistic staffing and slower demand; do not infer capital recovery from one profitable month.
Follow the plan from demand to cash
Open each section for the assumptions, calculations, and limits of this workbook’s starting case.
Turn guest demand into a serviceable planRevenue
The starting case requests 80 lunch guests and 120 dinner guests per open day, rising to 94 and 140 by the fifth year. Opening demand ramps from 60% to 100% over six months. These are selected planning inputs, not measured traffic for a particular address.
Served guests are the minimum of demand, usable seat turns, equipment throughput, funded kitchen labor, and funded service labor. Lunch has a three-hour service and 60-minute dwell; dinner has 4.5 hours and 90-minute dwell. An 85% usable-seat factor allows for imperfect seating. Productive cook and server hours are allocated once across the two services.
Net spend starts at $24 for lunch and $34 for dinner, with approximately 3% annual escalation. Sales exclude sales tax, voluntary tips, and alcohol. No national seasonal pattern is imposed: calendar demand multipliers start at 1.00.
- Equipment is assumed to process 40 guests per hour; that throughput is an engineering assumption.
- Kitchen productivity is 14 guests per productive cook hour, with 75% of paid hours productive. Service is 10 guests per productive server hour, with 90% productive.
- Change labor and capacity alongside demand before interpreting a sales increase as feasible.
Budget the people required to deliver the servicePayroll
The funded team reaches 16.1 FTE: an owner/general manager, head chef, line and preparation cooks, dishwashers, servers, and hosts. Hiring starts across January, February, and March 2027. The owner receives compensation; servers receive a full employer-funded wage plus voluntary tips.
Employer load is 10.65% and pay increases 3% annually. Employee health and welfare are separate fixed expenses. Paid hours are based on 2,080 hours per FTE per year, while only the specified productive share contributes to capacity.
Food and nonalcoholic beverage costs are 32% of net sales. This is a sales-based cost schedule, not a recipe and yield model. Variable expenses include 3.05% card processing, 0.9% linen/consumables, and 1.377% employer FICA on tips. Rent/CAM starts at $7,500 per month for the selected site.
- The rent allowance is not a restaurant lease quote and includes no refundable deposit.
- Fixed costs include utilities, maintenance, insurance, software, marketing, administration, cleaning, benefits, and permit renewals.
- Sales-based food cost increases when selling prices increase; it does not hold ingredient cost per guest constant.
Separate opening works from retained cashCAPEX
Initial capital spending totals $442,200. It assumes a reusable fitted shell, including $240,000 for dining/kitchen fitout plus kitchen equipment, ventilation, refrigeration, furniture, smallwares, technology, signage, and professional work.
The initial total includes a $40,200 build contingency, calculated as 10% of $402,000 of other opening uses. That allowance is spent CAPEX in this case. A separate $15,000 equipment replacement occurs in January 2030, taking 60-month CAPEX to $457,200.
Funding arrives in January 2027: $517,000 of owner equity and $200,000 of debt. The loan assumes 10% fixed annual interest and 84 monthly annuity payments with no grace period. These are selected terms, not a lender commitment. Seven-year book depreciation starts as spending occurs and is not a tax depreciation schedule.
- Operating losses, interest, and working capital are included in the cash forecast; adding them again to the cash trough would duplicate them.
- A $90,000 retained-cash target is distinct from the build contingency.
- Equity and debt remain fixed inputs after changes. Recheck the cash requirement when the case changes.
Read cash, operating break-even, and payback separatelyCF
Base-case 2027 revenue is $1,384,320 across ten operating months, while EBITDA is negative $58,843. The first year includes pre-opening activity. By 2028, a full operating year, revenue is $2,089,293 and EBITDA is $280,830. These are modeled outputs, not expected returns for another restaurant.
With the selected debt and debt service but without equity, cash reaches negative $426,186 in June 2027. Adding $517,000 of equity produces a funded minimum cash balance of $90,814. Working capital assumes two receivable days, seven inventory days, and zero payable days.
Operating break-even is July 2027, the first active month with nonnegative EBITDA, EBIT, and operating cash flow, sustained thereafter in Base. Project payback occurs in February 2030 when cumulative undiscounted unlevered free cash flow crosses zero. Counting starts in January 2027, includes opening and replacement investment, and uses whole months. Shareholder distributions are zero, so this is not realized owner payback.
The Low money scenario has minimum cash of negative $220,200 and 60-month EBITDA of negative $237,604. The same funding does not cover that scenario. Financial multipliers are sensitivity tests, not probabilities or changes to physical guest demand.
- Unlevered project free cash flow excludes interest, financing flows, and terminal-sale proceeds; operating cash flow includes interest.
- The six KPI groups cover net guest spend, sales per paid hour, food cost, labor and benefits, occupancy, and pretax margin.
- The 2031 pretax margin of 14.2% is an ambitious case supported by rising traffic/prices with broadly fixed staffing, not a typical restaurant margin.
Selected results from the starting case
Modeled results in USD unless stated otherwise. These describe the selected inputs, not an estimate for your location or a guaranteed outcome.
- 2027 revenue
- $1,384,320Base · USD · ten operating months after a March opening.
- 2027 EBITDA
- −$58,843Base · USD · includes two pre-opening months.
- Initial CAPEX
- $442,200USD · includes the $40,200 spent contingency.
- Minimum funded cash
- $90,814Base · June 2027 · after $517,000 equity and $200,000 debt.
- Operating break-even
- July 2027Base · month 7 · EBITDA, EBIT, and operating cash flow nonnegative.
- Project payback
- February 2030Base · month 38 · cumulative undiscounted unlevered FCF from January 2027.
Make the case your own
Work from the operating plan toward the cash requirement.
Confirm the seated-service scope and replace the calendar, opening date, guest requests, and net spend with your operating case.
Set practical seats, equipment output, service times, and funded staff together. Check that paid and productive hours are not confused.
Replace rent, wages, food ratios, fixed costs, and installed CAPEX with evidence for the intended site and specification.
Review monthly cash, debt service, and the Low case. Resize fixed funding if necessary, then compare operating break-even with unlevered project payback.
Interpretation and scope
- The U.S. national research case is not an observed average, premises approval, lease quotation, or local demand study.
- A 25% blended planning tax rate is used without a selected state or loss carryforwards.
- Food costs follow sales percentages rather than recipe quantities; money scenarios do not change physical capacity.
- No alcohol, delivery, catering, lease deposit, shareholder distribution, or exit proceeds are included.
- Software compatibility, license, support, and update terms must be confirmed for a future purchase; none is implied by the Excel file format.
The workbook is an Excel file for local planning. Learn how to interpret assumptions and evidence.
Other restaurant types
Each operating type calls for its own financial structure.
Questions
Does increasing lunch demand always increase sales?
No. Revenue uses guests served after seat, equipment, kitchen, and service labor limits. A higher request count has no effect when another resource is already binding.
Is owner labor included?
Yes. The owner/general manager is one paid FTE starting in January 2027 at $78,000 annual base pay before the modeled load and future raises.
Does the food budget track recipes?
No. Food and nonalcoholic beverage COGS starts at 32% of net sales, split into four purchasing groups. It does not calculate recipe yields or waste per dish.
Is the $442,200 opening investment the entire funding need?
No. It is initial CAPEX. The cash forecast also includes pre-opening expenses, trading deficits, debt service, and working capital. Base funding is $717,000, including a separate retained-cash reserve.
Does February 2030 payback mean the owner receives the investment back?
No. It is project recovery measured by cumulative unlevered free cash flow. The case has zero shareholder distributions, and loan payments follow a separate schedule.
Will funding resize itself in the Low scenario?
No. Equity and debt are fixed inputs. Low minimum cash is negative $220,200, identifying a funding gap that requires a revised operating or financing plan.
Can I use this case for a restaurant with a bar?
The starting model excludes alcohol. Bar sales, inventory, service, equipment, and licensing would require a separately justified operating adaptation.
Are these numbers an estimate for my location?
They describe one researched national planning case. Replace traffic, wages, installed costs, lease terms, and local requirements before drawing conclusions about a specific site.
Can I buy this model now?
No. Purchasing and workbook downloads are not available on this site.
Which software does the workbook use?
The documented file is an Excel workbook (.xlsx). Compatibility with other spreadsheet applications is not established by the file extension.
Read the planning guides
Explore the relevant operating questions and how to interpret a workbook’s assumptions.
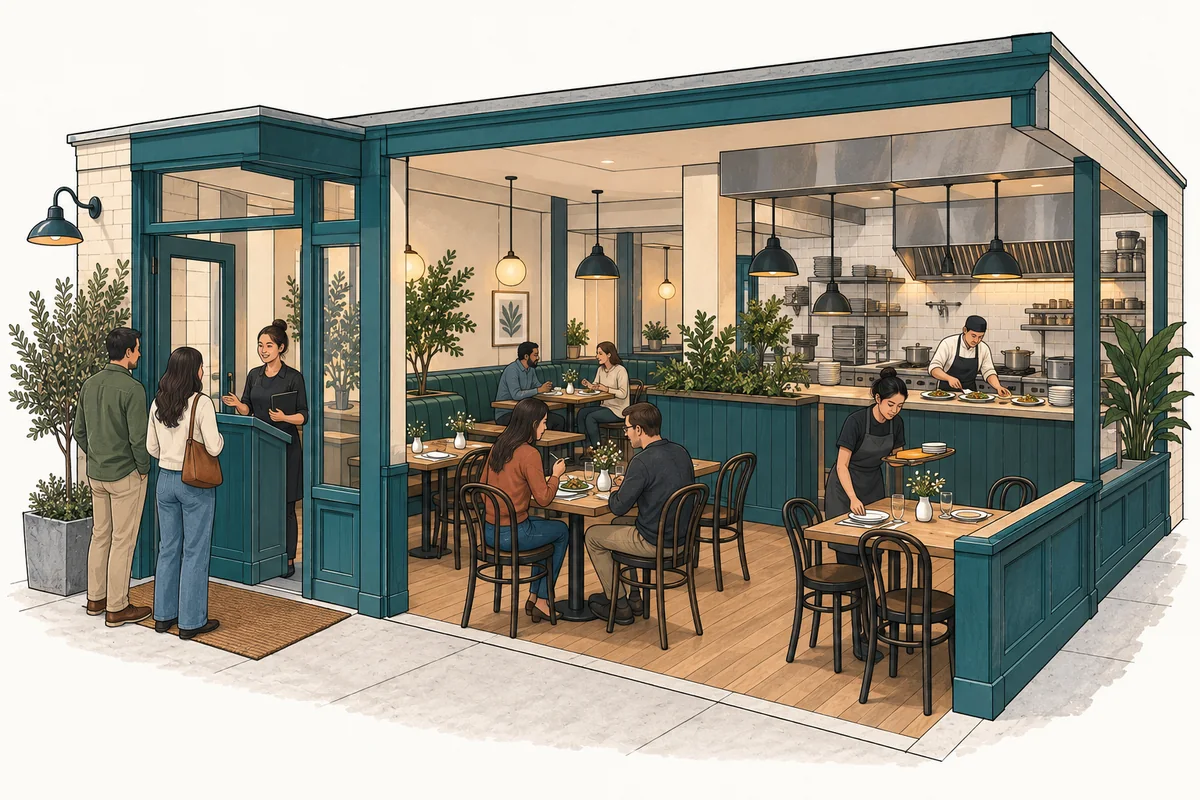
Why more restaurant demand does not always mean more revenue
Follow restaurant demand through seats, equipment, and funded staff hours to understand which guests can actually be served and billed.
Read the guide
Which restaurant business idea fits the way you want to operate?
Choose among dine-in, pickup, delivery, catering, and a temporary residency by comparing the customer promise, operating work, and commitments each creates.
Read the guideHow to open a full-service restaurant with a workable service plan
Build a restaurant opening sequence around the menu, premises, paid shifts, service rehearsals, and cash commitments that must work together before launch.
Read the guideEvidence and scope
A related category or operator is referenced. Do not interpret the link as independent proof of this exact configuration or its viability.
The links below provide operating-format context; they do not verify the workbook’s selected inputs or calculated returns.
The workbook guide and figures describe model PHY001-01, revision r03, for January 2027–December 2031. These are a documented planning case, not observed results for a particular business.