
Restaurant Financial Model: Quick-Service Restaurant
Plan counter and kiosk orders, shared kitchen capacity, paid handover, recipe costs and startup cash for an independent quick-service restaurant.
- Excel (.xlsx)
- Forecast: 60 monthly periods / five calendar years
- Starting footprint: 2,000 sq ft / 32 seats
- Opening schedule: March 2027 / seven days per week
- Sales unit: Fulfilled order; meal equivalents drive food
Planning several types? Compare 17 restaurant formats
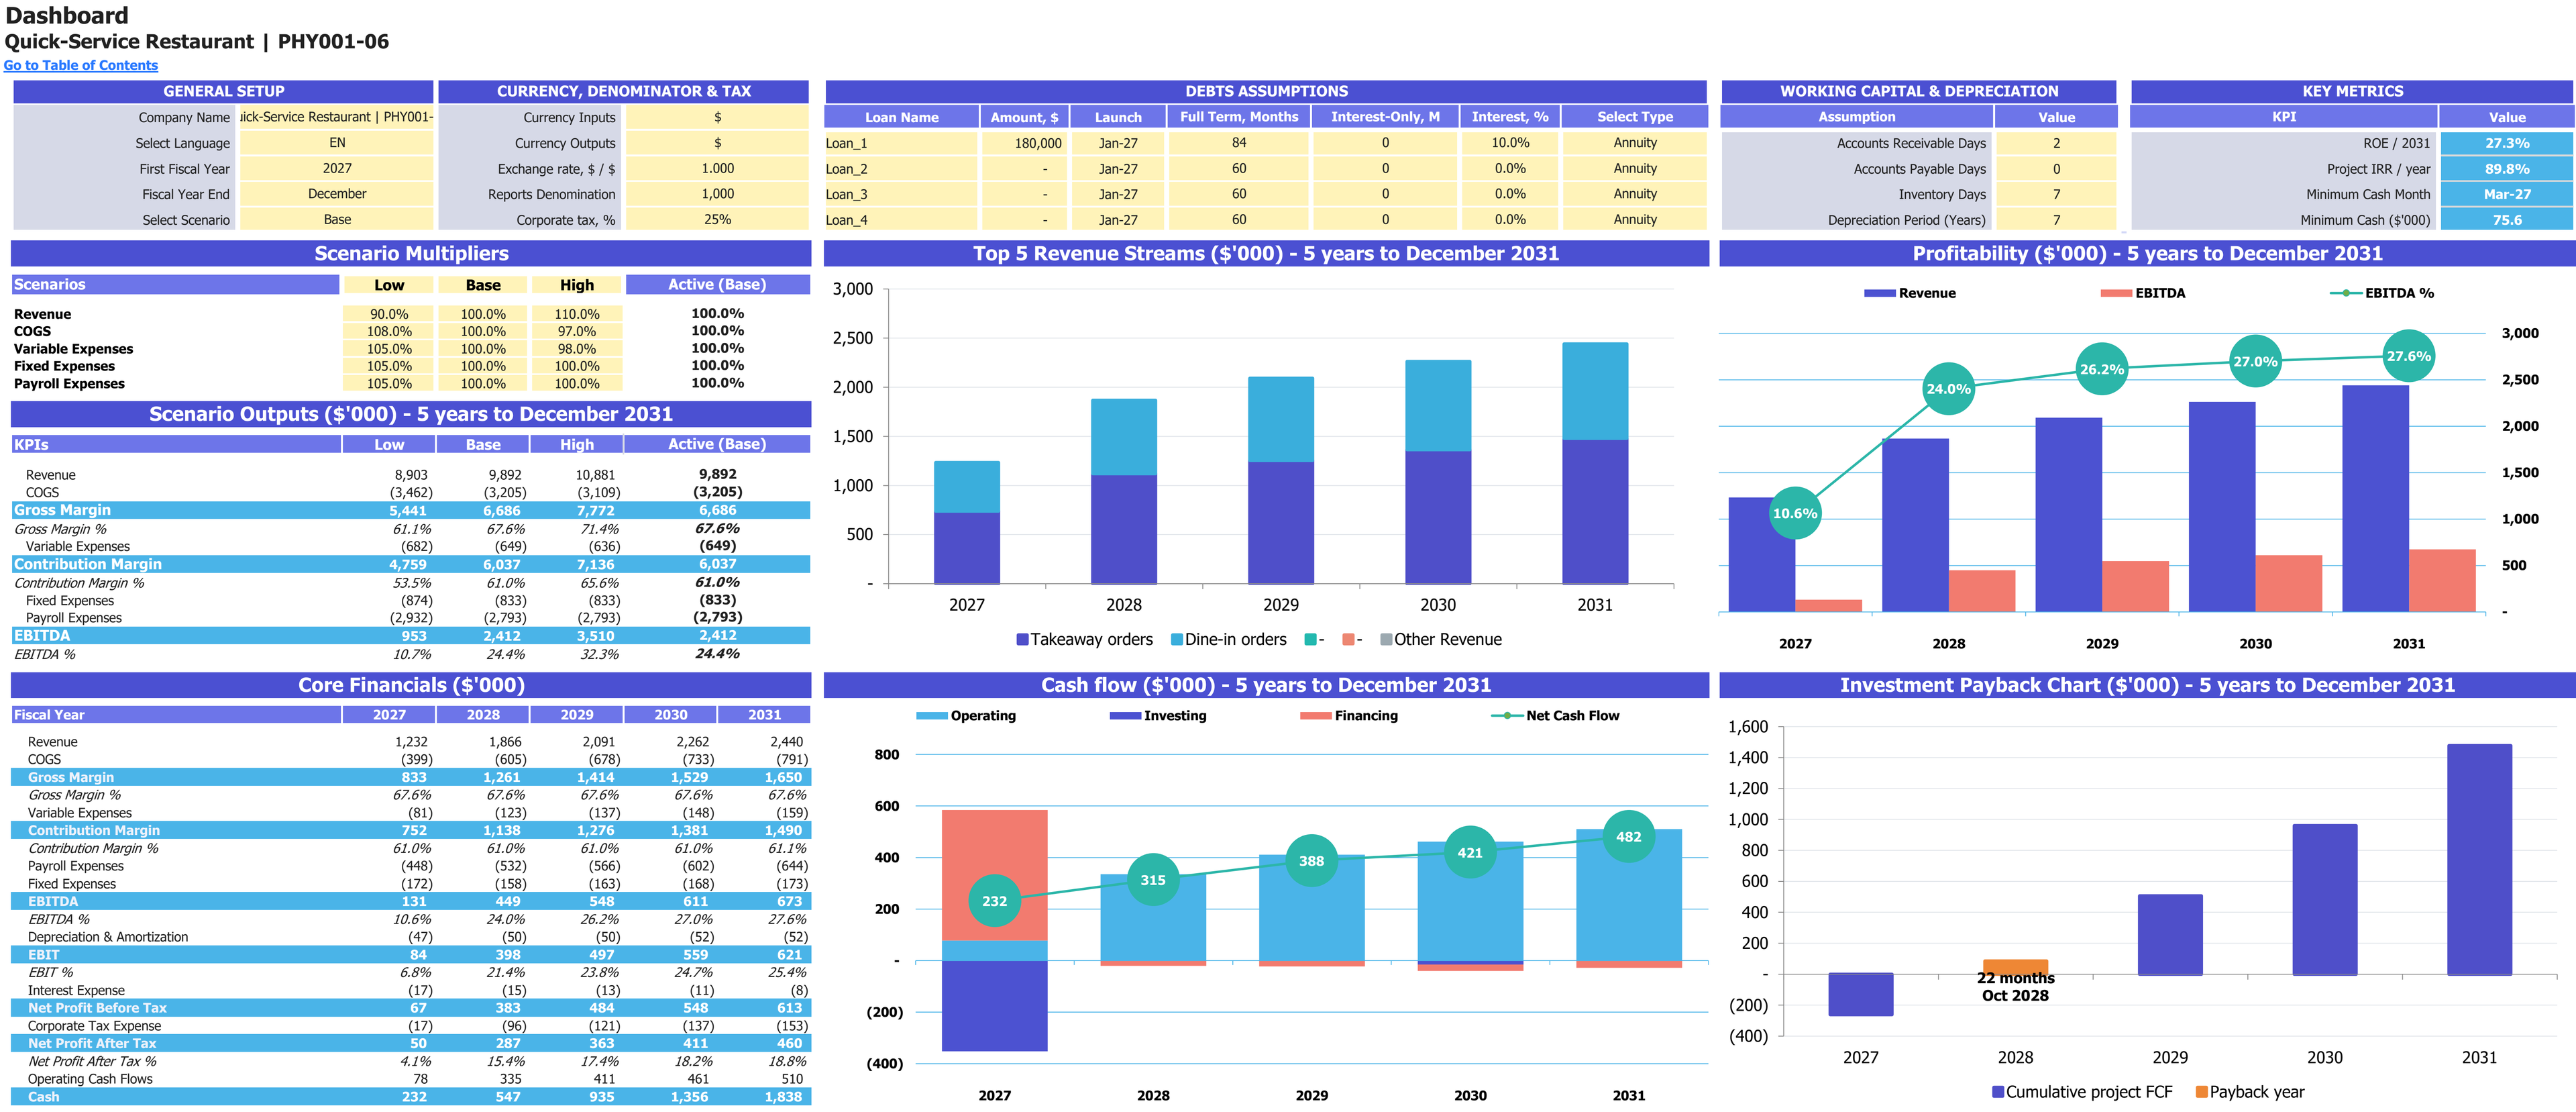
Base-case scenario controls, annual financial results and charts for 2027–2031. Financial report amounts are shown in thousands of USD; percentage measures retain their own units.
Enlarge image in a new tab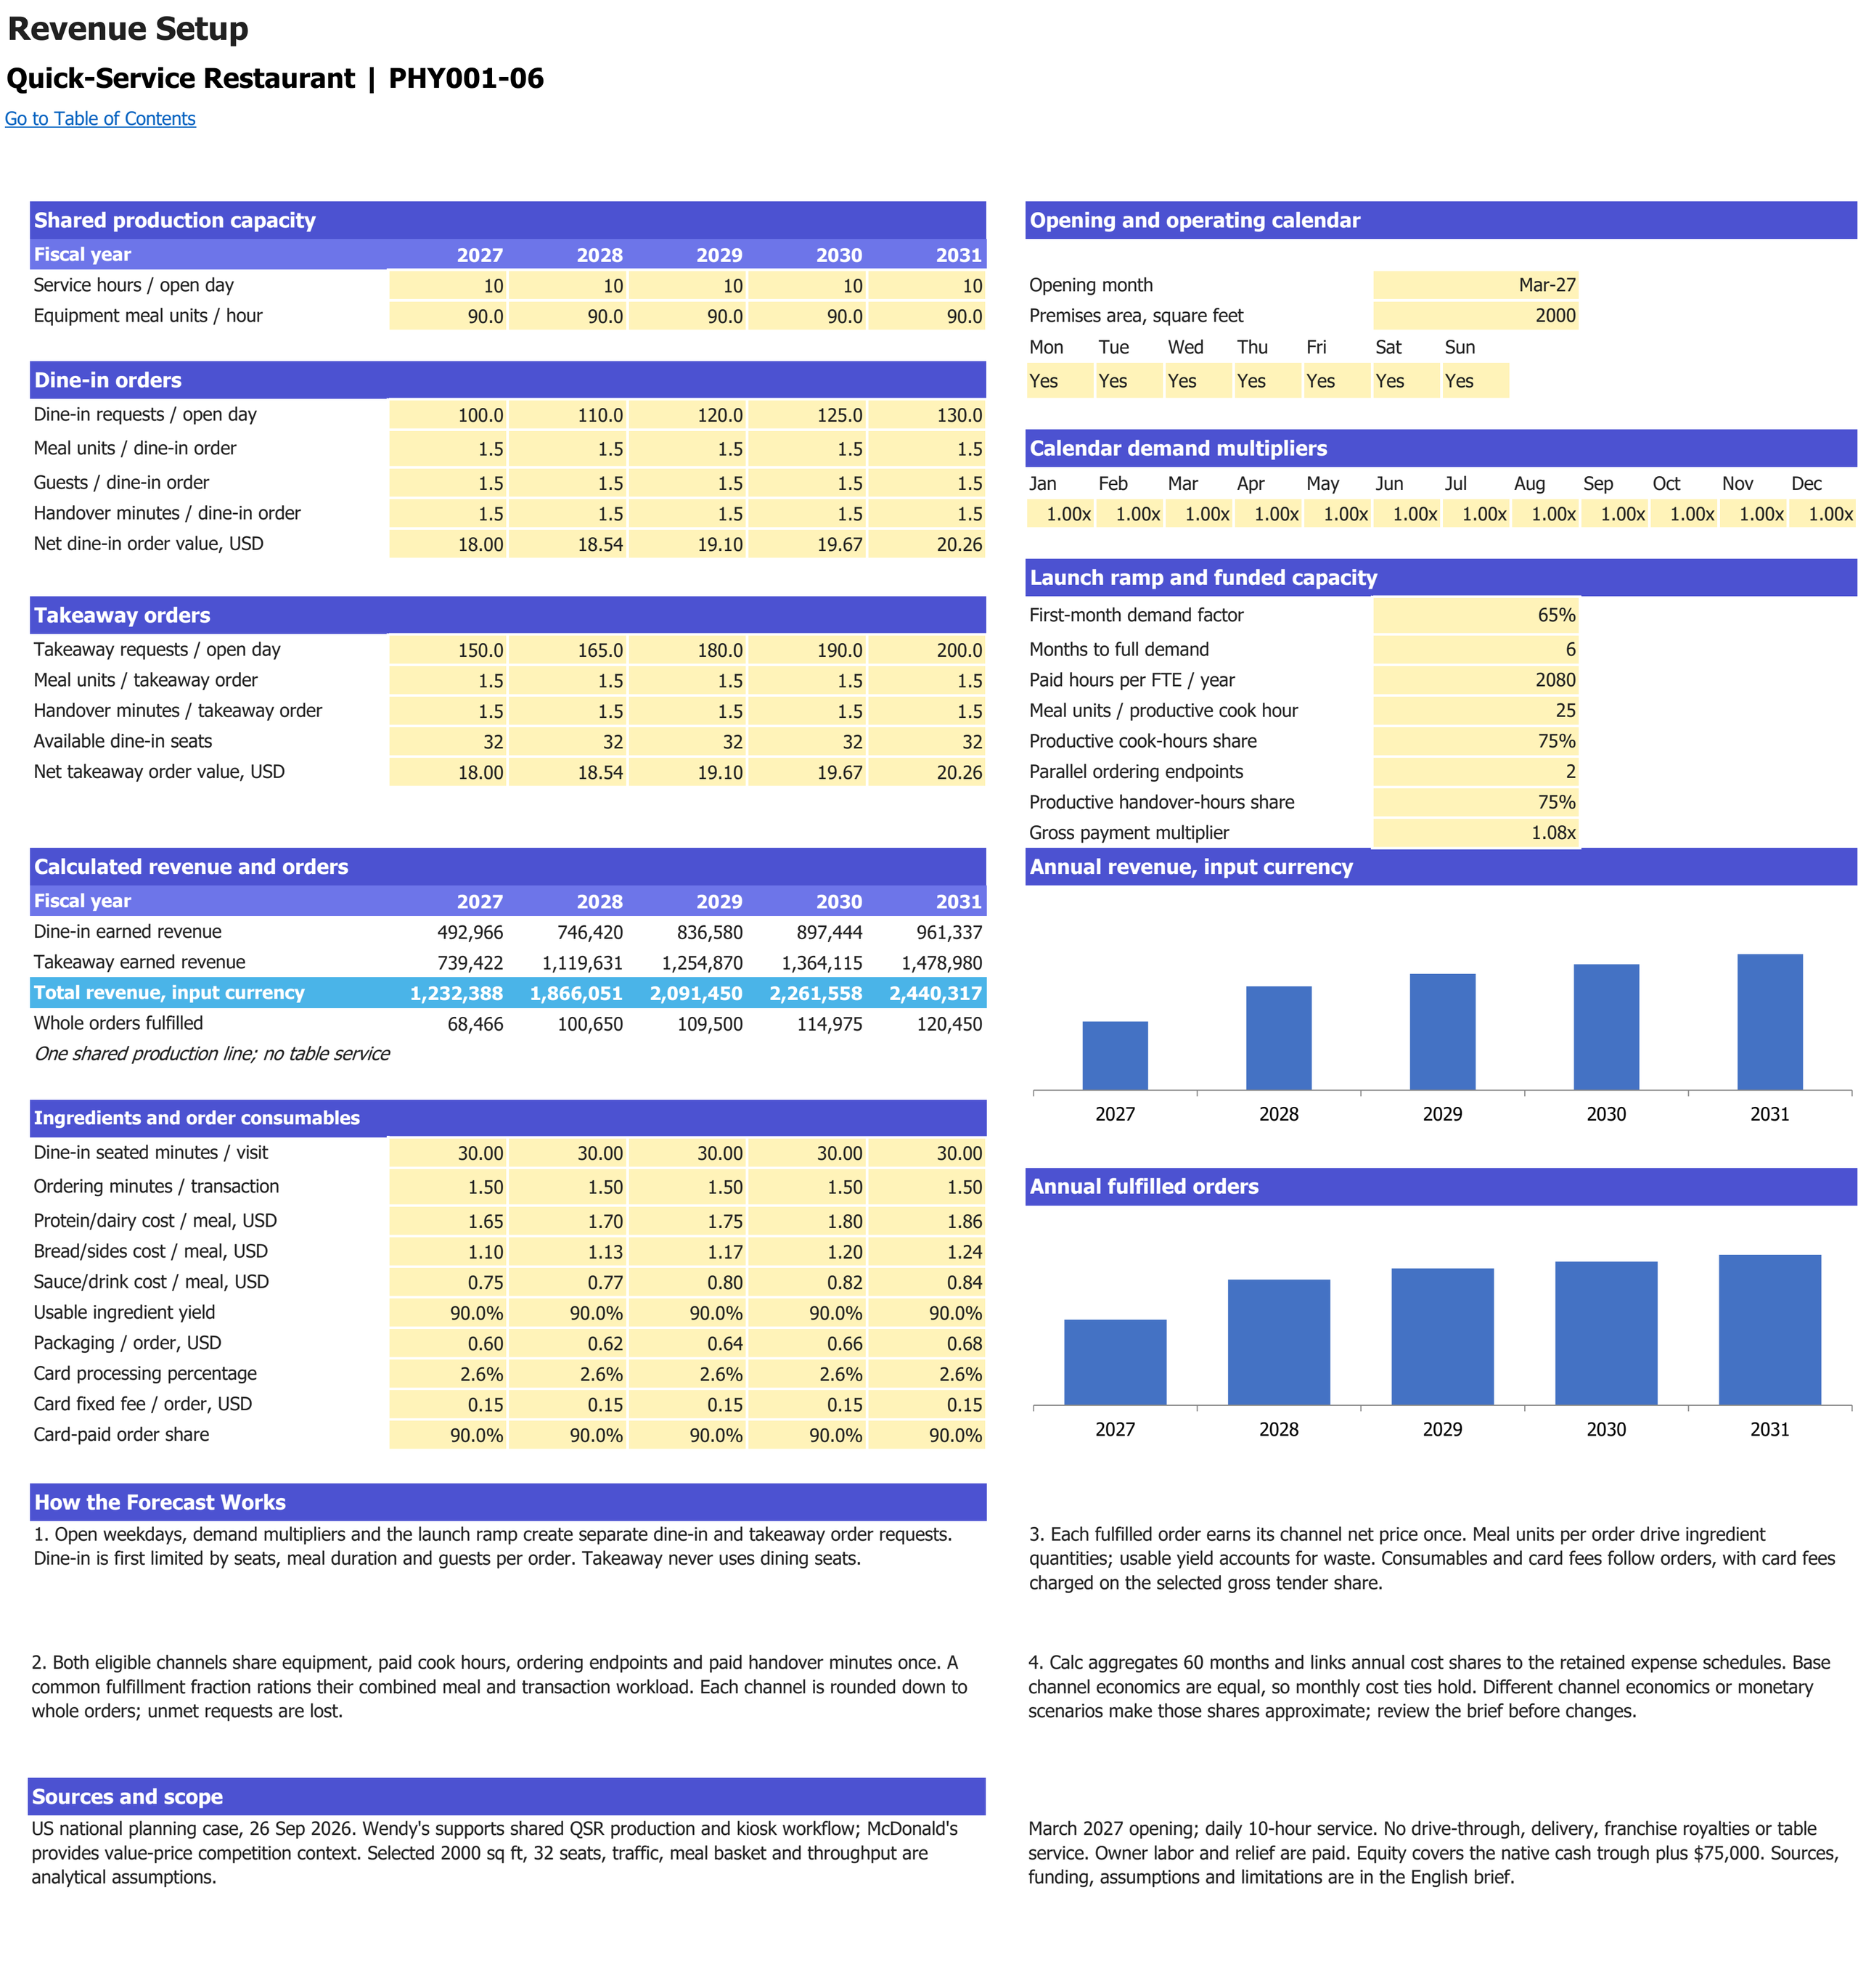
Dine-in and takeaway demand, meal-equivalent production, seating and order handover limits. Monetary inputs and sales use USD; operating volumes retain their labelled units. Forecast years are 2027–2031.
Enlarge image in a new tab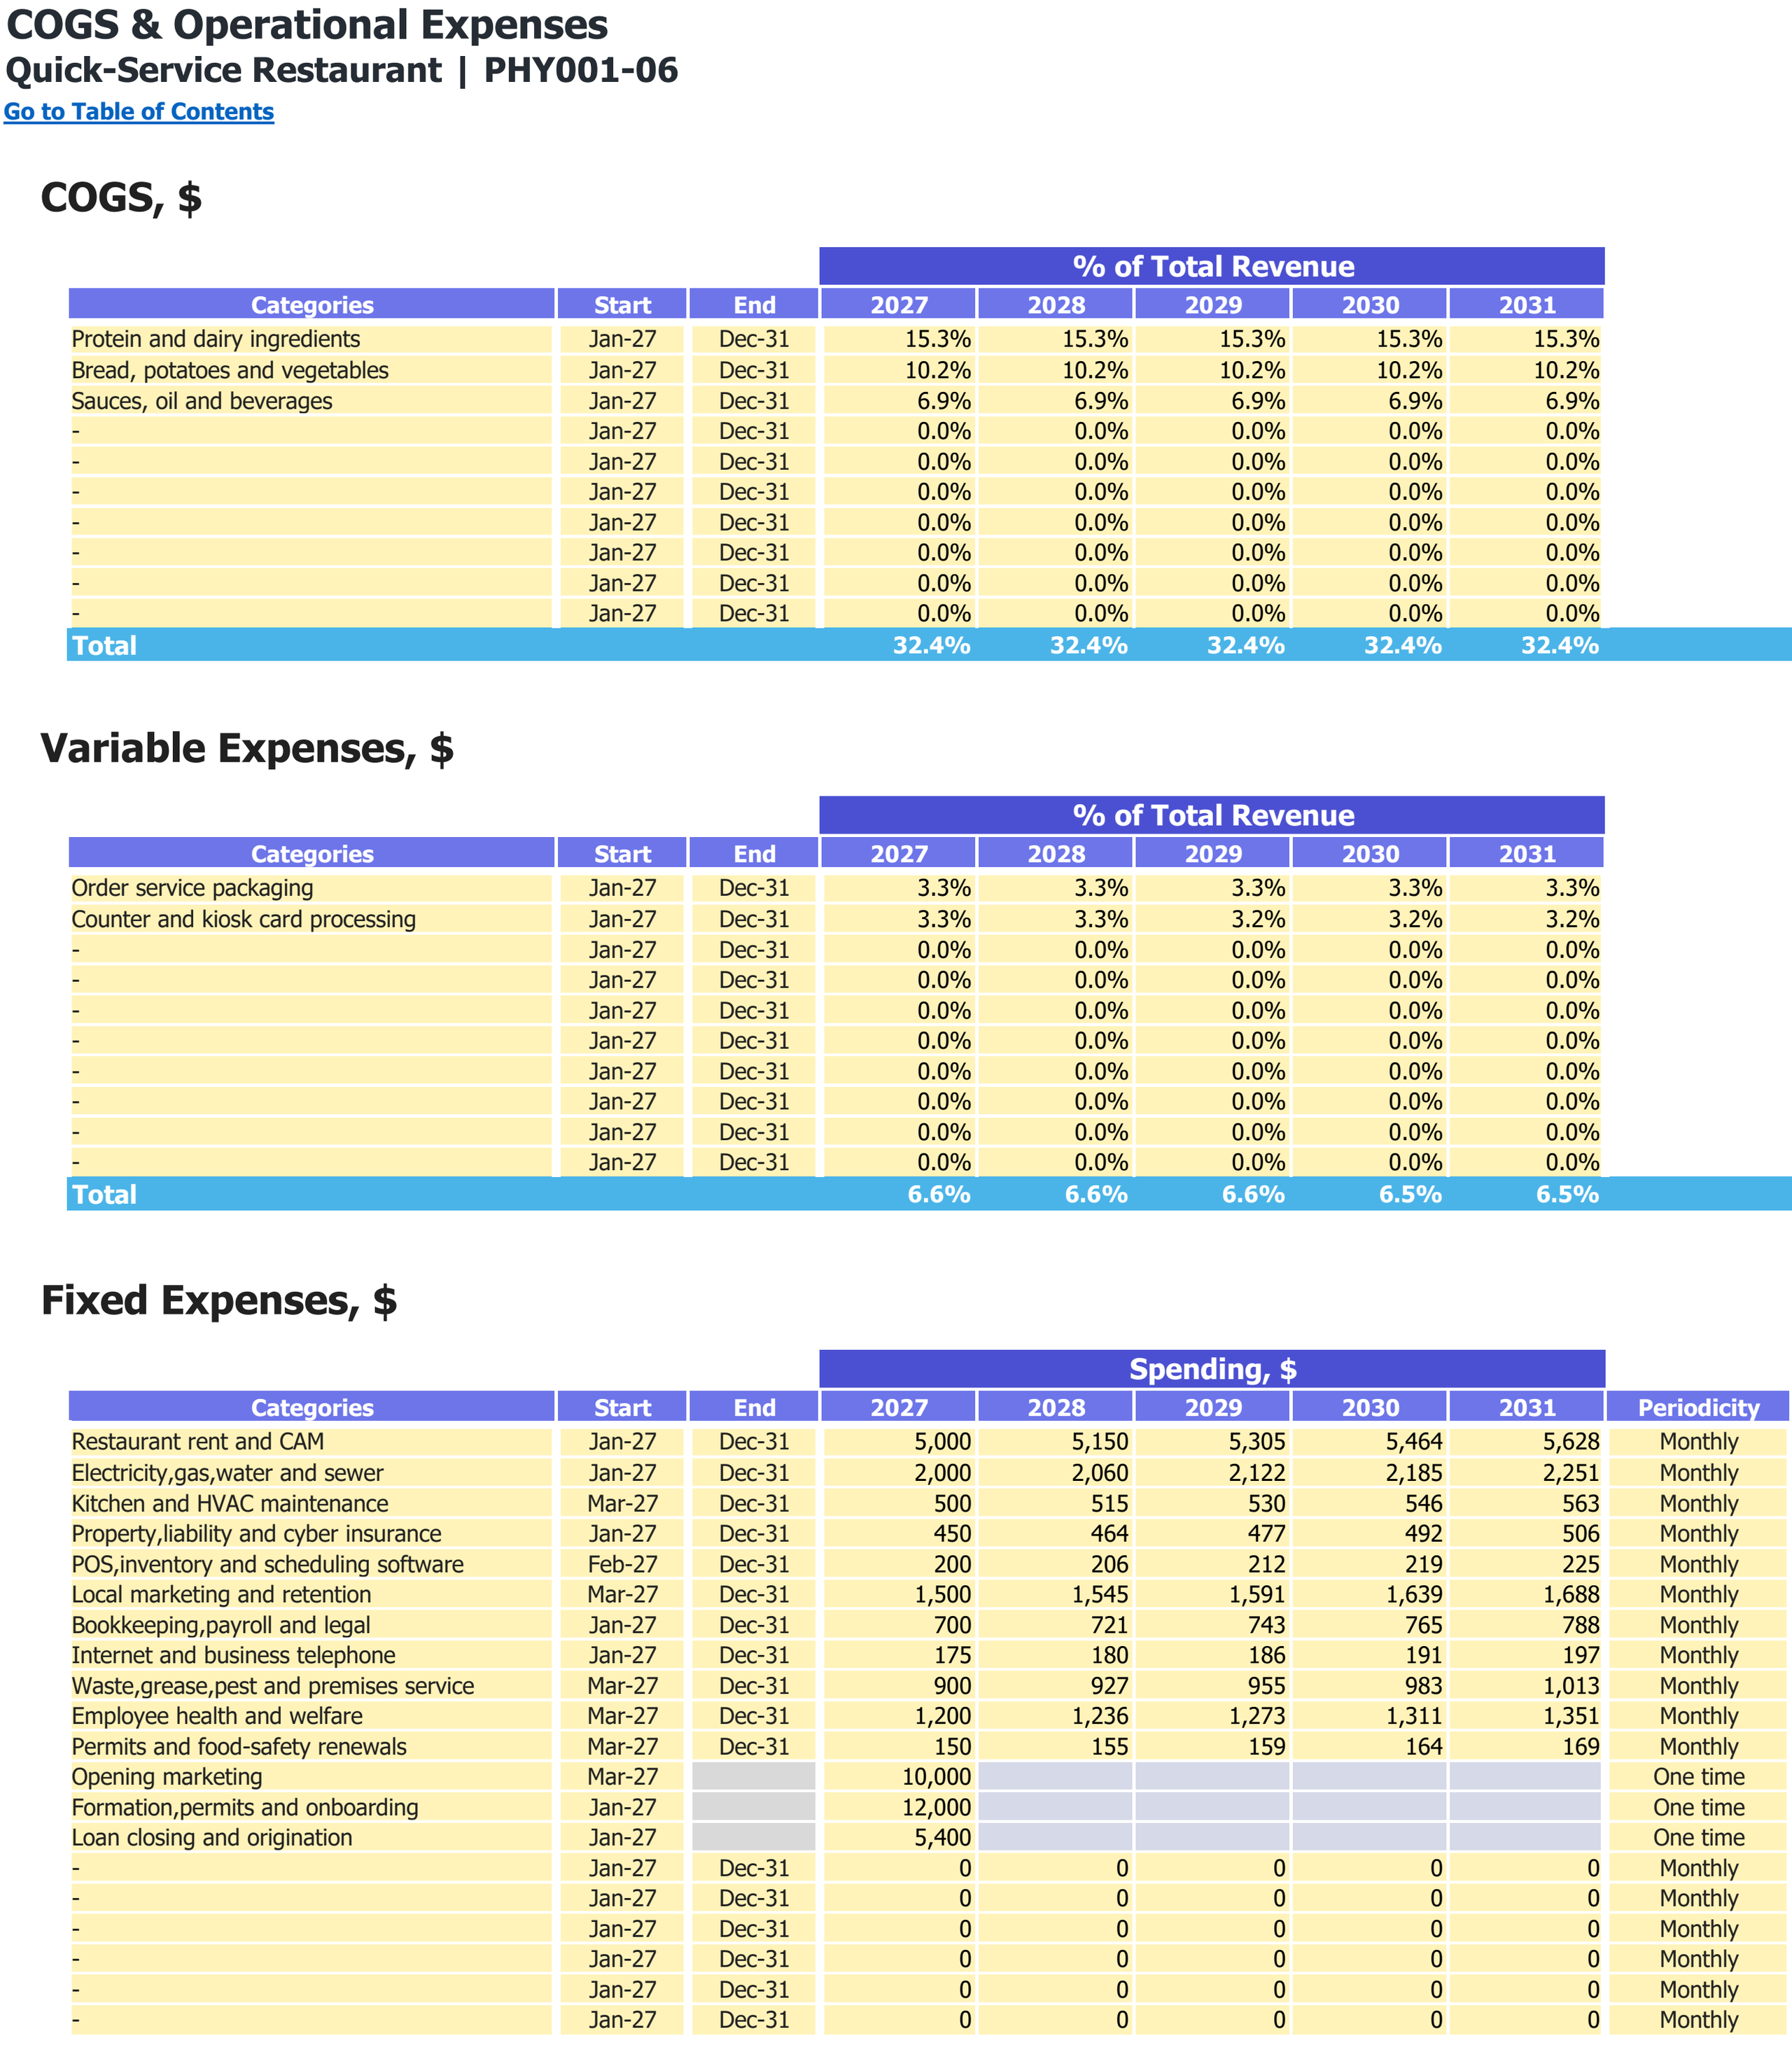
Food and other direct-cost categories, variable expense shares and fixed operating expenses. Monetary inputs are USD; the annual percentage columns are cost shares of revenue.
Enlarge image in a new tab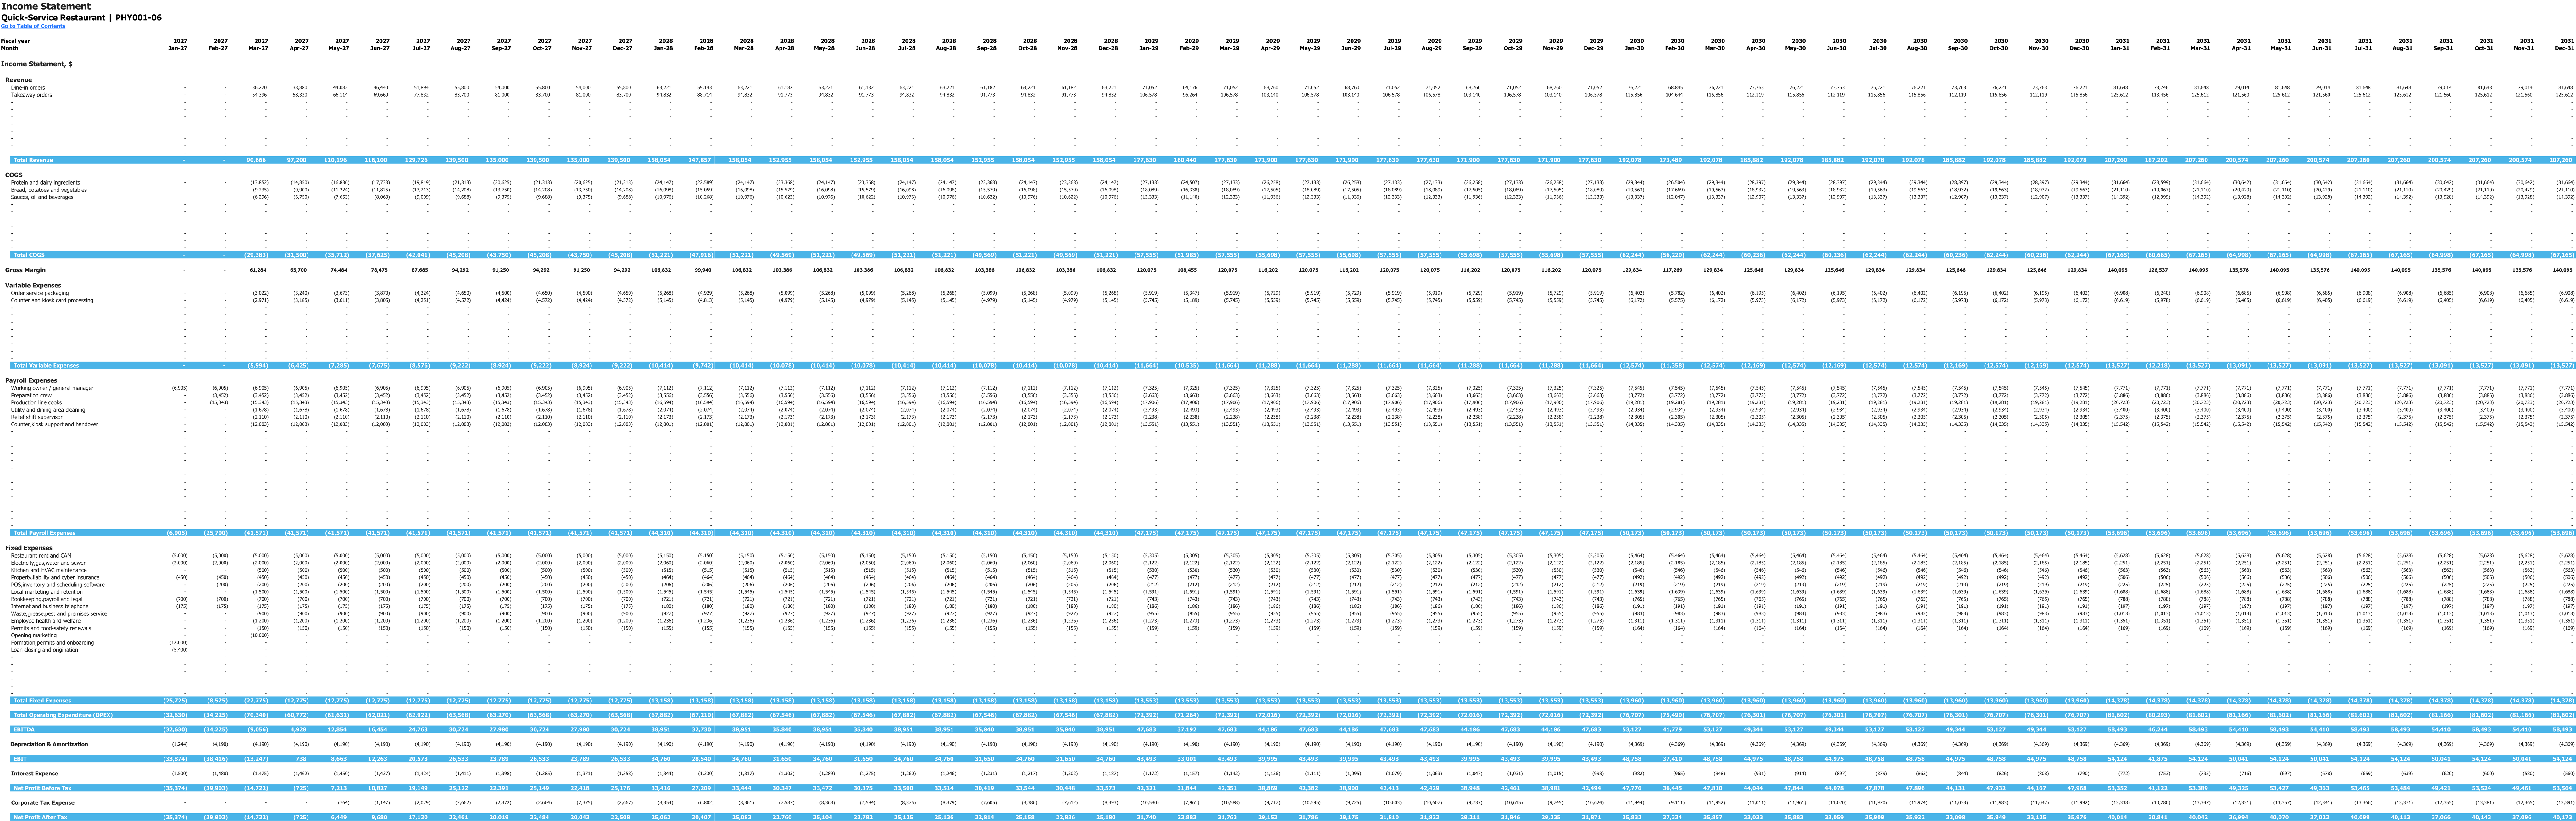
Monthly income statement for 2027–2031, in USD. This is an income statement view; it does not show payroll setup inputs. Enlarge to inspect the wide monthly table.
Enlarge image in a new tab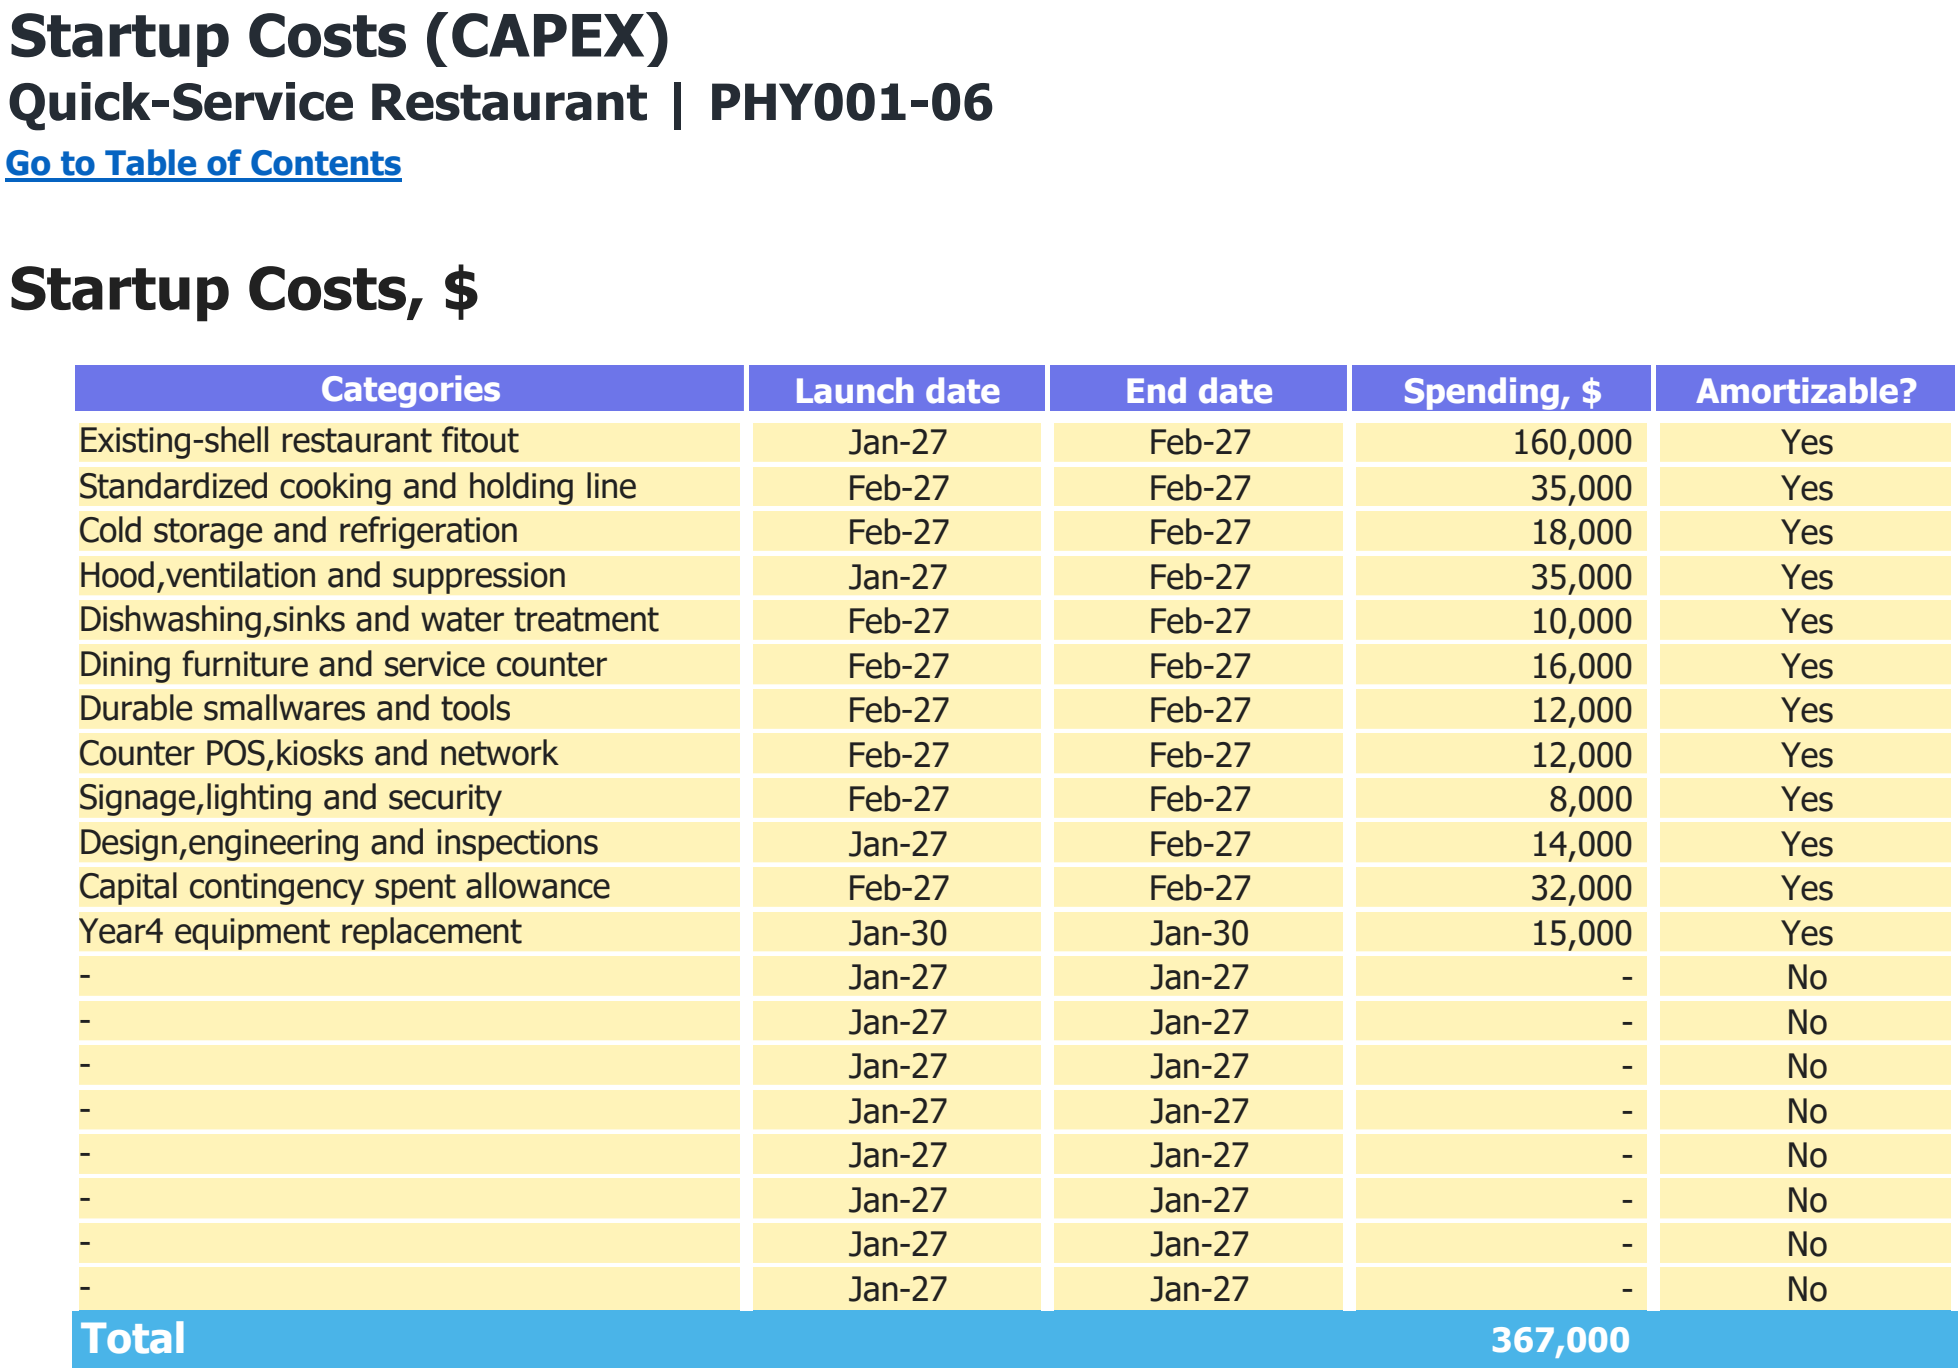
Asset categories, purchase dates and spending assumptions in USD. The total includes every scheduled purchase shown, including later replacements where present.
Enlarge image in a new tab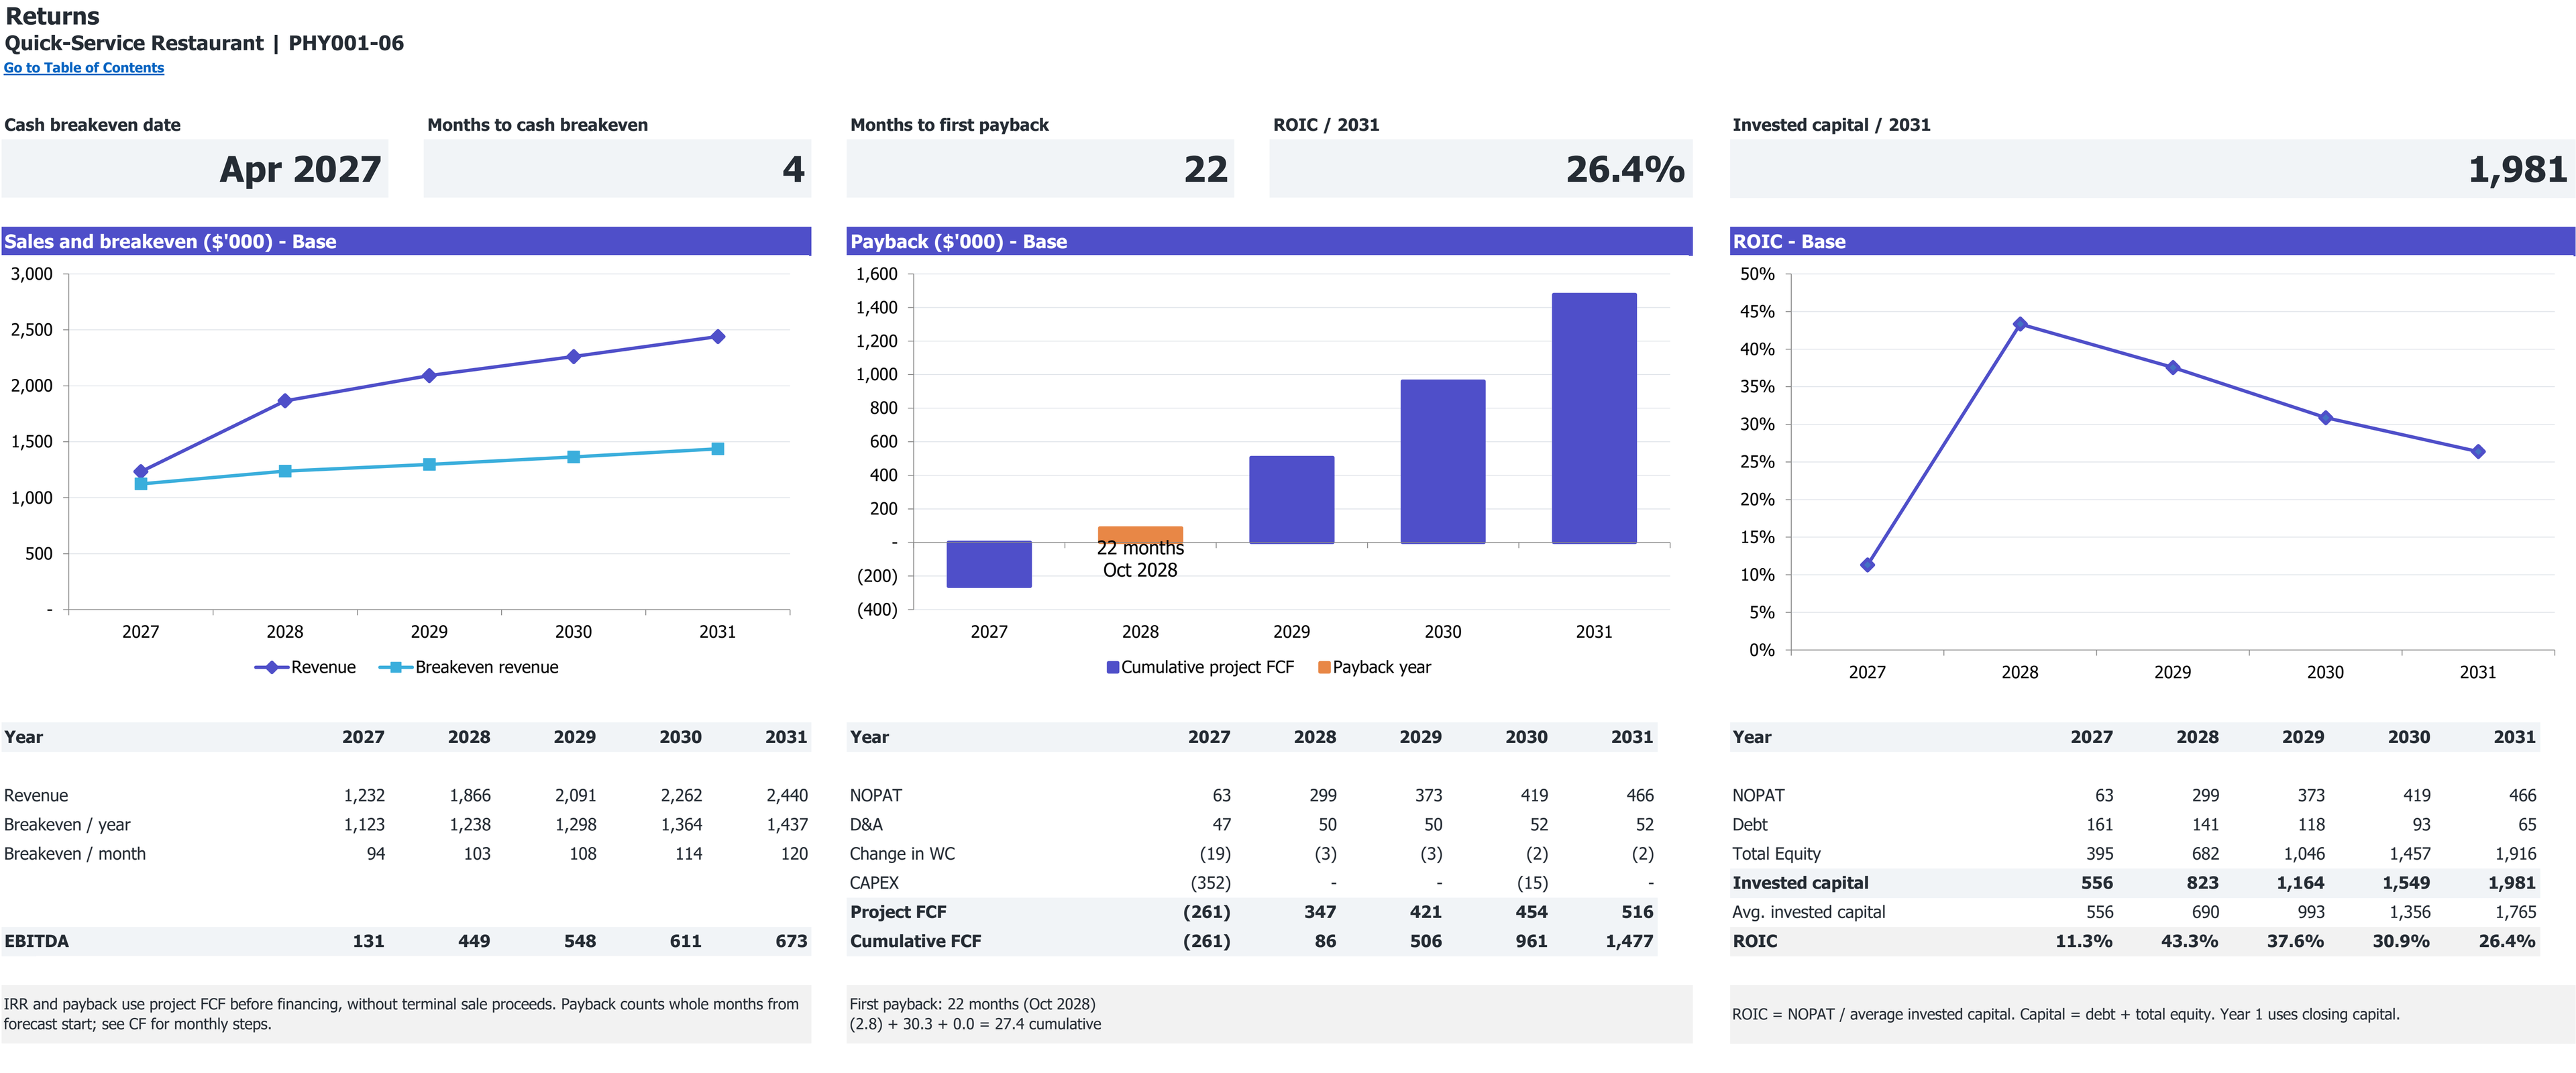
Excerpt from Returns: cumulative project free cash flow and first payback, if reached. 2027–2031 base case; dollar amounts in thousands.
Open full Returns view in a new tabExcerpt from Returns: revenue, annual and monthly break-even revenue, and EBITDA. 2027–2031 base case; dollar amounts in thousands.
Open full Returns view in a new tab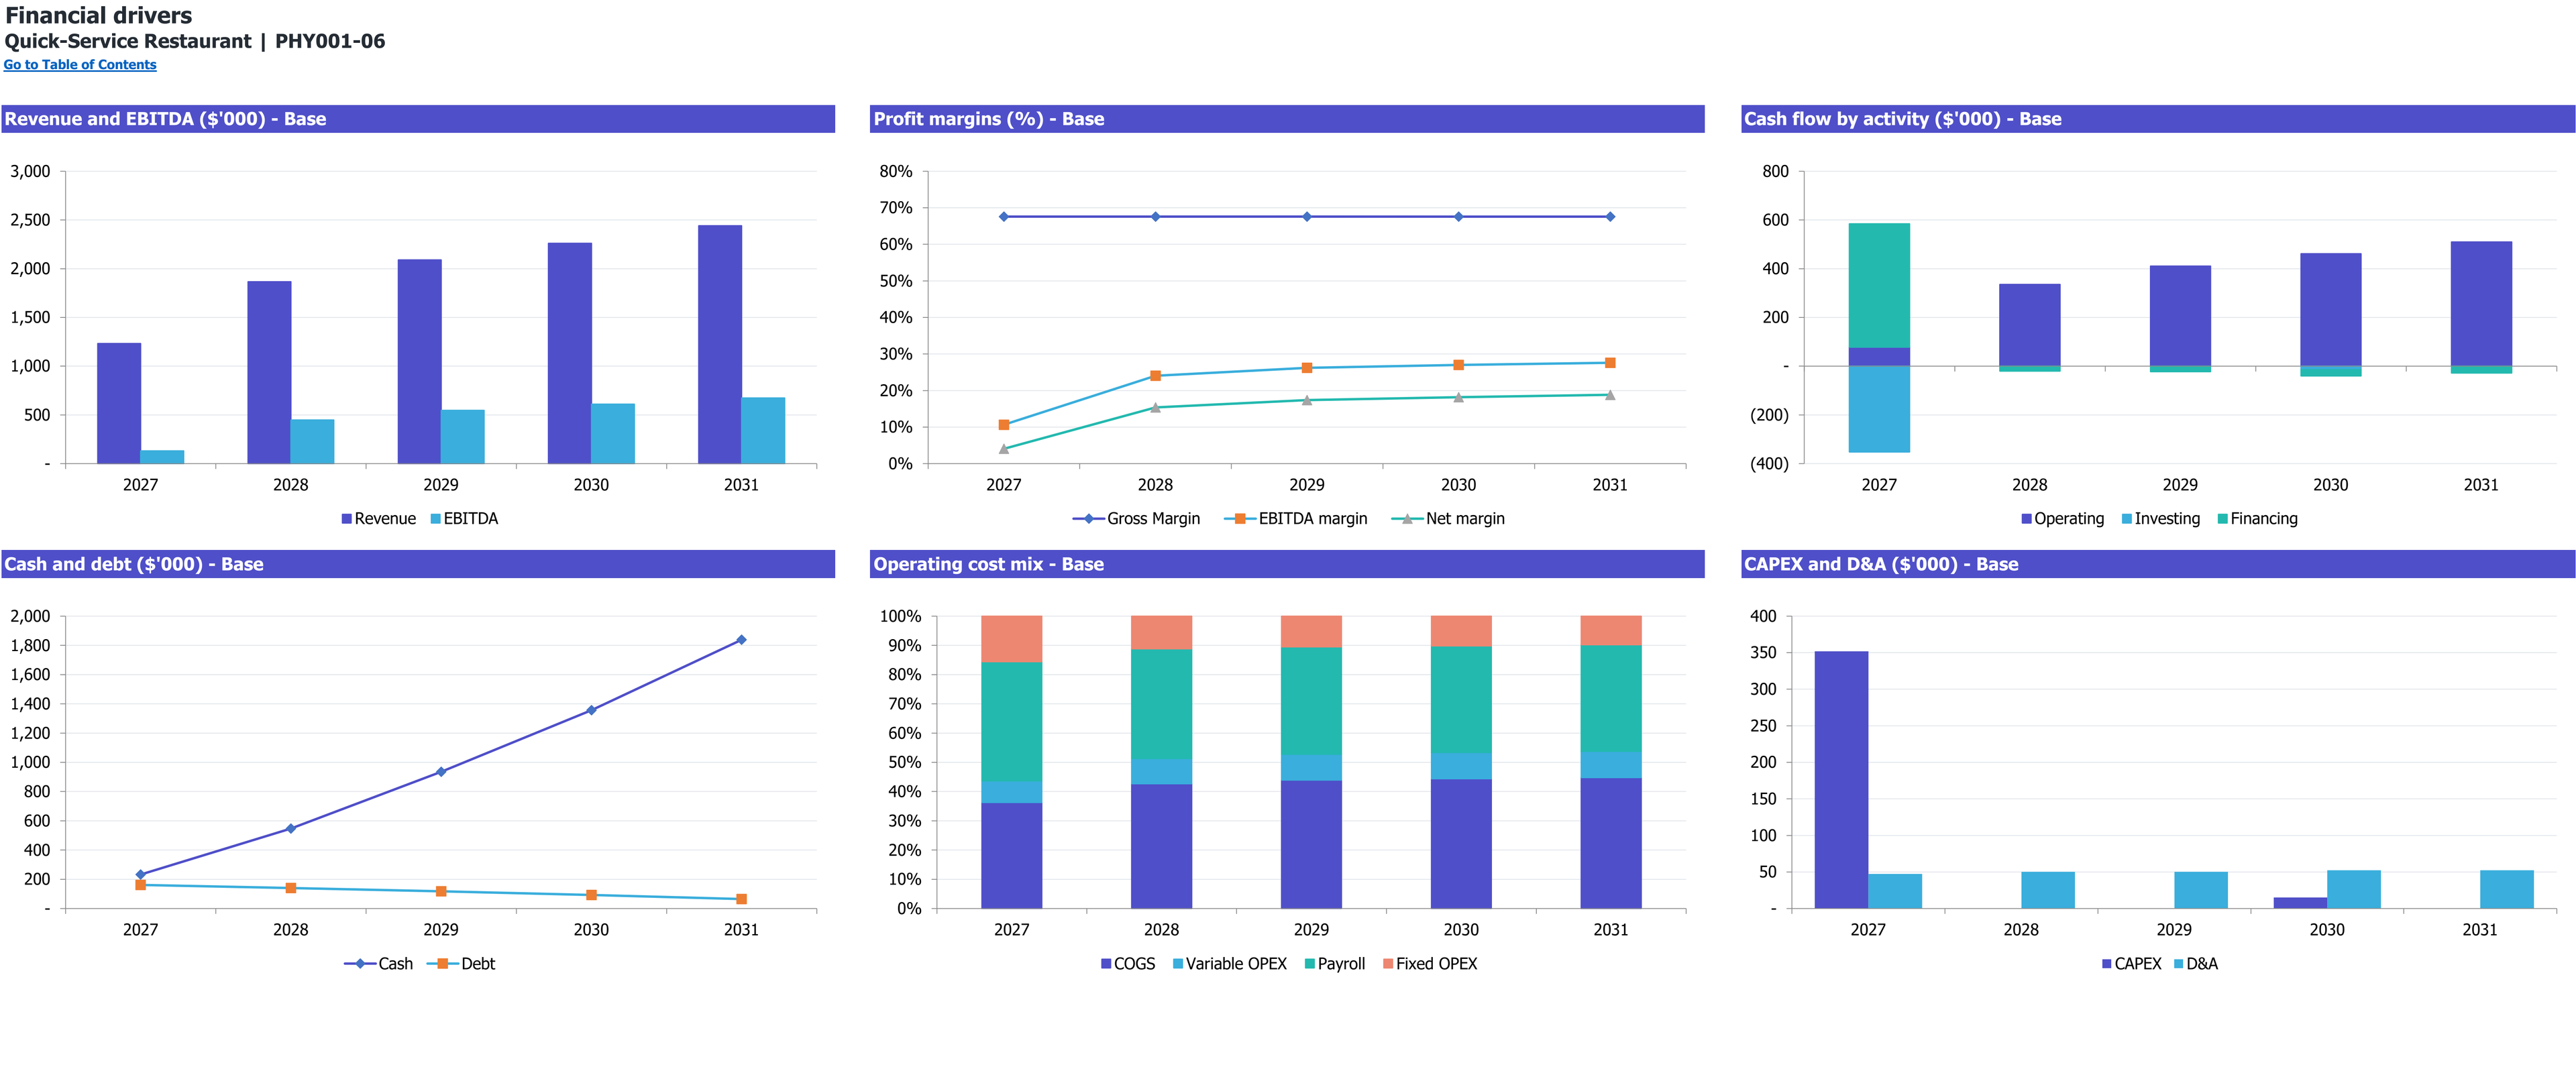
Six annual financial-driver charts for Quick-Service Restaurant, 2027–2031 (Base scenario). Dollar amounts are in thousands; margins and cost mix are percentages.
Enlarge image in a new tab8 selected worksheet views. Figures show this workbook’s starting case.
Workbook overview
What is inside the Excel model
Plan dine-in and takeaway orders against shared cooking, ordering and paid handover capacity. Connect the meal basket, funded staff and opening investment to five years of monthly cash flow.
Selected worksheets from the documented workbook. Forecast period: January 2027–December 2031. Model reference: PHY001-06.
Inputs you control. Results you can inspect.
On a small screen, scroll within the table to read every column.
| Planning area | Inputs you review | How they connect | Results to inspect |
|---|---|---|---|
| Demand and launch | 100 dine-in and 150 takeaway requests per mature open day; 65% opening demand. | Actual calendar days and a six-month ramp generate channel requests. | Requested orders before capacity limits. |
| Physical capacity | 10 service hours; 90 meal units/hour; two ordering endpoints. | Seat eligibility, kitchen output, ordering and paid handover limit fulfillment. | Whole fulfilled orders by channel. |
| Basket and recipe | 1.5 meal equivalents/order; $18 net order value; 90% ingredient yield. | Meal volume drives ingredient purchases; fulfilled orders earn sales once. | Revenue and food costs. |
| Paid resources | 10.5 initial FTE; 75% productive cook and handover time. | Active roles and start dates create separate resource budgets and payroll. | Funded capacity and labor expense. |
| Opening investment | $352,000 initial CAPEX; $15,000 replacement in January 2030. | Timed capital spending feeds cash flow and book depreciation. | Investment schedule and asset balances. |
| Liquidity | $345,000 equity; $180,000 debt; $75,000 reserve objective. | Operating cash, working capital, CAPEX and loan service determine monthly liquidity. | Minimum cash and financing exposure. |
Is this the right model for your business?
Check the starting case before changing the assumptions.
The starting operation
- An independent inline restaurant with standardized meals, counter or kiosk ordering and rapid handover.
- A team evaluating the same kitchen's ability to serve dine-in and takeaway demand without counting its capacity twice.
- An owner budgeting paid management, a production crew and opening cash before a March 2027 launch.
Check the boundary
The saved case does not include a drive-through, delivery, table service, franchise fees or alcohol sales.
Compare the other restaurant typesHow this business makes money
Connect the unit sold to the resources required by this operating case.
Revenue logic
Fulfilled dine-in and takeaway orders multiplied by their net basket values.
Meal equivalents drive ingredients; guests drive the dine-in seating limit.
What limits a counter-service restaurant after demand is established?
Dine-in seating is only the first gate. In this quick-service design, both channels compete for the same kitchen, ordering and paid handover resources. Extra takeaway demand cannot create additional production minutes. The useful comparison is fulfilled orders per funded resource, with meals per order kept separate from guests and payment transactions.
- Ordering
- Two endpoints / 1.5 minutes per transaction
- Kitchen
- 90 installed meal units per hour, also capped by productive cooks
- Handover
- Separate paid counter crew / 1.5 minutes per order
What to establish for your own operation
- Measure peak ordering and handover time rather than assuming the daily average will hold.
- Confirm meal quantities and recipe yield before changing the average order price.
- Test takeaway independently of seats, then reduce the shared cooking and counter budgets.
Follow the plan from demand to cash
Open each section for the assumptions, calculations, and limits of this workbook’s starting case.
Follow orders through shared production and handoverRevenue
The starting $18 order contains 1.5 complete-meal equivalents at $12 each. Dine-in and takeaway have the same initial basket, but remain separate order streams. Dine-in alone uses the 32-seat gate, with a 30-minute visit and 1.5 guests per order. Rejected seated demand does not automatically become takeaway demand.
Eligible demand then shares equipment, productive cooks, ordering endpoints and paid handover minutes. A common fulfillment fraction applies to both channels before whole-order rounding. Four production-cook FTE initially support the kitchen; prep and management do not create a second production allowance. Selected throughput is an operating assumption that needs a time study.
- March demand starts at 65% and reaches 100% in the sixth active month.
- Ordering and handover each require 1.5 minutes per transaction; they are separate constraints.
- Zero seats can leave takeaway operating. Zero kitchen or ordering capacity stops both channels.
Connect meal costs with the people who produce themPayroll
The initial recipe costs ($1.65 protein/dairy + $1.10 bread/sides + $0.75 sauces/drinks) divided by 90% usable yield: approximately $3.88889 per meal equivalent, or $5.83333 per order. Yield loss is included once. Packaging is a separate $0.60 per fulfilled order, including the blended dine-in supplies allowance.
Paid staffing starts at 10.5 FTE and reaches 12.2 in 2031. The working owner receives $74,880 annually from January; prep and cooks begin in February. Employer load is 10.65%, with a separate $1,200 monthly welfare budget. Rent/CAM starts at $5,000 per month for the selected footprint. These amounts are planning budgets, not hiring or lease quotations.
- Salary and recurring expense assumptions grow 3% annually.
- Card costs use 90% card share, 2.6% of gross tender and $0.15 per paid order.
- Annual cost shares preserve the existing expense schedules; changing within-year channel economics can approximate monthly unit costs.
Separate the opening asset budget from cash fundingCAPEX
Initial capital is $352,000: $320,000 of base assets plus $32,000 of contingency modeled as spent. The reused-shell fitout is $160,000, with cooking, refrigeration, ventilation, dining fixtures, ordering equipment and other assets separately funded. A $15,000 replacement follows in January 2030. Installed costs require actual bids.
January financing totals $525,000. The $180,000 loan uses assumed 10% fixed interest and 84 monthly annuity payments without grace; its $5,400 fee is an expense. The cash trough without equity, including the loan and its service, is −$269,360. Adding the $75,000 reserve and rounding equity upward to $1,000 produces the $345,000 contribution.
- The reserve remains cash and is not another opening expense.
- Receivables are two revenue days, food inventory seven food-cost days and payables zero.
- Seven-year book depreciation does not represent tax depreciation or equipment resale proceeds.
Read the modeled operating return and cash cushion togetherCF
The Base case produces $1,232,388 of 2027 revenue across 68,466 fulfilled orders. Its $131,219 EBITDA includes the first year's setup period. Revenue totals $9,891,764 across the 60 months, with $2,412,060 EBITDA. Later margins rely on traffic and prices growing faster than the selected labor and overhead budgets.
Monthly EBITDA, EBIT and operating cash first become nonnegative in April 2027 and remain nonnegative. Project payback arrives in October 2028, forecast month 22, when cumulative undiscounted unlevered free cash flow crosses zero. That measure includes startup investment and operating deficits, excludes financing and terminal value, and does not describe an owner distribution.
- Base minimum funded cash is $75,640 in March 2027.
- The Low monetary scenario leaves $28,713 minimum cash with Base financing unchanged.
- Price and cost scenarios do not change physical order counts; test operational demand and staffing separately.
Selected results from the starting case
Modeled results in USD unless stated otherwise. These describe the selected inputs, not an estimate for your location or a guaranteed outcome.
- 2027 revenue
- $1,232,388USD, Base case; ten sales months after a March opening.
- 2027 fulfilled orders
- 68,466Whole dine-in and takeaway orders; not meal portions or diners.
- 60-month EBITDA
- $2,412,060Base cumulative operating result before interest, tax, depreciation and amortization.
- Minimum cash
- $75,640Base funded monthly balance in March 2027.
- Project payback
- October 2028 / month 22First cumulative undiscounted unlevered project FCF crossing; no later reversal.
- Low-case minimum cash
- $28,713Monetary sales/cost stress over 60 months; original financing remains fixed.
Make the case your own
Work from the operating plan toward the cash requirement.
Replace channel demand, opening date and meal basket with the proposed site's evidence.
Match cooking and counter capacity to paid schedules, then test the tightest resource.
Enter installed asset bids, lease costs and loan terms before reviewing minimum cash.
Compare operating break-even, project recovery and downside liquidity as separate decisions.
Interpretation and scope
- This is an analytical US national case, without a chosen city, lease or confirmed customer demand.
- Monthly averages and proportional allocation do not simulate queues, individual shifts or a lost-demand backlog.
- The 25% tax planning rate has no selected jurisdiction and does not carry losses forward.
- Strong later margins are scenario outputs, not an industry expectation; no shareholder distributions are scheduled.
The workbook is an Excel file for local planning. Learn how to interpret assumptions and evidence.
Other restaurant types
Each operating type calls for its own financial structure.
Questions
Does takeaway use dining seats?
No. Its eligible orders bypass seating, then share the kitchen, ordering endpoints and handover staff with dine-in.
Is the $18 value a price per guest?
No. It is the starting net value per order, built from 1.5 meal equivalents at $12 each.
Can another kiosk alone increase sales?
Only if ordering is the binding constraint. Cooking or paid handover may still cap fulfilled orders.
Is owner labor included?
Yes. The working owner/general manager receives $74,880 annual starting pay from January, before the March opening.
Does $352,000 cover all opening cash?
It is initial CAPEX. Total financing is $525,000 and also supports startup expenses, working capital, debt service and retained cash.
Does the Low scenario model fewer physical orders?
No. It applies monetary sales and cost factors. Physical demand and capacity must be tested with their own operating inputs.
Does month-22 payback mean cash is paid to the owner?
No. It is cumulative project free cash flow recovery. The case schedules no shareholder distributions.
What if a purchased file is damaged or cannot be downloaded?
See the refund and replacement policy for file correction, replacement and download assistance. Keep the product name and your order reference when requesting help.
Which software does the workbook use?
The documented file is an Excel workbook (.xlsx). Compatibility with other spreadsheet applications is not established by the file extension.
Read the planning guides
Explore the relevant operating questions and how to interpret a workbook’s assumptions.
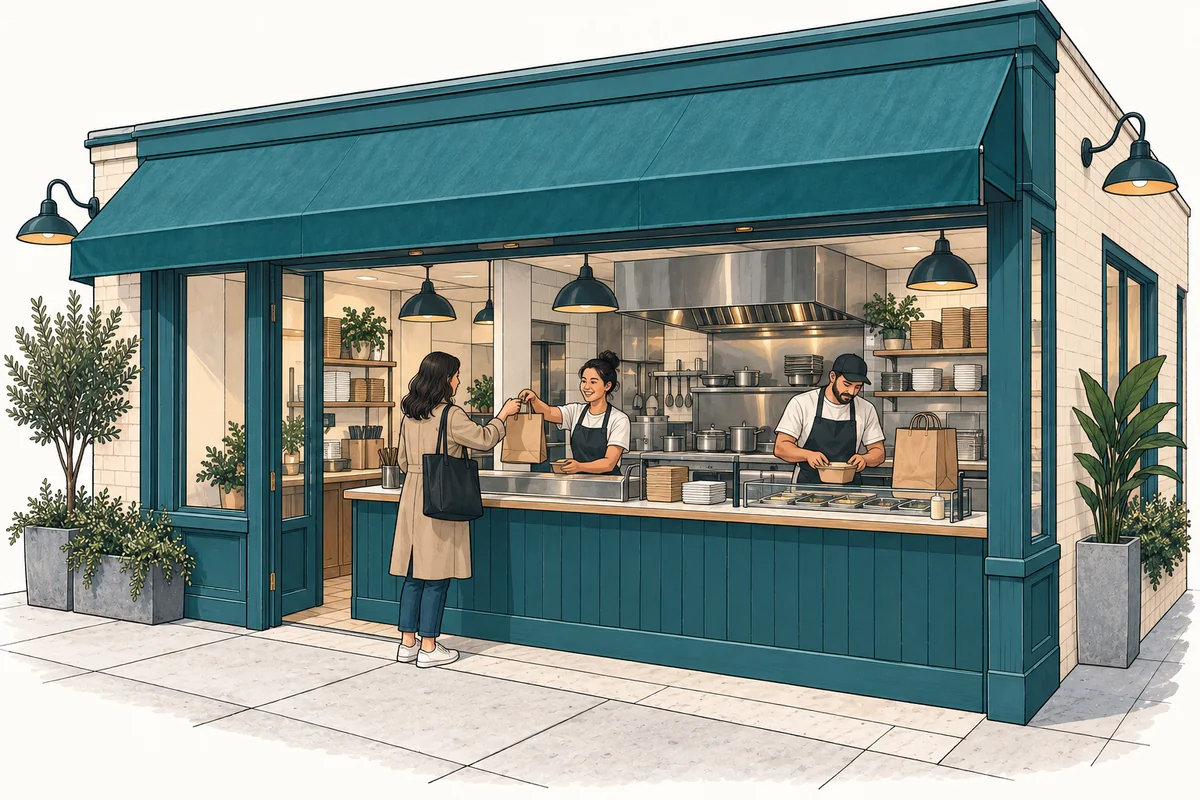
How do dine-in and takeaway orders share quick-service capacity?
Follow quick-service demand through seating, meal preparation, ordering, and paid handover without assigning the same capacity to two channels.
Read the guide
How to read financial assumptions before editing an Excel model
Follow the chain from operating assumptions to calculated results, check units and timing, and keep a useful record of changes to a financial workbook.
Read the guideEvidence and scope
User-selected analytical restaurant configuration. No direct operator source was assigned; formulas and capacity assumptions are specifications rather than verified market facts.
The links below provide operating-format context; they do not verify the workbook’s selected inputs or calculated returns.
The workbook guide and figures describe model PHY001-06, revision r01, for January 2027–December 2031. These are a documented planning case, not observed results for a particular business.