
Restaurant Financial Model: Client-Site Contract Cafeteria
Plan an operator-at-risk cafeteria with employee payments, client meal subsidies, host-provided assets, staffing capacity and cash flow.
- Excel (.xlsx)
- Forecast: 60 months · five calendar years
- Starting format: One client site · subsidized lunches
- Model inputs: English · USD · Base scenario
Planning several types? Compare 17 restaurant formats
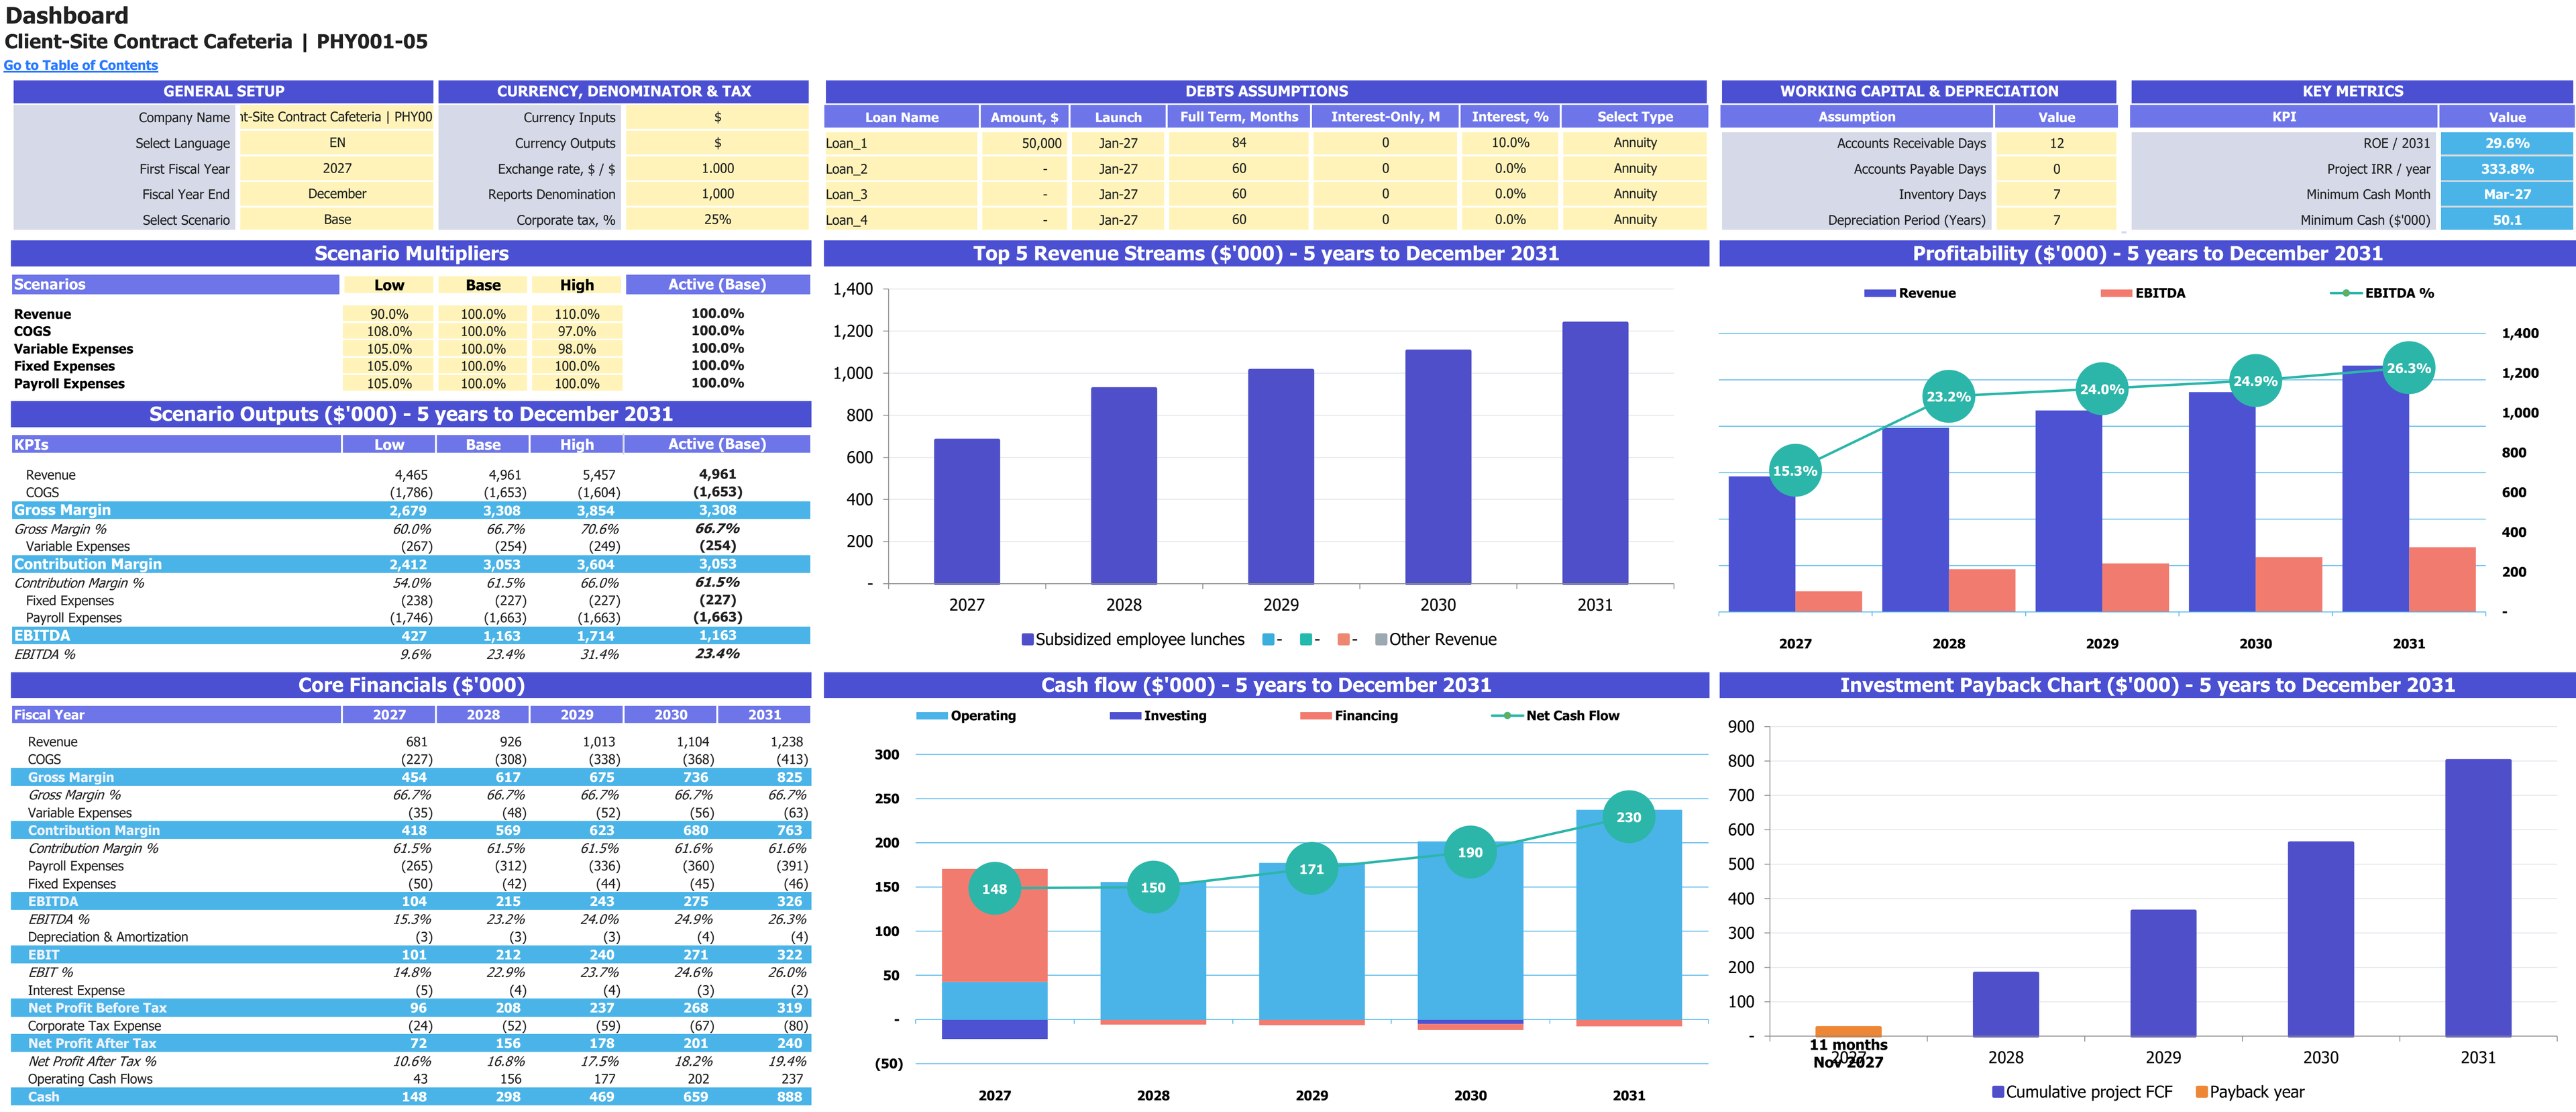
Base-case scenario controls, annual financial results and charts for 2027–2031. Financial report amounts are shown in thousands of USD; percentage measures retain their own units.
Enlarge image in a new tab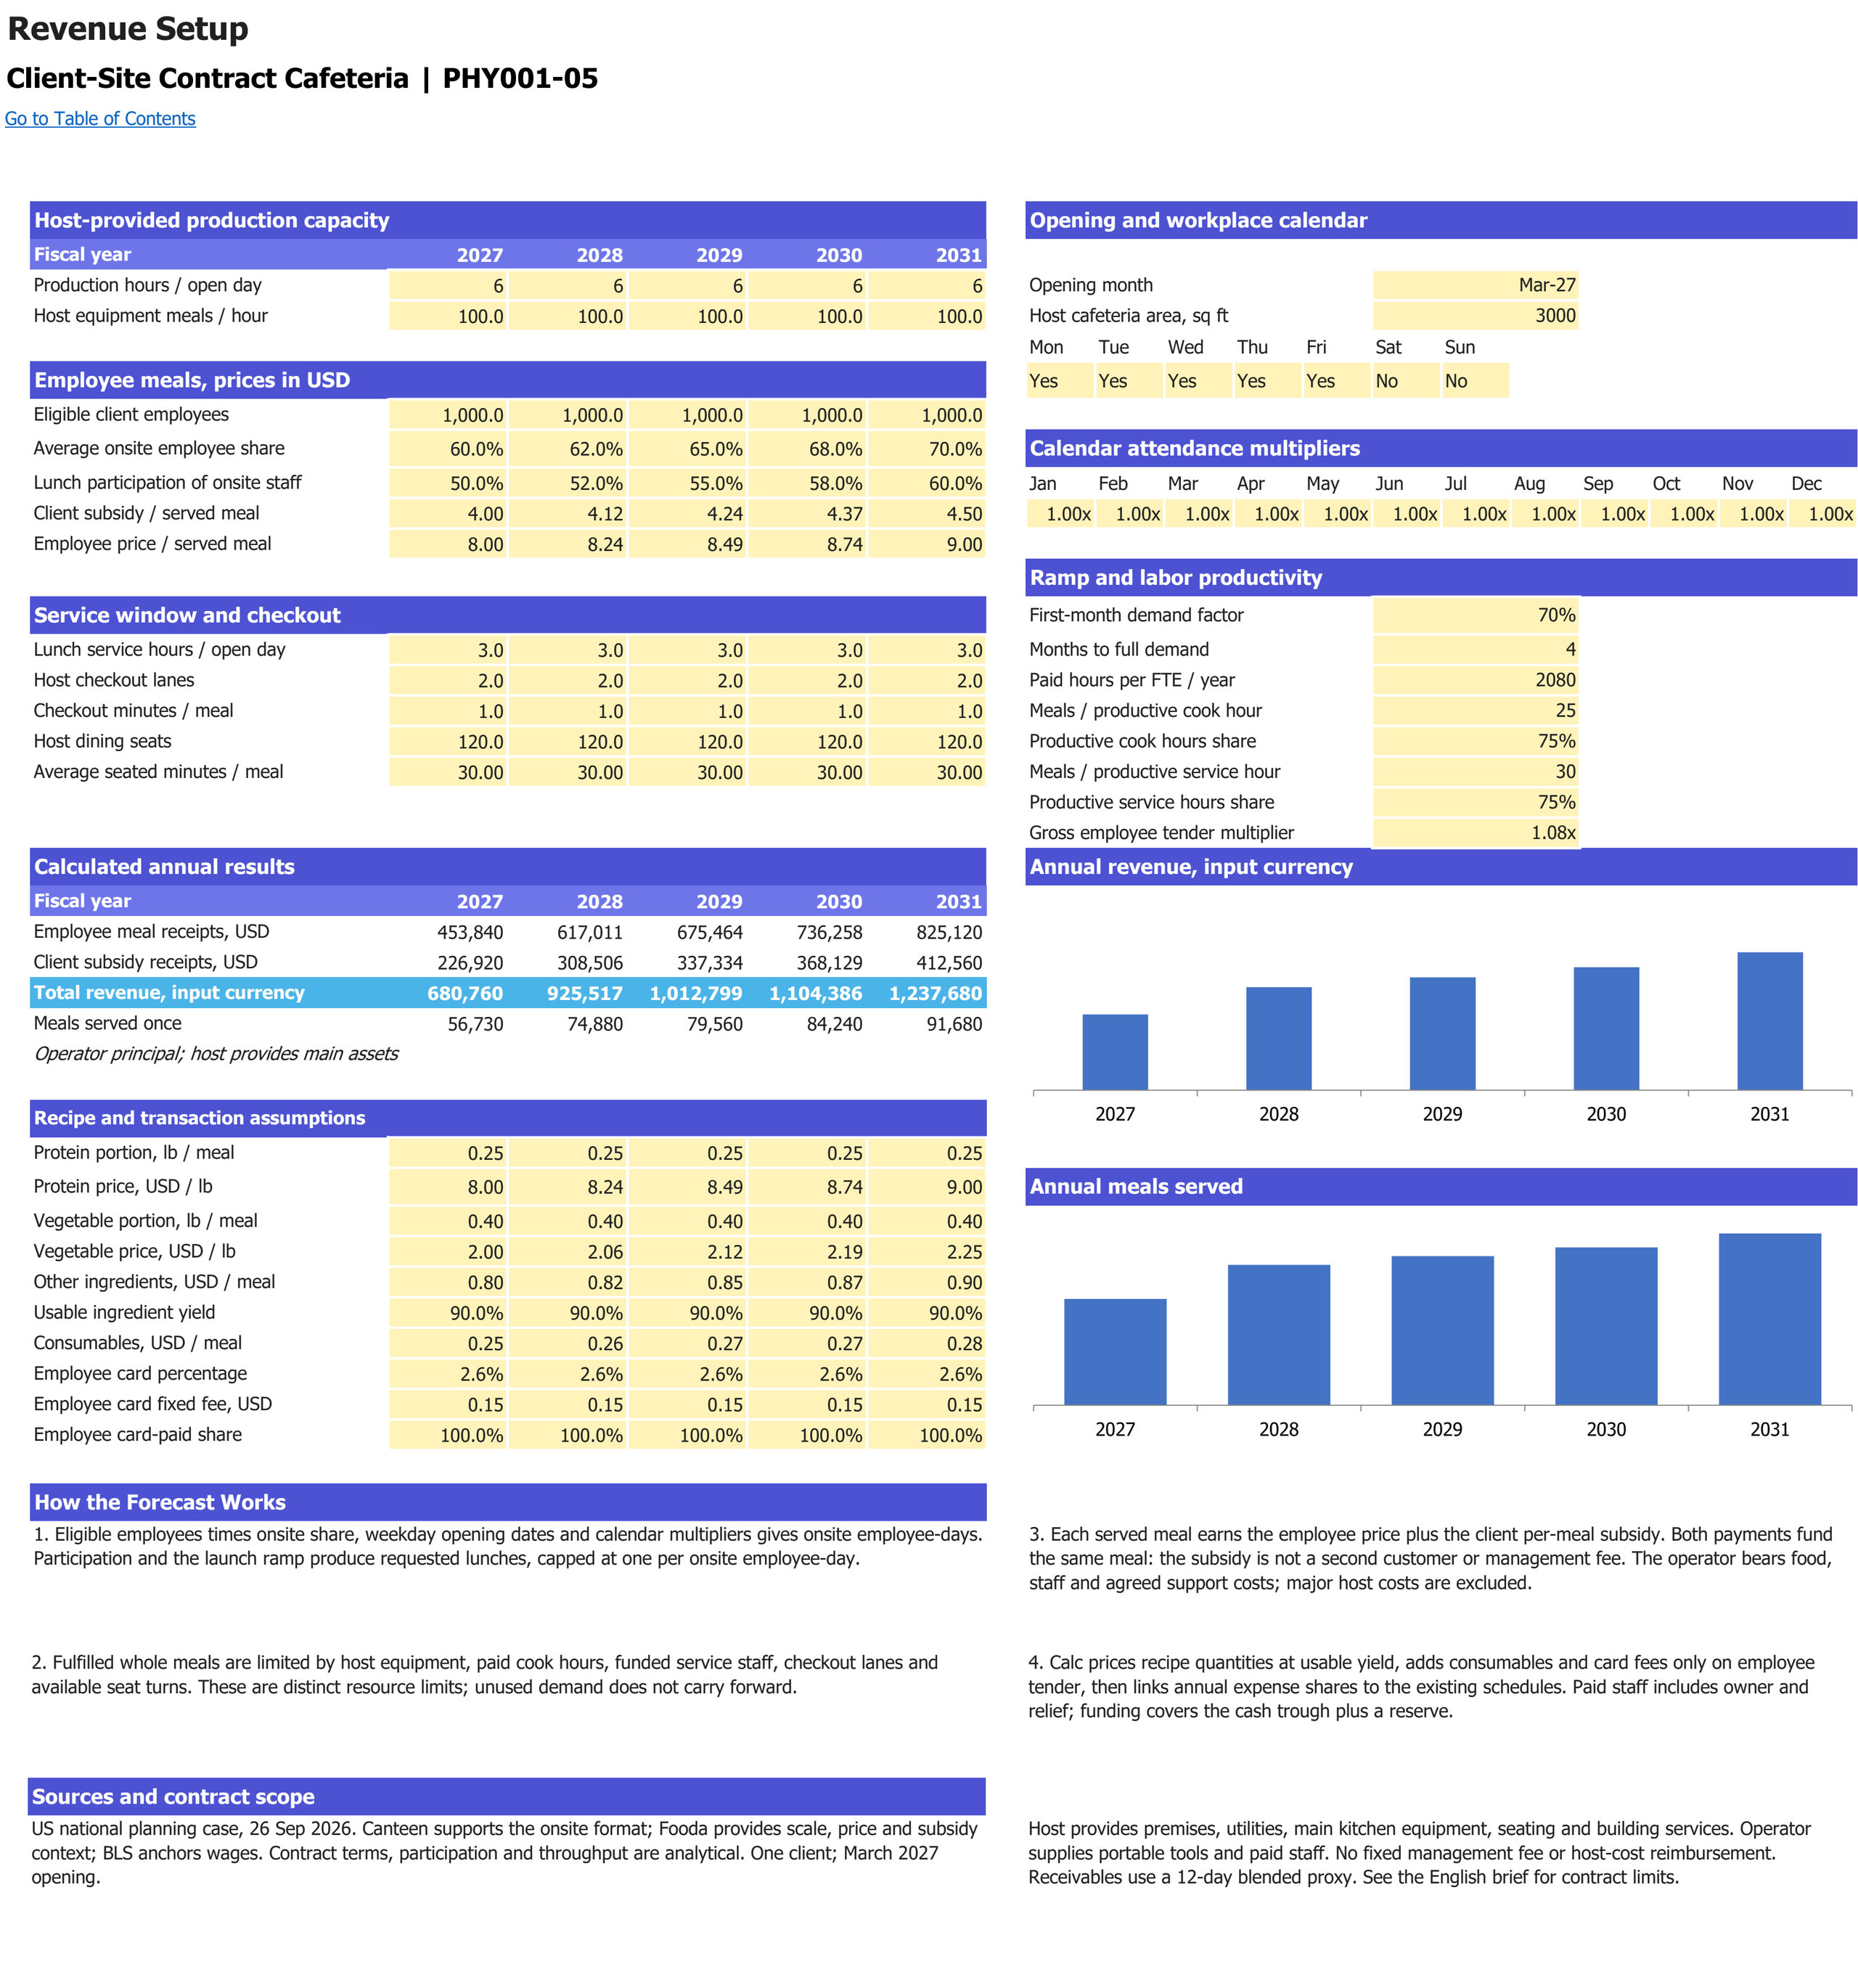
Employee attendance, meal participation, client subsidy and cafeteria service constraints. Monetary inputs and sales use USD; operating volumes retain their labelled units. Forecast years are 2027–2031.
Enlarge image in a new tab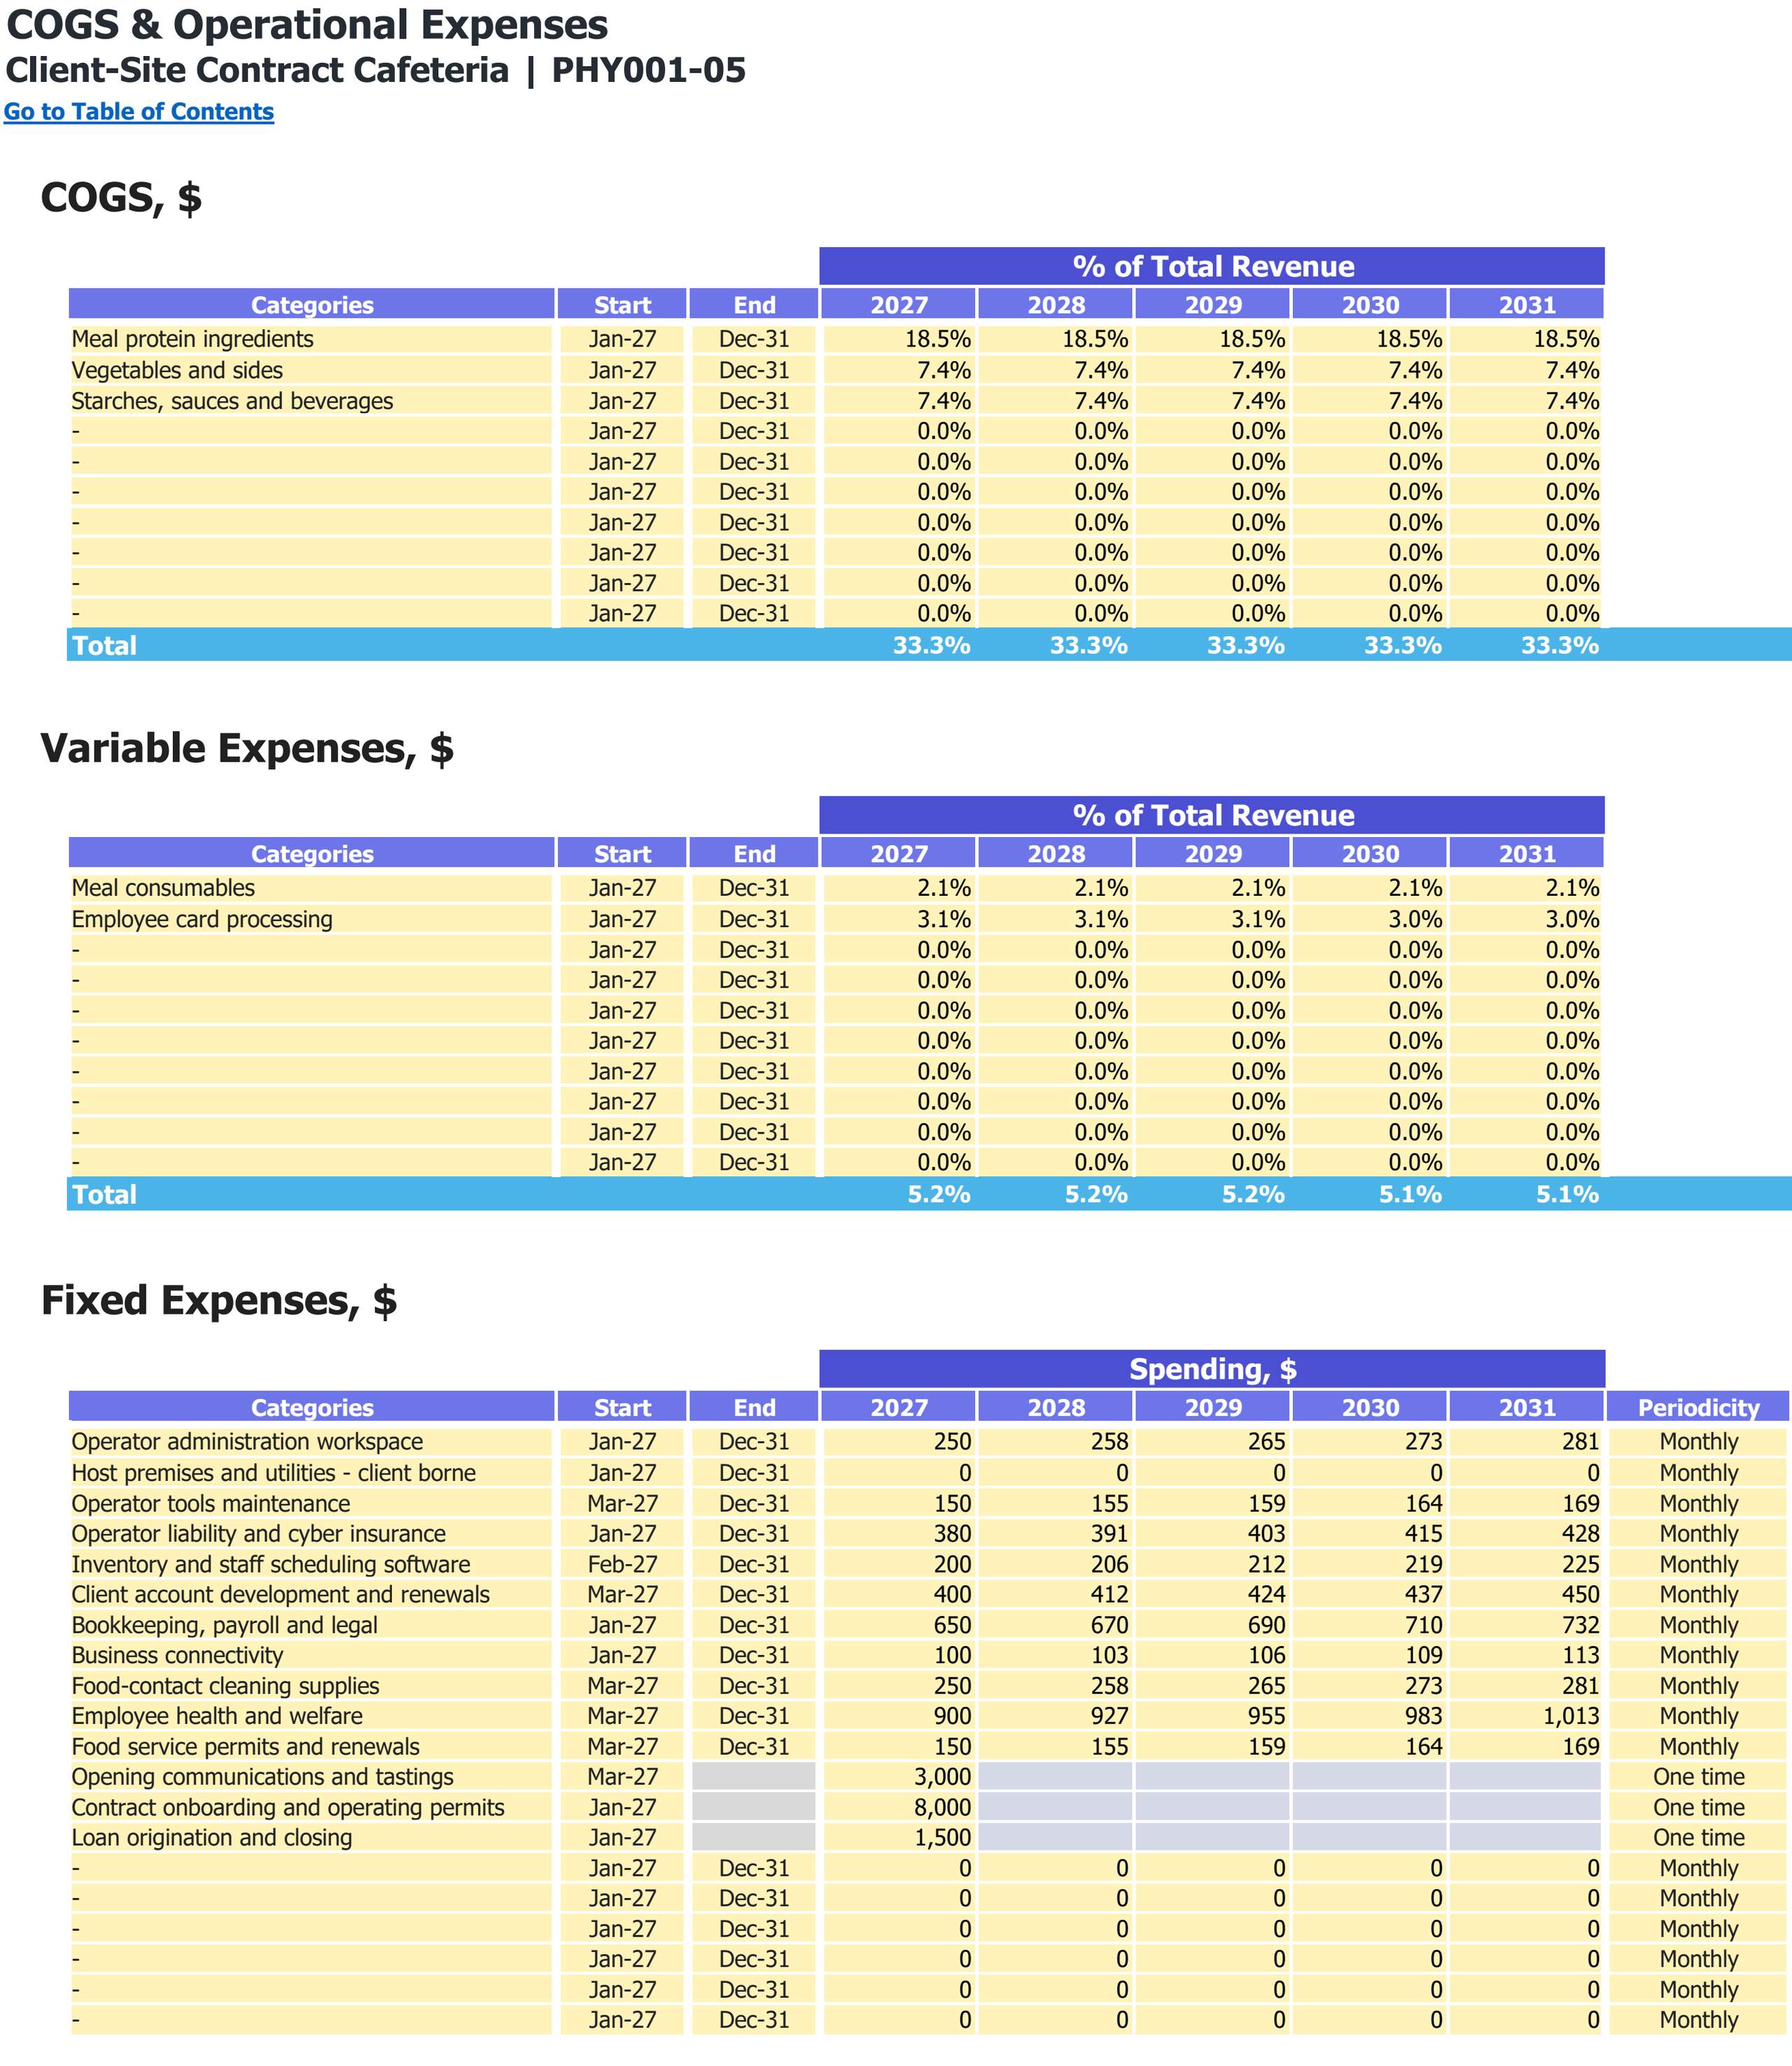
Food and other direct-cost categories, variable expense shares and fixed operating expenses. Monetary inputs are USD; the annual percentage columns are cost shares of revenue.
Enlarge image in a new tab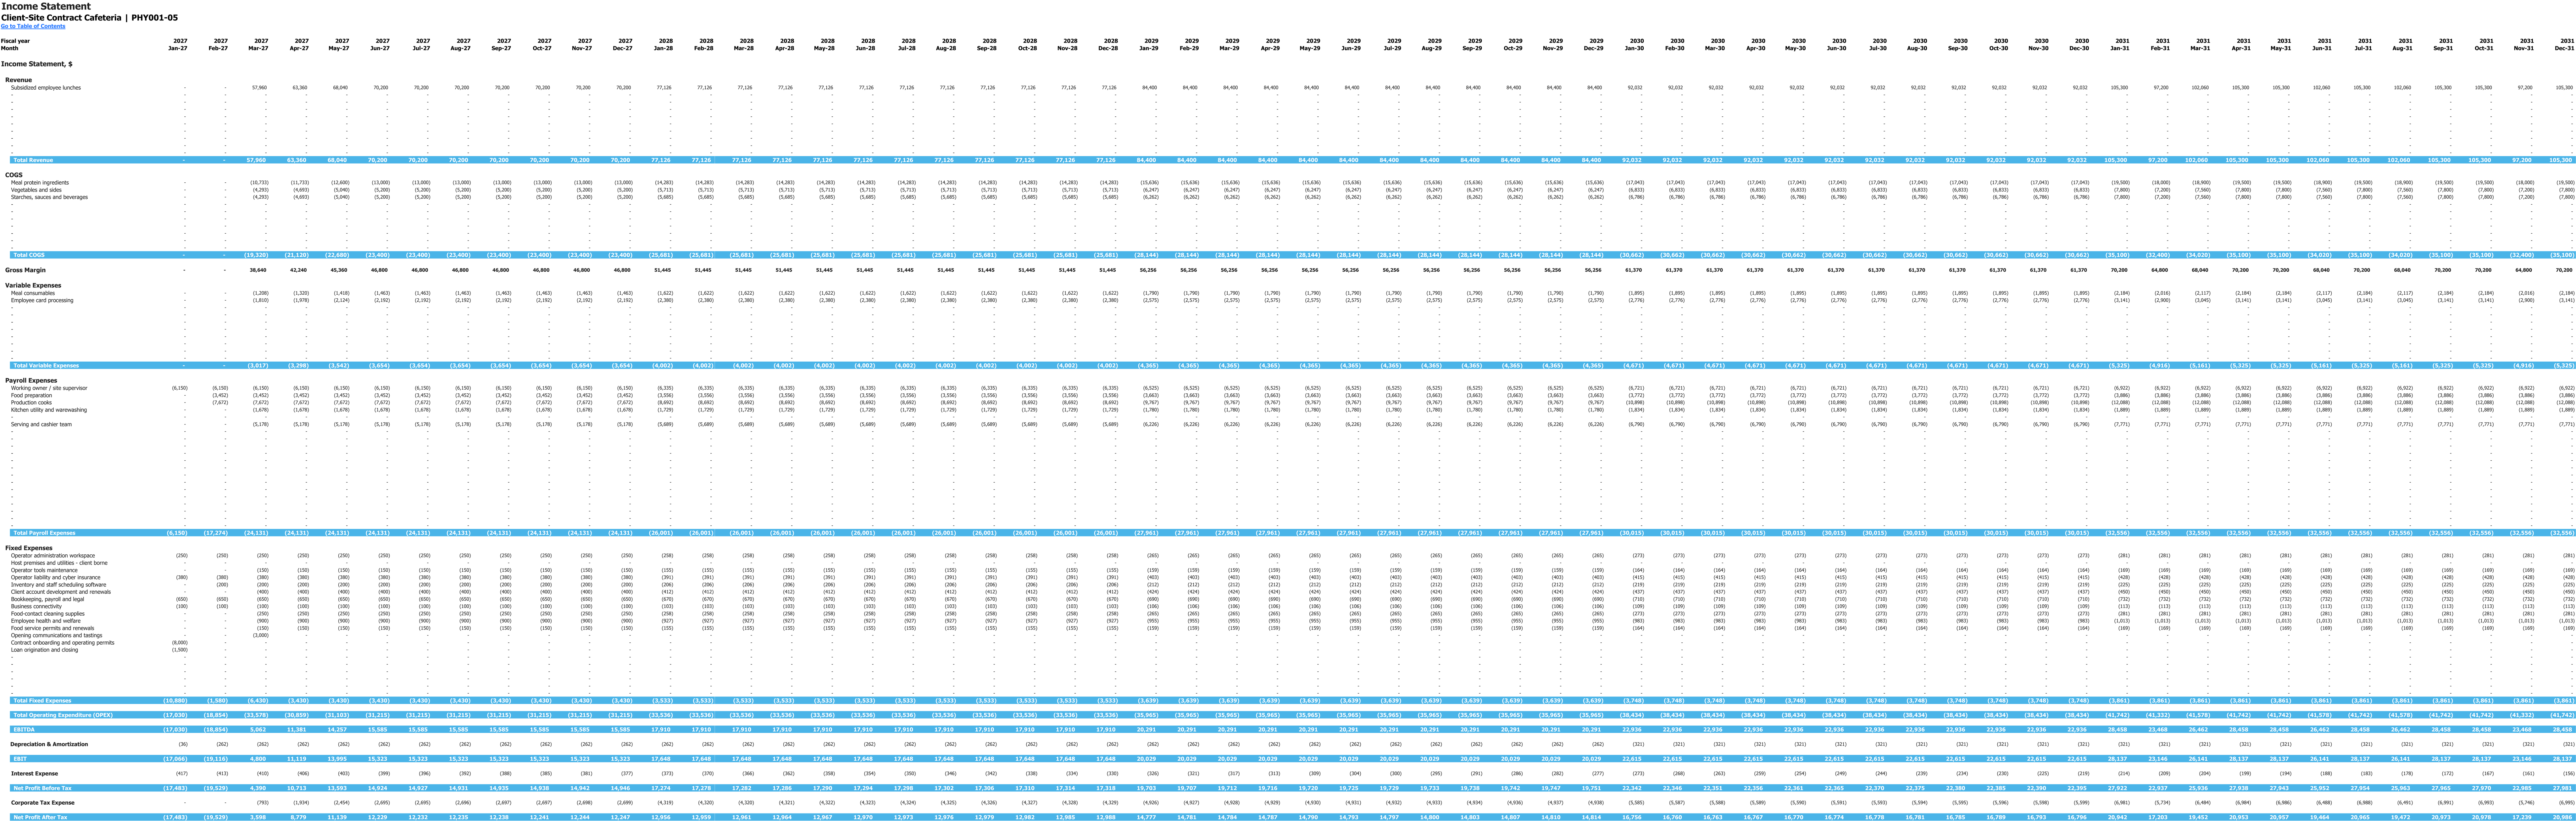
Monthly income statement for 2027–2031, in USD. This is an income statement view; it does not show payroll setup inputs. Enlarge to inspect the wide monthly table.
Enlarge image in a new tab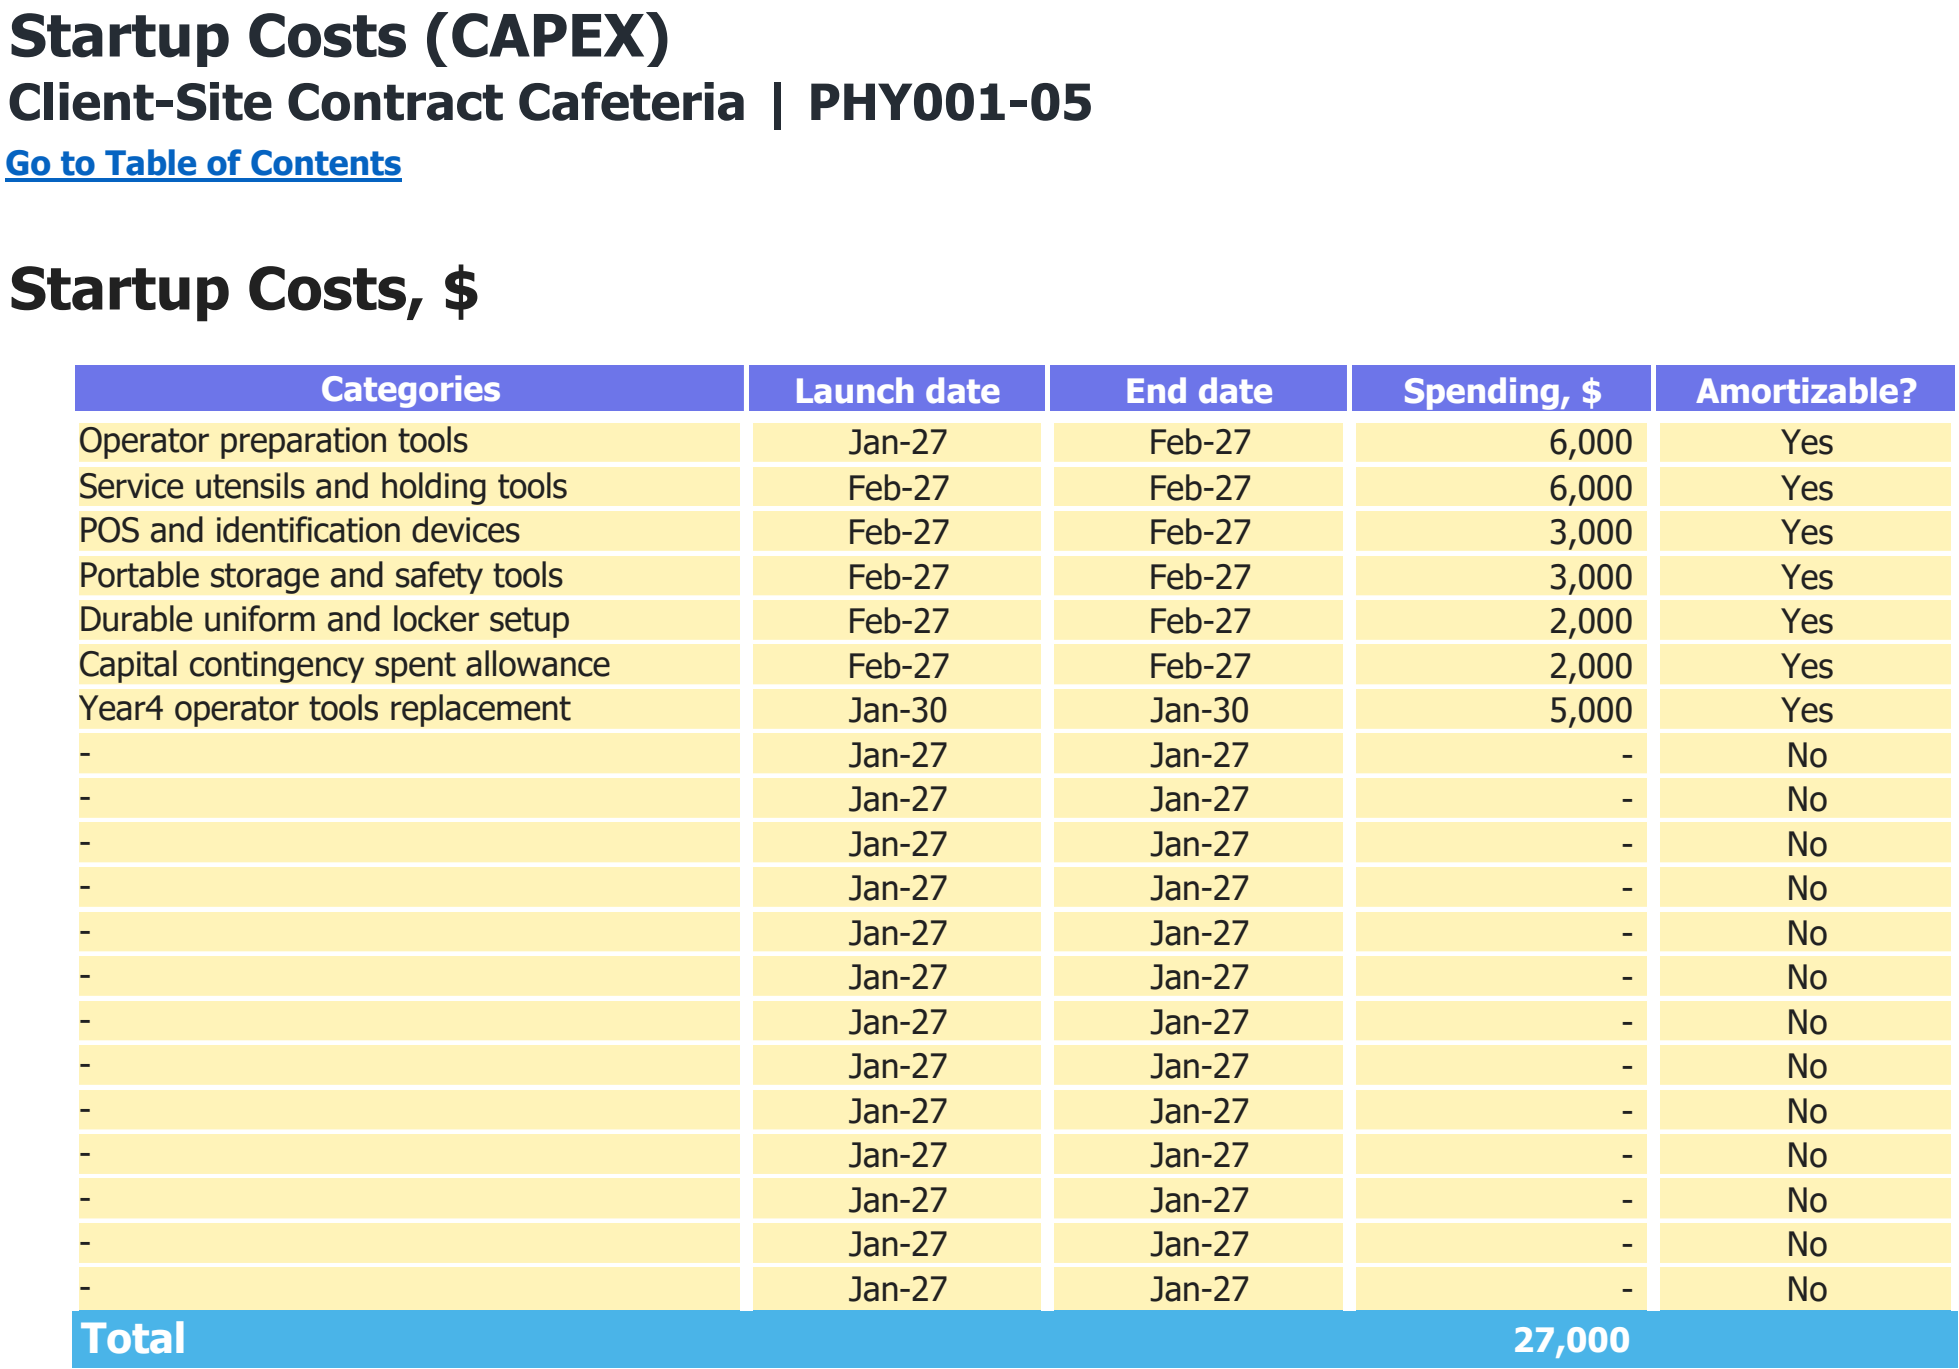
Asset categories, purchase dates and spending assumptions in USD. The total includes every scheduled purchase shown, including later replacements where present.
Enlarge image in a new tab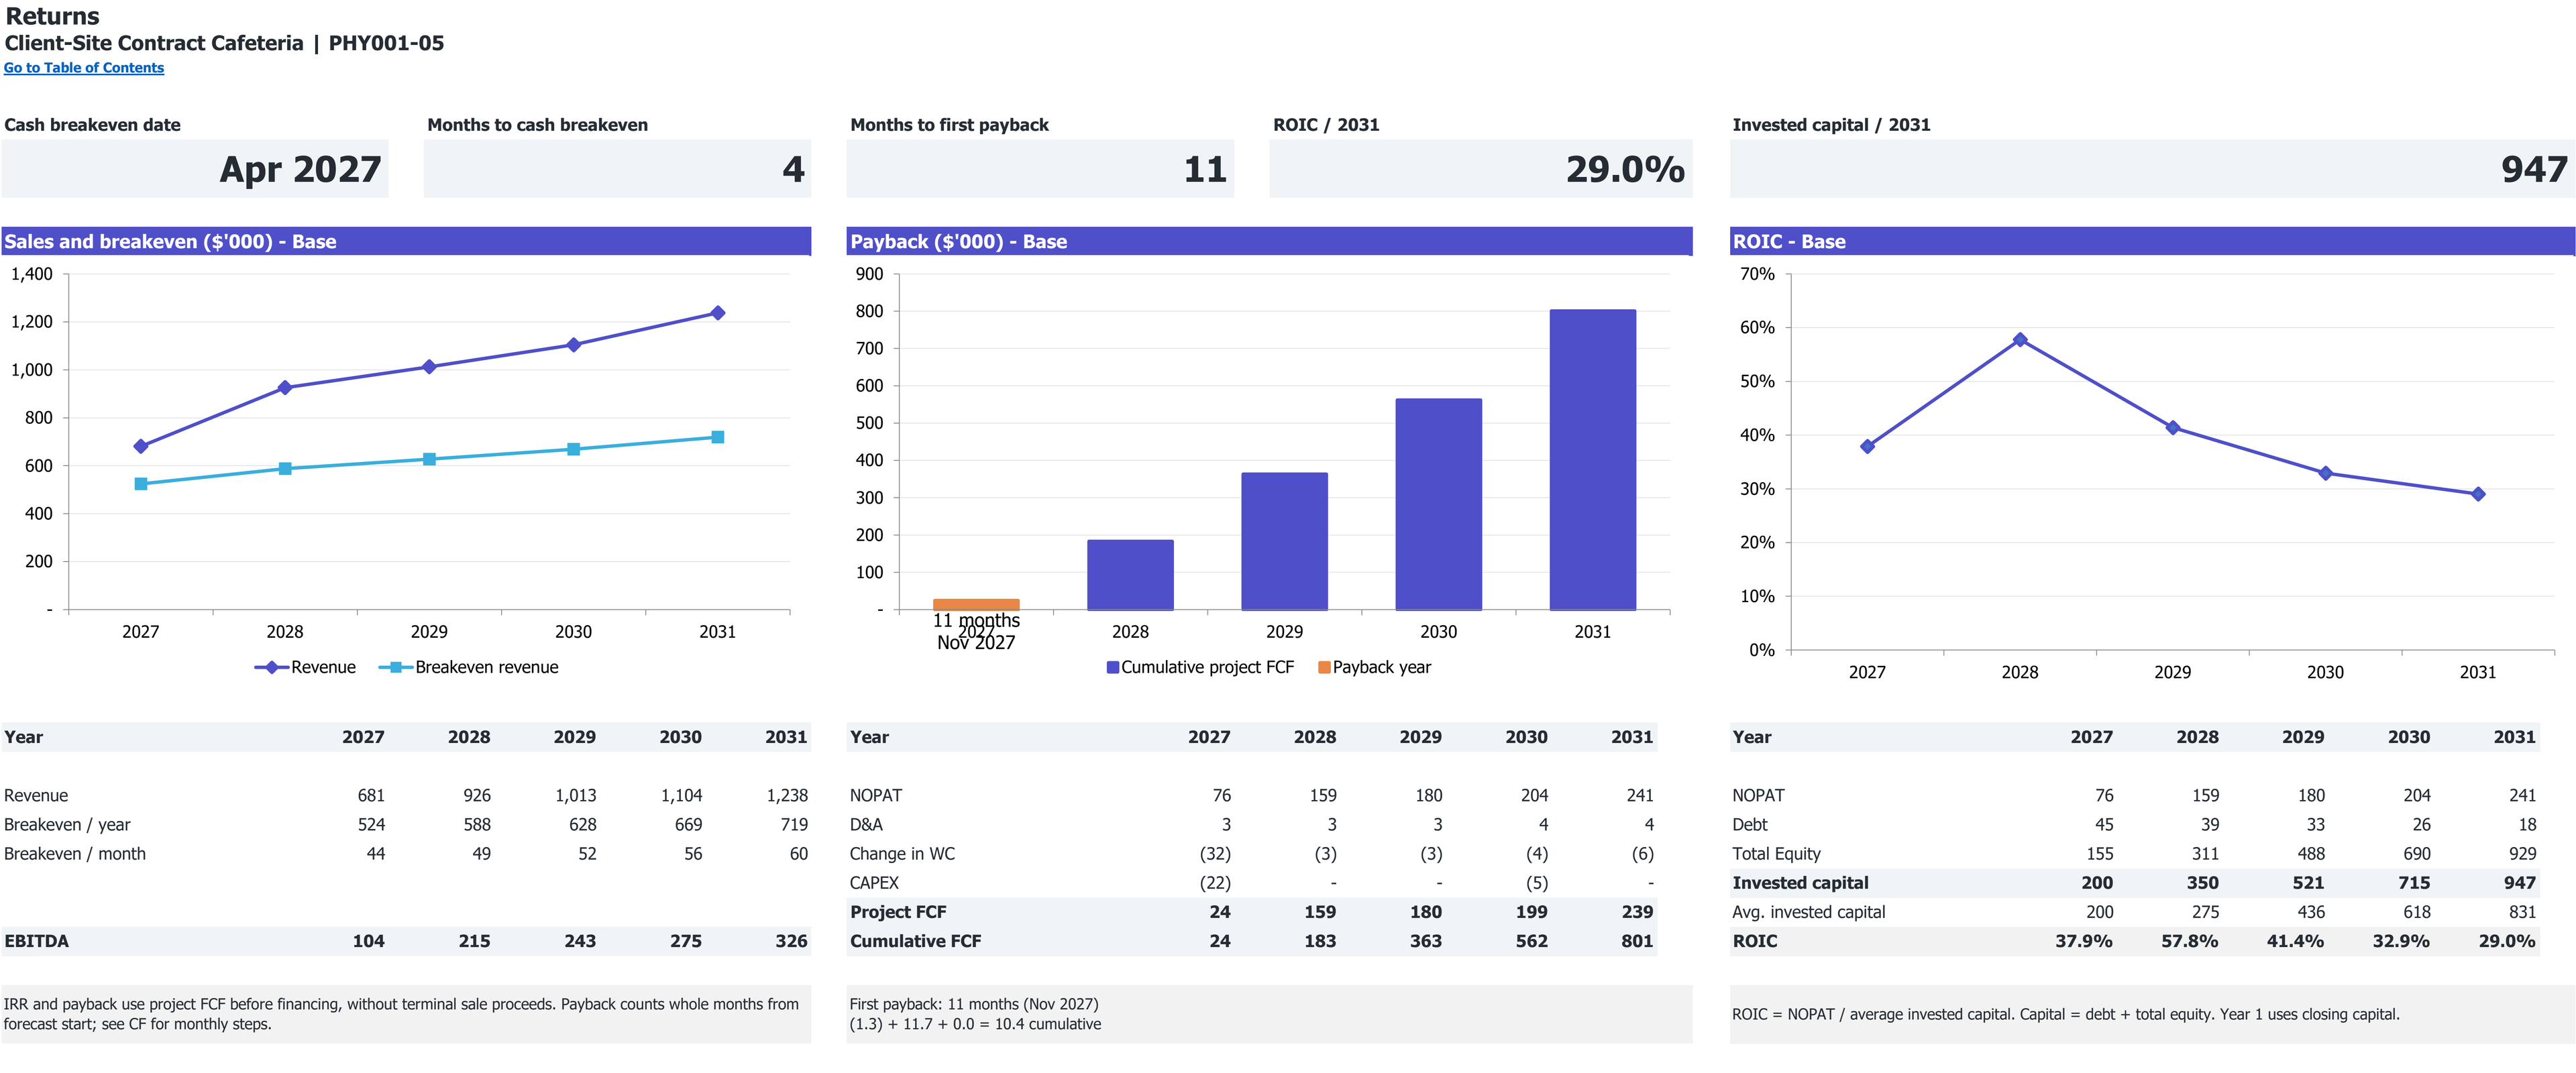
Excerpt from Returns: cumulative project free cash flow and first payback, if reached. 2027–2031 base case; dollar amounts in thousands. First payback shown: 11 months (Nov 2027).
Open full Returns view in a new tabExcerpt from Returns: revenue, annual and monthly break-even revenue, and EBITDA. 2027–2031 base case; dollar amounts in thousands.
Open full Returns view in a new tab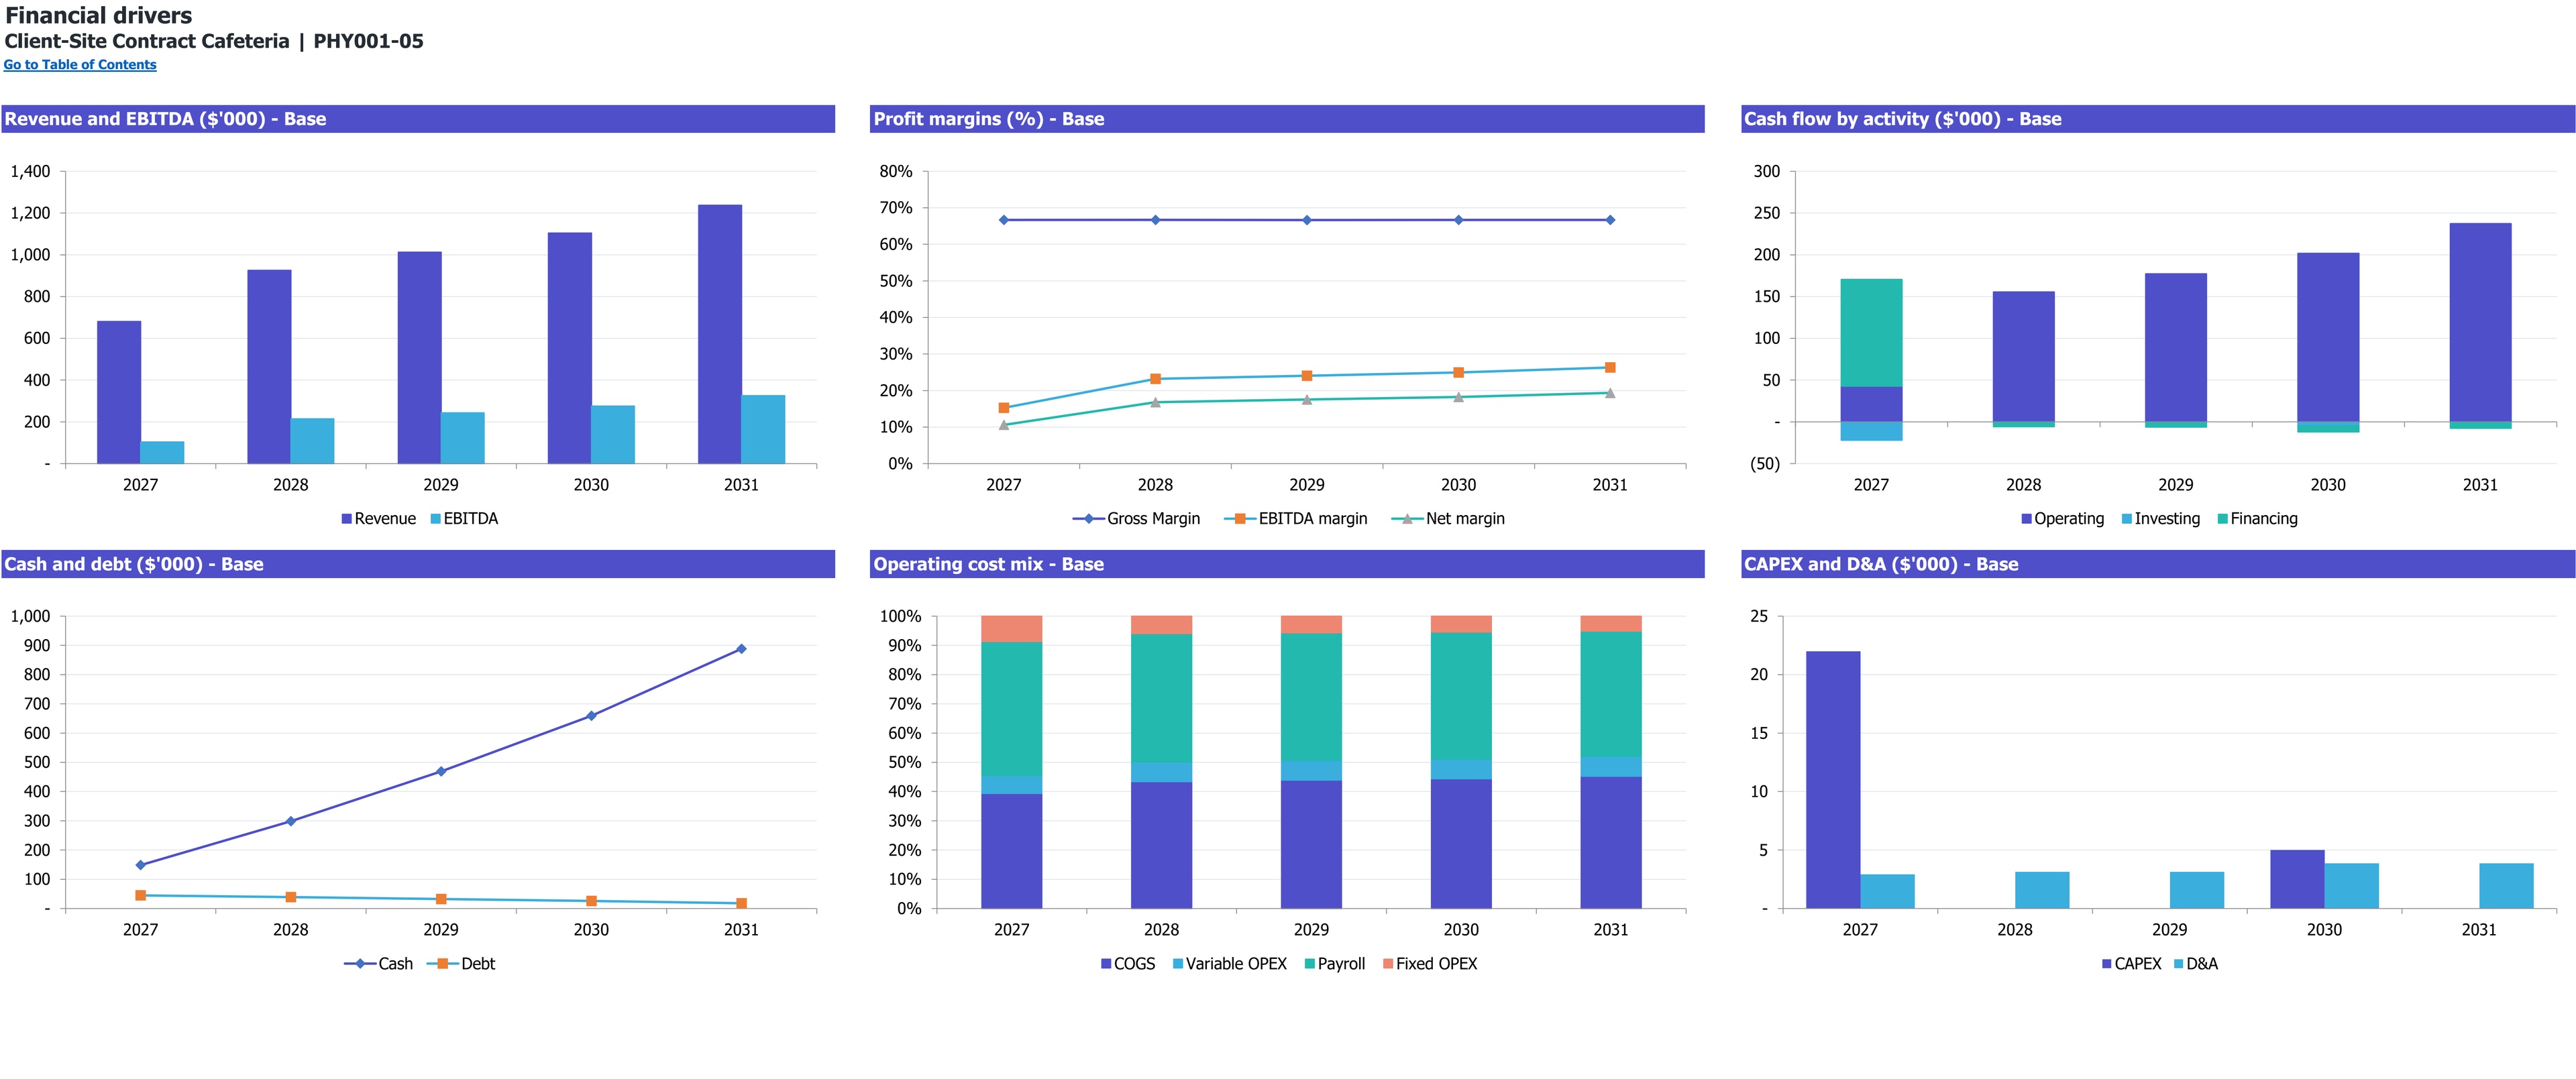
Six annual financial-driver charts for Client-Site Contract Cafeteria, 2027–2031 (Base scenario). Dollar amounts are in thousands; margins and cost mix are percentages.
Enlarge image in a new tab8 selected worksheet views. Figures show this workbook’s starting case.
Workbook availability
What is inside the Excel model
Plan the operator’s economics inside a client-funded cafeteria. This workbook links onsite attendance and lunch participation to practical meal capacity, employee payments and a client subsidy.
Selected worksheets from the documented workbook. Forecast period: January 2027–December 2031. Model reference: PHY001-05.
Inputs you control. Results you can inspect.
On a small screen, scroll within the table to read every column.
| Planning area | Inputs you review | How they connect | Results to inspect |
|---|---|---|---|
| Onsite demand | Eligible employees, onsite share, participation, calendar and ramp. | Employee-days generate requested lunches, capped at one per onsite employee-day. | Requested and served meals. |
| Meal receipts | Employee price and independent client subsidy per served meal. | Both receipts belong to the same fulfilled lunch. | Total and component revenue. |
| Practical capacity | Cook and service FTE, host equipment, lanes, seats and service time. | The tightest funded or physical resource limits whole meals. | Capacity and unmet lunch demand. |
| Meal costs | Recipe portions, ingredient prices, yield, consumables and employee card fees. | Actual served meals drive ingredient and transaction expense. | Food and variable operating costs. |
| Operator responsibilities | Payroll, portable tools, support workspace and fixed overhead. | Operator expenses exclude host-provided premises and major assets. | EBITDA and operator CAPEX. |
| Funding and settlement | Equity, debt, blended receivable days, inventory and tax. | Cash combines operating activity, working capital and debt service. | Funding needs and project recovery. |
Is this the right model for your business?
Check the starting case before changing the assumptions.
The starting operation
- One client site with 1,000 eligible employees and an equipped, 3,000-square-foot cafeteria.
- A principal food-service operator that bears food, staffing and operating risk while earning a subsidy per served meal.
- A plan in which the client provides premises and major assets, and the operator funds portable tools and service delivery.
Check the boundary
The case excludes management-fee-only contracts, guaranteed deficit reimbursement, a second site, vending, catering and deliveries.
Compare the other restaurant typesHow this business makes money
Connect the unit sold to the resources required by this operating case.
Revenue logic
Revenue = meals served × (employee price + client subsidy).
Both receipts pay for one meal. Practical kitchen and lunch-service limits constrain the number served.
What determines a contract cafeteria operator’s revenue?
Revenue depends on who is onsite, who wants lunch and how many meals the funded team can serve. In this case each meal earns both the employee payment and client subsidy once. The client’s provision of premises, utilities and major equipment also changes the operator’s cost base. Contract responsibility must therefore be understood before comparing margins with other food-service formats.
- Demand
- Eligible employees × onsite share × participation × operating dates and launch ramp.
- Meal receipts
- Initial $8 employee payment plus $4 client subsidy.
- Service capacity
- Production, serving labor, checkout lanes and seats.
- Cost allocation
- Host funds premises and major assets; operator funds food, people and portable tools.
What to establish for your own operation
- Confirm the signed allocation of utilities, equipment, cleaning and maintenance.
- Test actual attendance and participation instead of assuming all eligible employees buy lunch.
- Review client payment timing and concentration risk separately from the blended receivable proxy.
Follow the plan from demand to cash
Open each section for the assumptions, calculations, and limits of this workbook’s starting case.
One lunch, two payment componentsRevenue
Each initial served lunch earns $12: $8 from the employee and $4 from the client. There is no additional management fee, fixed coverage payment or guaranteed deficit reimbursement. The subsidy does not create another meal or automatically increase participation.
The case begins with 60% of 1,000 employees onsite and 50% lunch participation. Monday–Friday dates generate demand, with a four-month launch ramp from 70% of the selected level. Whole meals served are limited by equipment, funded cooks, serving staff, checkout lanes and seats.
- March 2027 opening; 2027 includes January–February mobilization.
- Host equipment assumes 100 meals/hour over six preparation hours; funded cooks provide a separate limit.
- Two lanes, a three-hour lunch window and 120 seats are tested independently. Holidays are not separately removed.
Fund operator labor without duplicating client costsPayroll
Paid staffing rises from 6.0 FTE initially to 7.3 in 2031. It includes a paid owner/site supervisor, preparation, production cooks, utility and serving/cashier staff. Wages rise 3% annually, payroll load is 10.65%, and the separate welfare pool starts at $900 monthly.
Initial food purchases are $4 per served lunch, based on protein, vegetables and other ingredients divided by 90% usable yield. Consumables add $0.25. Employee processing starts at $0.37464 per meal; the client subsidy uses fee-free transfer. Per-meal costs contain no duplicated labor.
- The client provides premises, utilities, major equipment, building upkeep, cleaning, waste collection and onsite connectivity.
- The operator funds food-contact cleaning materials, tools, insurance, administration and its own $250 monthly support workspace.
- Cook and service resources grow separately; owner, prep and utility hours do not duplicate their capacity.
Measure the operator investment, not the whole cafeteria buildCAPEX
Initial operator CAPEX is $22,000 for preparation and service tools, POS devices, portable storage and setup. It includes $2,000 fully spent contingency. January 2030 adds $5,000 replacement capital. The operator does not purchase the host kitchen or pay for a restaurant fitout.
January funding totals $133,000: $83,000 equity and $50,000 debt. The loan assumption is 10% fixed interest over 84 monthly annuity payments with no grace. Equity covers the pre-equity trough and a $50,000 retained reserve, separate from spending.
- The modeled cash trough before equity, including debt and debt service, is −$32,904.
- Receivables use 12 days of total sales as a blended proxy for employee receipts and client invoices.
- Food inventory uses seven cost days; payables are zero. Separate employer invoice aging is not modeled.
Interpret margins in light of client supportCF
Base 2027 revenue is $680,760 from 56,730 served meals, with EBITDA of $103,910. Across five years, revenue is $4,961,142 and EBITDA $1,163,074. Host-provided assets and a per-meal subsidy materially support these operator results.
EBITDA and EBIT become nonnegative in March 2027 and remain so; operating cash follows in April. Project payback occurs in November 2027 using cumulative undiscounted unlevered cash flow from January. It covers the operator’s capital and deficits, excluding host assets and financing.
- No shareholder distributions are scheduled; accumulated business cash is not an owner payout.
- The tested monetary Low scenario retains positive minimum cash of $39,723, below the selected $50,000 reserve.
- KPIs include realized lunch participation, which can fall below the entered percentage because of ramp and capacity.
Selected results from the starting case
Modeled results in USD unless stated otherwise. These describe the selected inputs, not an estimate for your location or a guaranteed outcome.
- First-year meals and revenue
- 56,730 meals · $680,760Base calendar 2027; USD revenue includes employee payments and client subsidies for the same meals.
- Five-year EBITDA
- $1,163,074Base January 2027–December 2031, USD; 23.4% weighted margin within the operator-only cost scope.
- Minimum funded cash
- $50,096Base monthly cash minimum in March 2027, USD, after selected equity and loan funding.
- Operating cash coverage
- April 2027 · month 4First active Base month of nonnegative operating cash, sustained thereafter; EBITDA and EBIT cross in March.
- Project payback
- November 2027 · month 11Base cumulative undiscounted unlevered operator project cash crosses zero, counted from January 2027.
- Low-scenario cash minimum
- $39,723Tested monetary Low scenario, USD, across 60 months with Base funding fixed; positive but below the selected reserve.
Make the case your own
Work from the operating plan toward the cash requirement.
Confirm the contract’s payer, subsidy and responsibility boundaries.
Set attendance, participation, holiday adjustments and practical lunch capacity.
Replace wages, recipe inputs, operator overhead and portable-asset budgets.
Inspect client settlement timing and monthly cash, then update financing for the chosen contract.
Interpretation and scope
- The national starting case was researched September 26, 2026; it is not a signed client agreement or local cost quote.
- It does not model contract default/renewal probabilities, individual subscriptions or daily queues.
- The 25% blended income-tax rate has no selected jurisdiction or loss carryforward. Client-owned assets are outside operator returns.
The workbook is an Excel file for local planning. Learn how to interpret assumptions and evidence.
Other restaurant types
Each operating type calls for its own financial structure.
Questions
Does the subsidy count as a second meal?
No. Employee and client payments are separate receipts for one served lunch.
Is this a management-fee-only contract?
No. The operator is the principal food-service provider and bears operating risk. There is no additional management fee or deficit guarantee.
Why is operator capital spending relatively low?
The client supplies the equipped cafeteria. The operator funds portable tools and devices, not the host premises or major kitchen equipment.
Does a higher subsidy automatically increase participation?
No. Subsidy and participation are independent inputs. The model does not assume a causal demand response.
Can actual participation differ from the input?
Yes. The ramp and capacity limits may reduce served meals. Realized participation divides served meals by onsite employee-days.
Are all client payments collected immediately?
No. The model uses 12 receivable days on total sales as a blended approximation. It does not maintain separate employer invoice aging.
Is the project’s early payback a return to the host?
No. It measures the operator’s unlevered project cash recovery. Host investment and shareholder distributions are excluded.
Can I buy this model now?
No. Purchasing and workbook downloads are not available on this site.
Which software does the workbook use?
The documented file is an Excel workbook (.xlsx). Compatibility with other spreadsheet applications is not established by the file extension.
Read the planning guides
Explore the relevant operating questions and how to interpret a workbook’s assumptions.
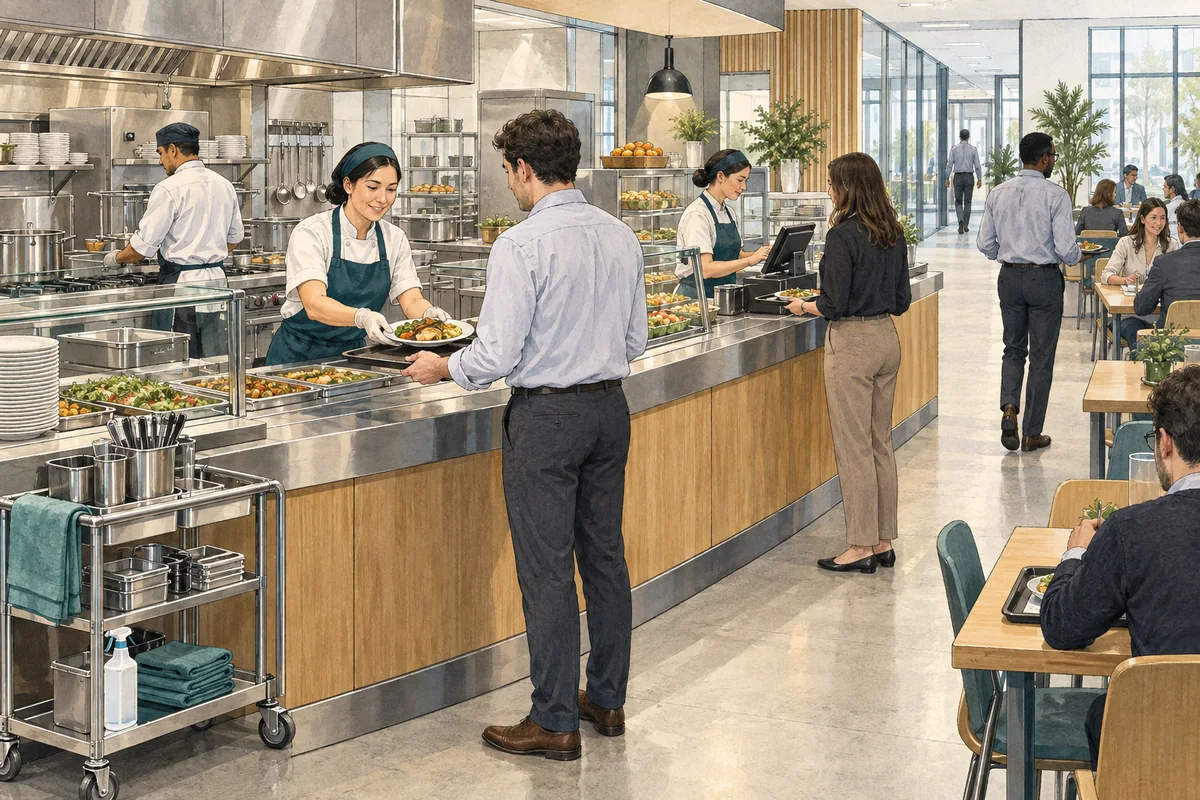
How should employee payments and a client subsidy enter a cafeteria forecast?
Count one cafeteria meal with two payers, separate host and operator responsibilities, and check the cash timing behind the subsidy.
Read the guide
How to read financial assumptions before editing an Excel model
Follow the chain from operating assumptions to calculated results, check units and timing, and keep a useful record of changes to a financial workbook.
Read the guideEvidence and scope
The cited page supports the physical format or operating boundary, not every proposed service, contract term, cost item or financial result.
The links below provide operating-format context; they do not verify the workbook’s selected inputs or calculated returns.
The workbook guide and figures describe model PHY001-05, revision r01, for January 2027–December 2031. These are a documented planning case, not observed results for a particular business.