
Restaurant Financial Model: Delivery-Only Kitchen
Model a delivery-only kitchen with marketplace and direct orders, channel-specific costs, shared capacity, startup funding and cash flow.
- Excel (.xlsx)
- Forecast: 60 months · five calendar years
- Starting format: 600 sq ft · delivery only
- Model inputs: English · USD · Base scenario
Planning several types? Compare 17 restaurant formats
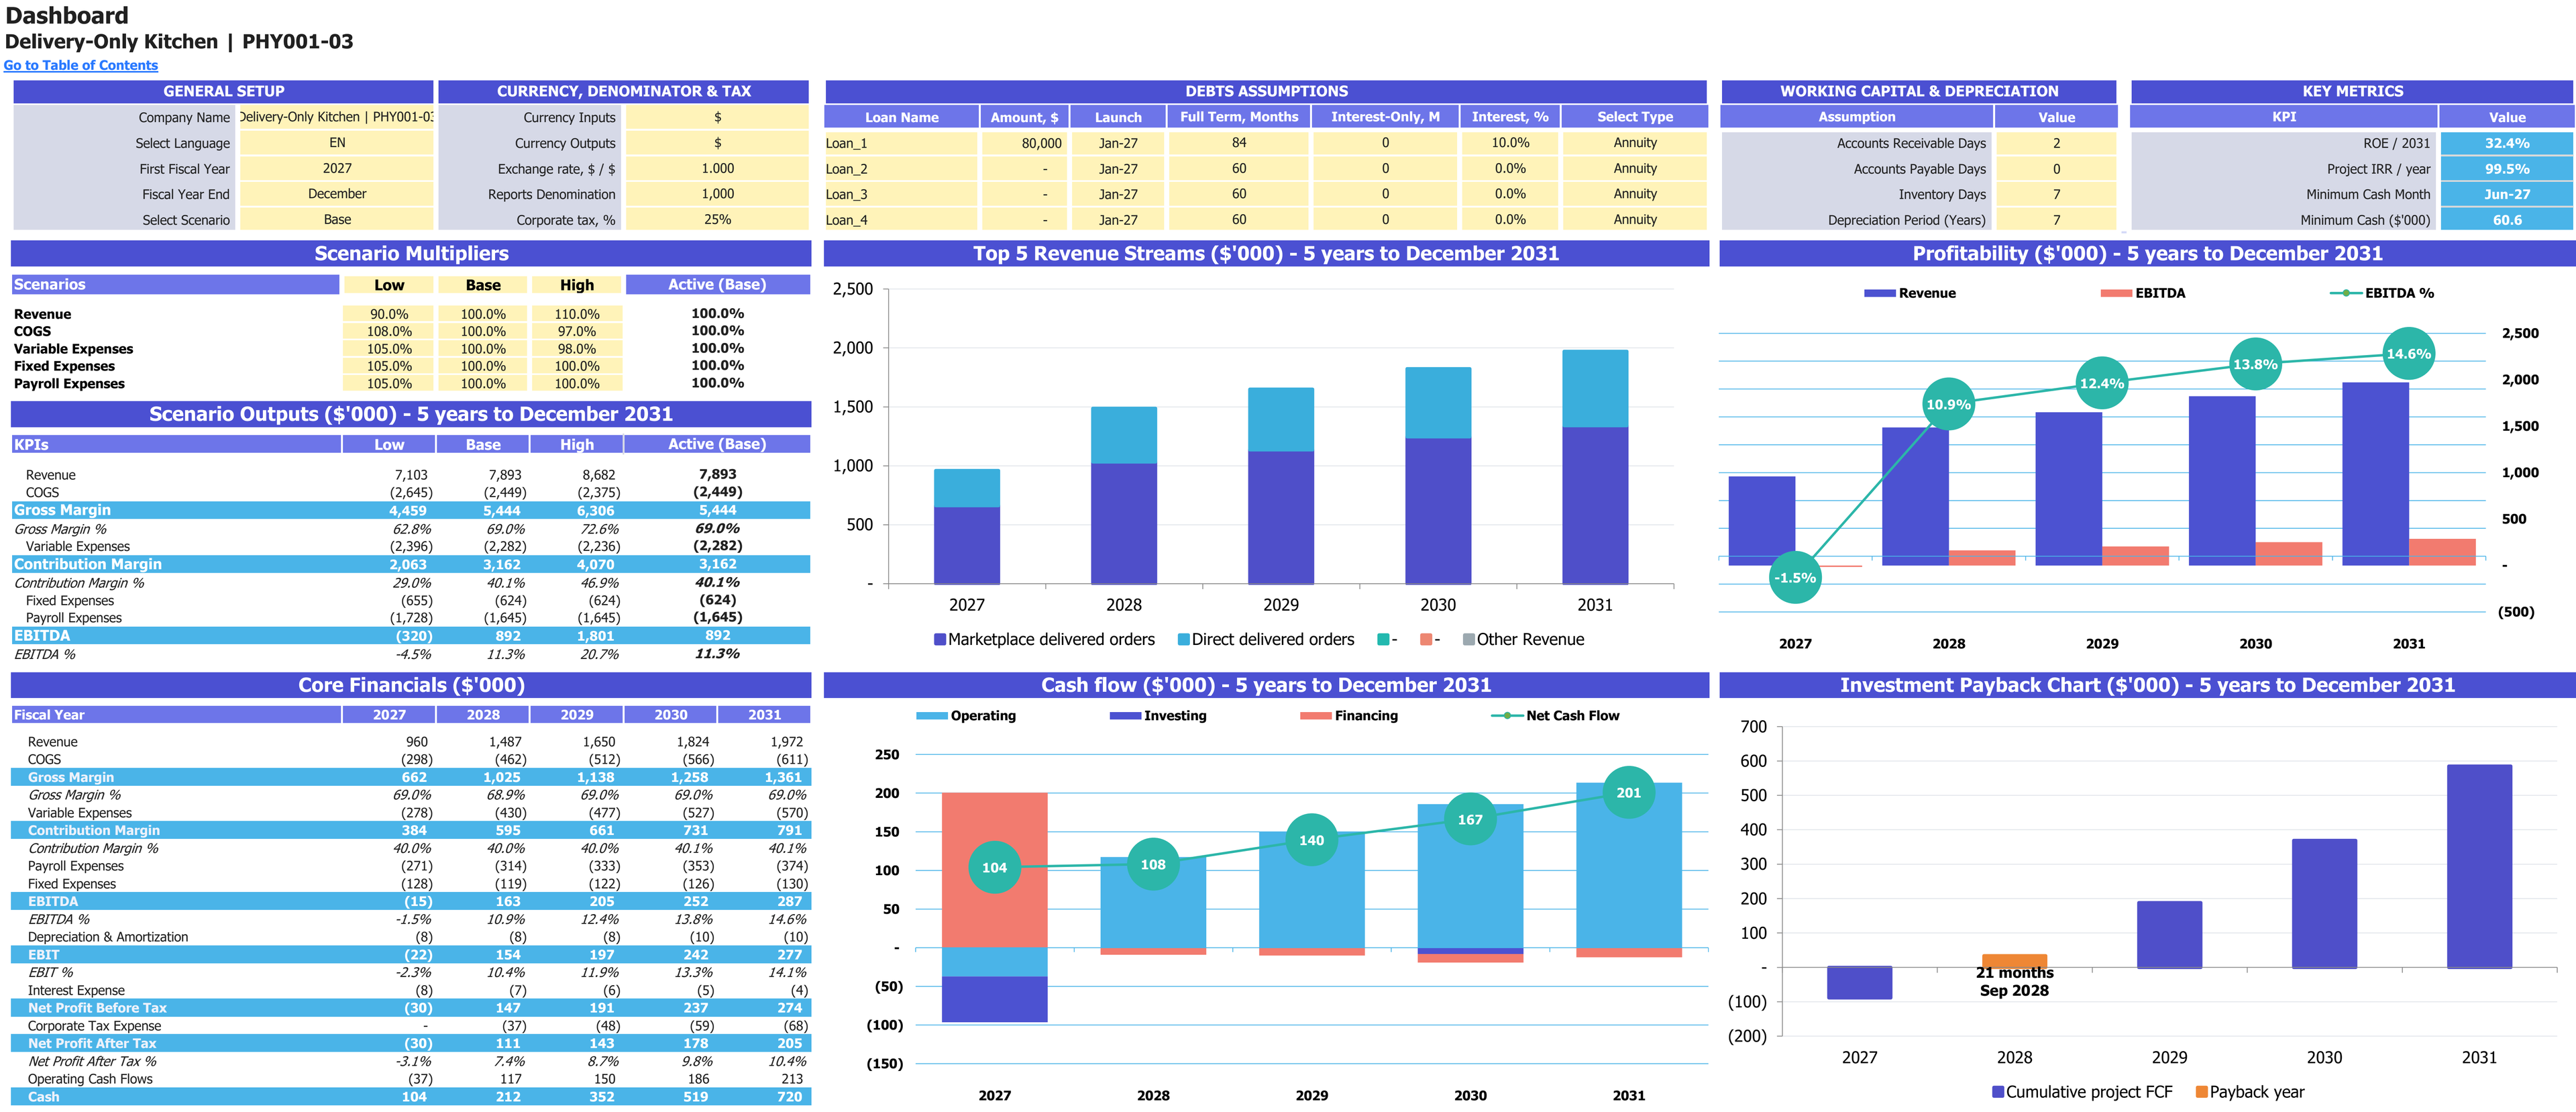
Base-case scenario controls, annual financial results and charts for 2027–2031. Financial report amounts are shown in thousands of USD; percentage measures retain their own units.
Enlarge image in a new tab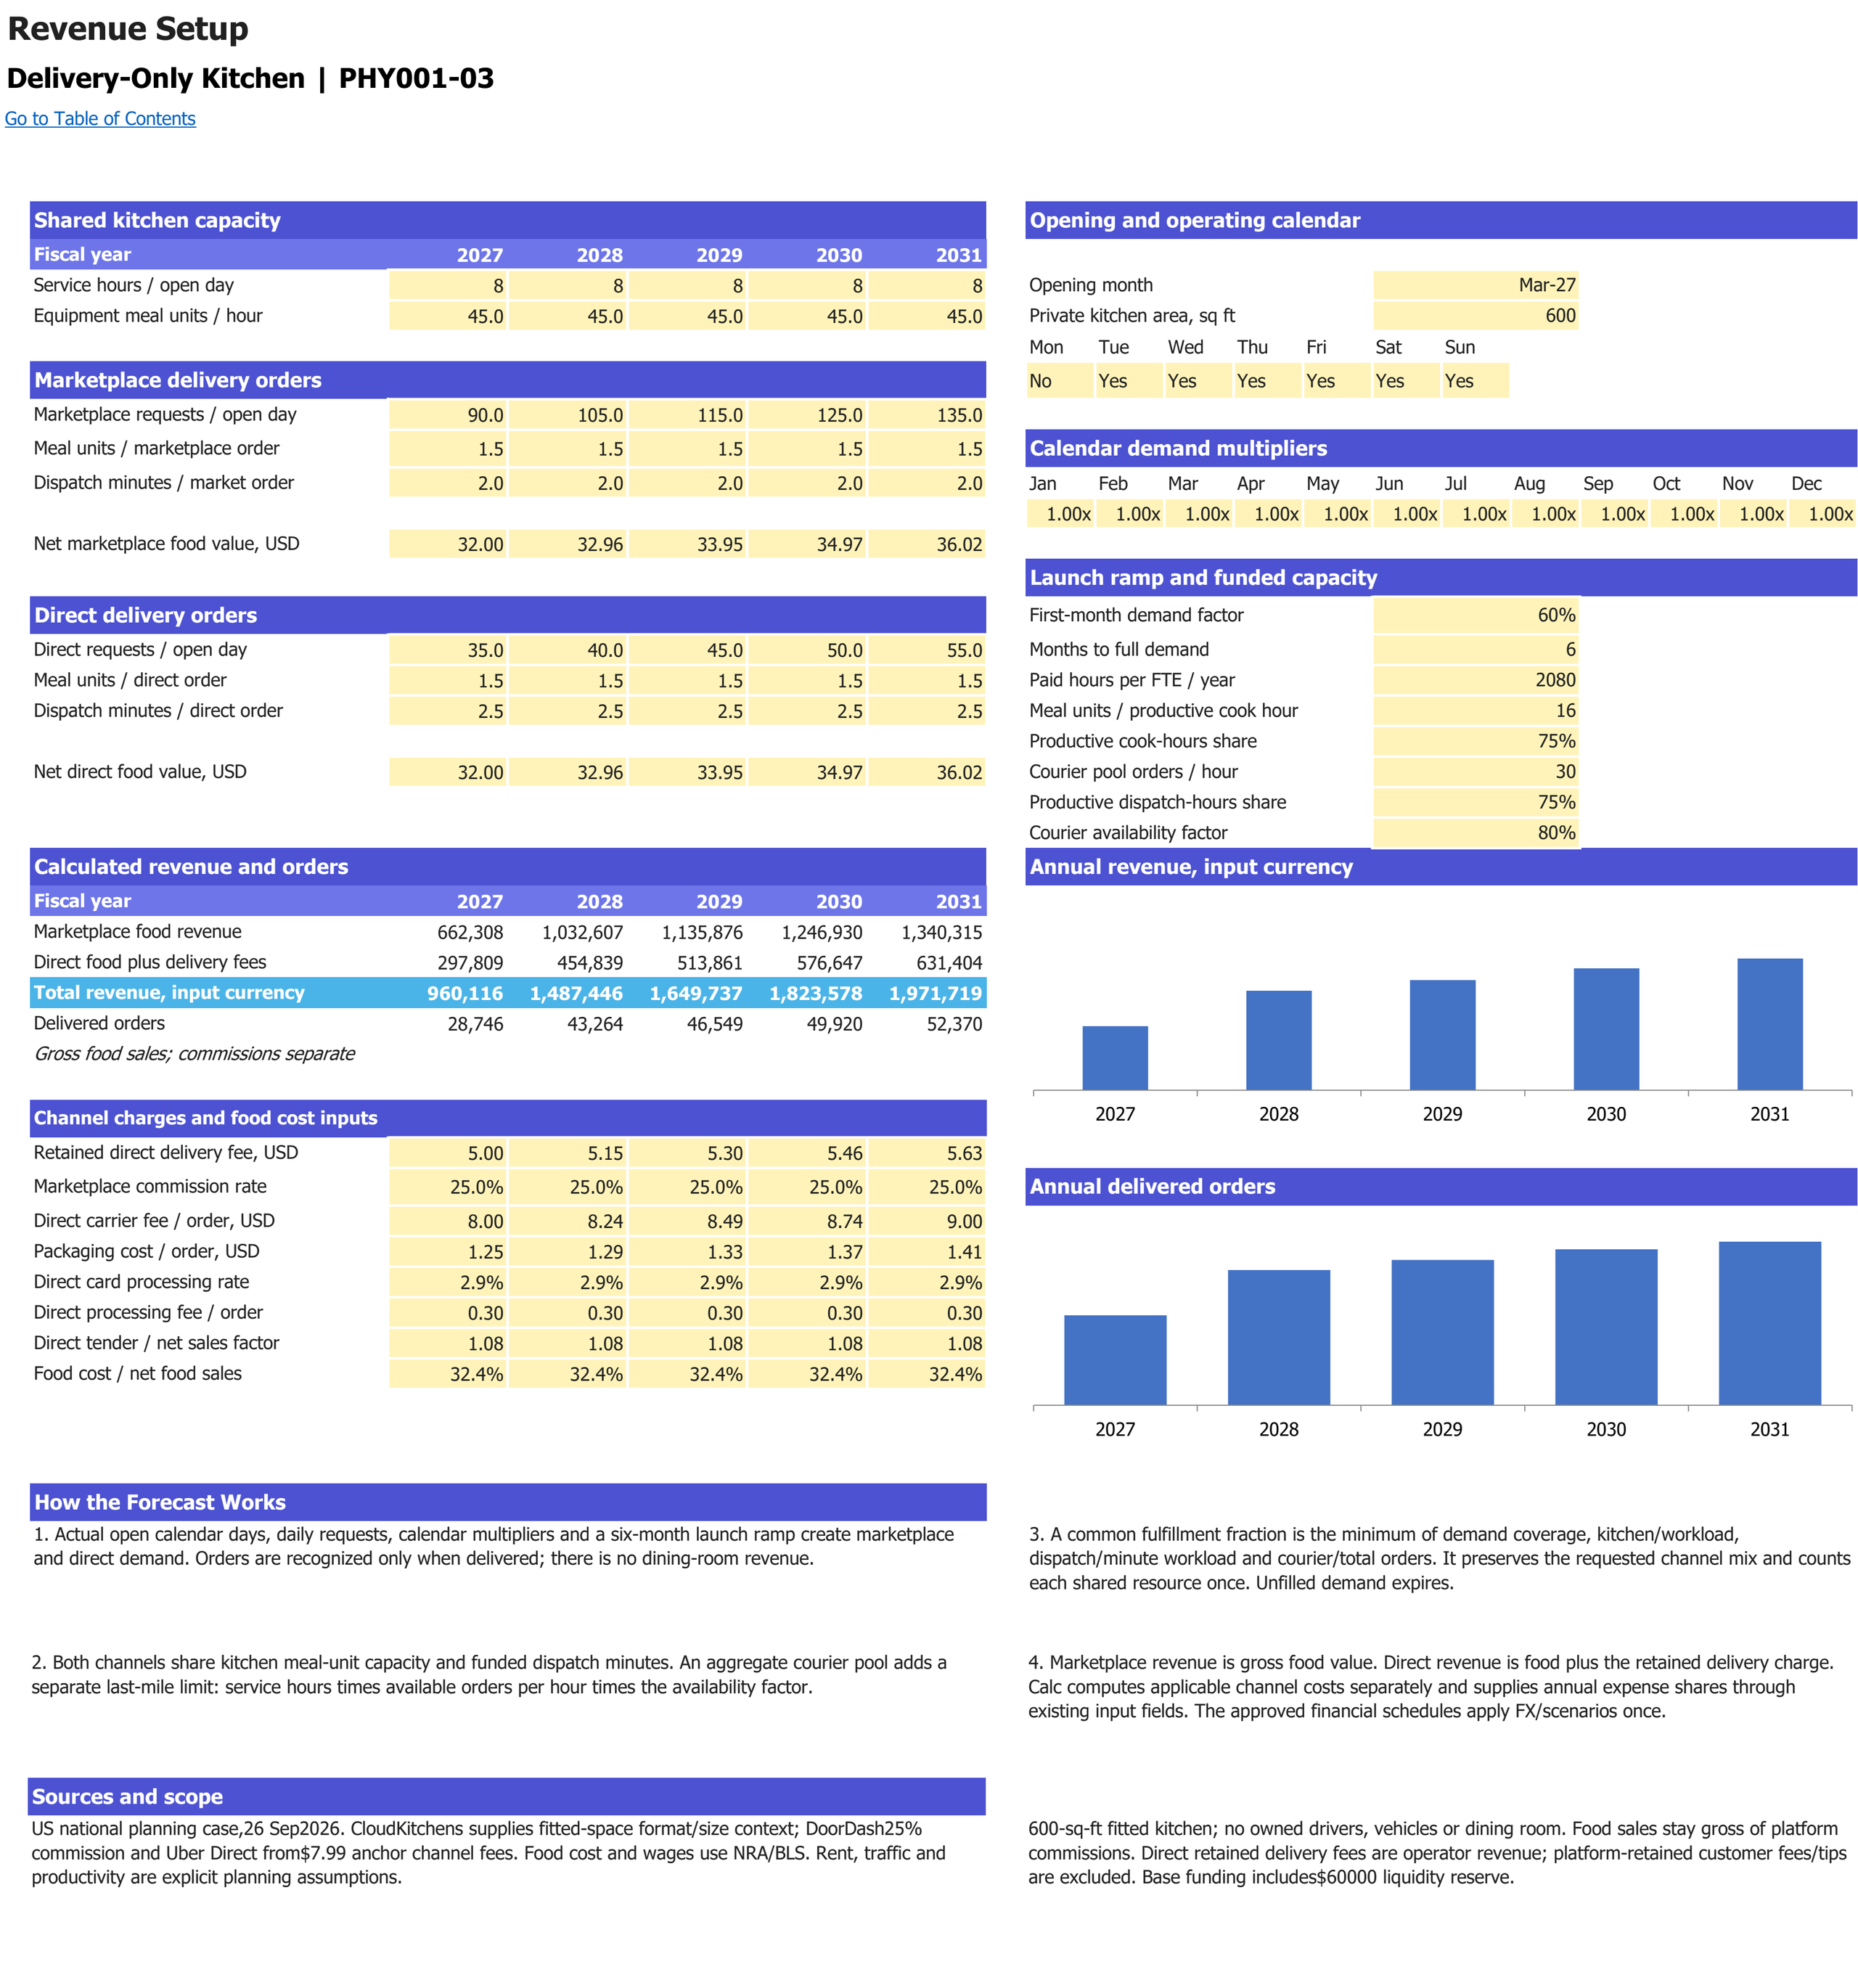
Delivery-channel demand, meal preparation and dispatch capacity, with fulfilled orders and sales. Monetary inputs and sales use USD; operating volumes retain their labelled units. Forecast years are 2027–2031.
Enlarge image in a new tab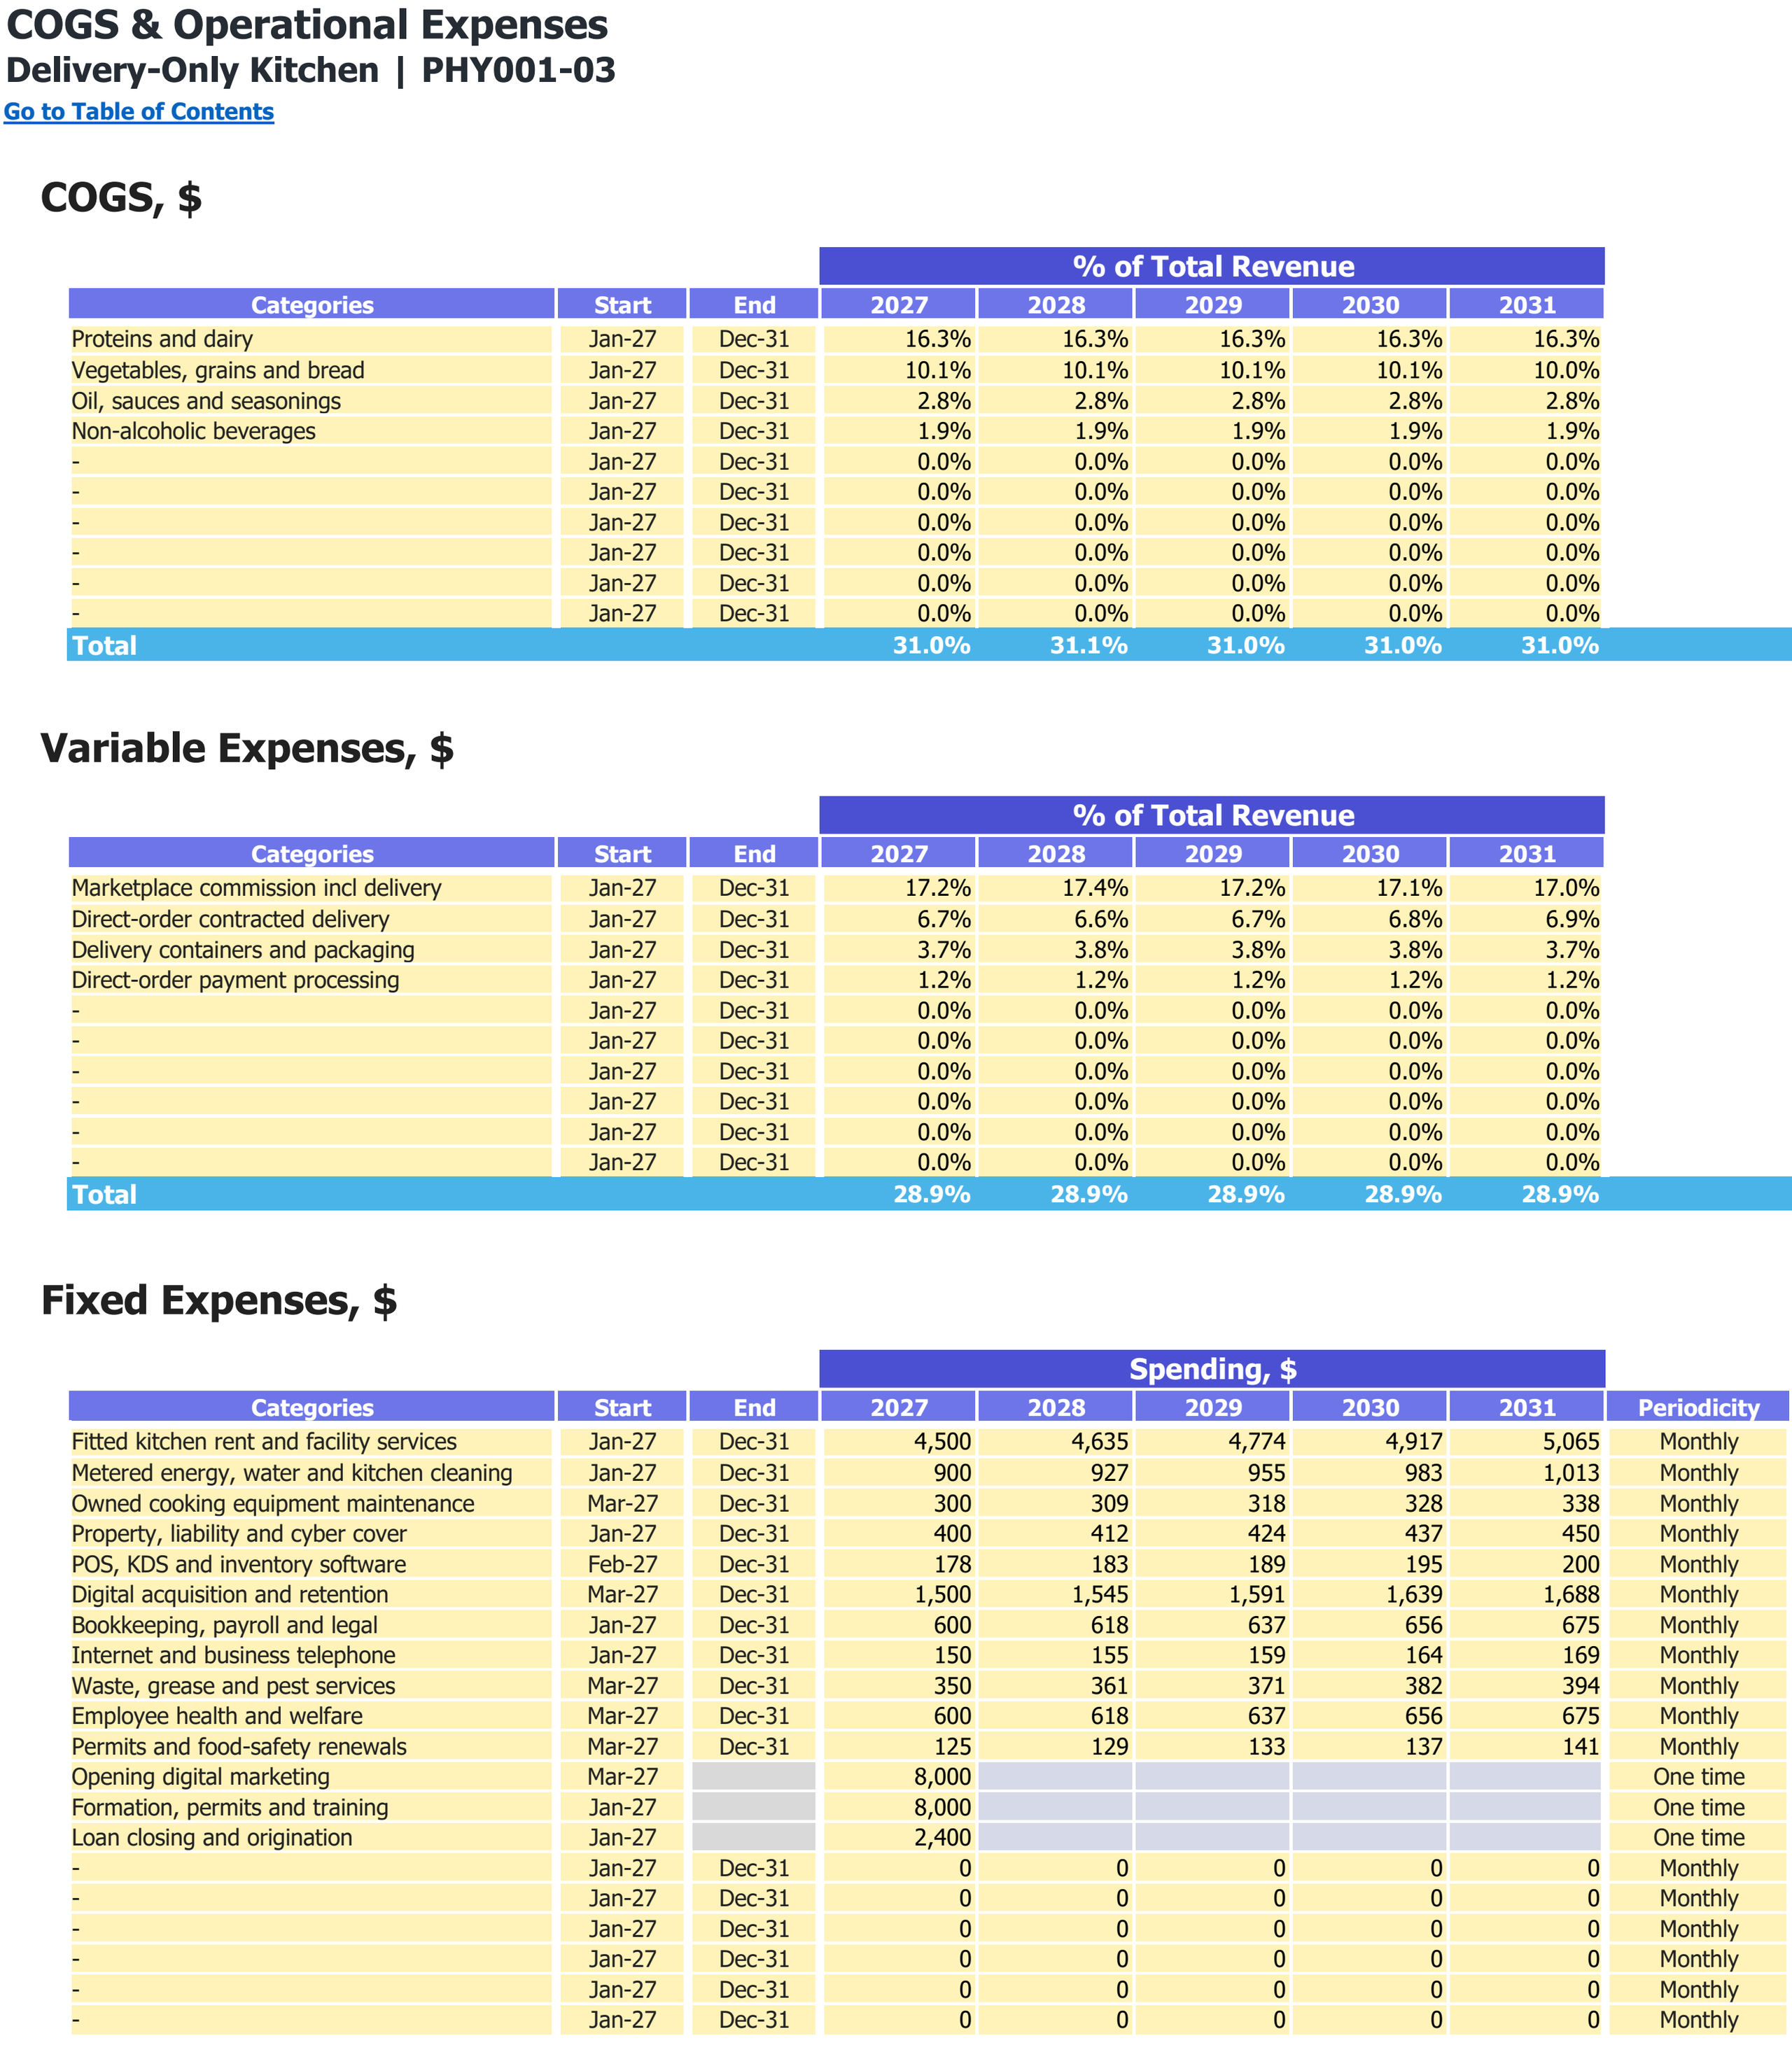
Food and other direct-cost categories, variable expense shares and fixed operating expenses. Monetary inputs are USD; the annual percentage columns are cost shares of revenue.
Enlarge image in a new tab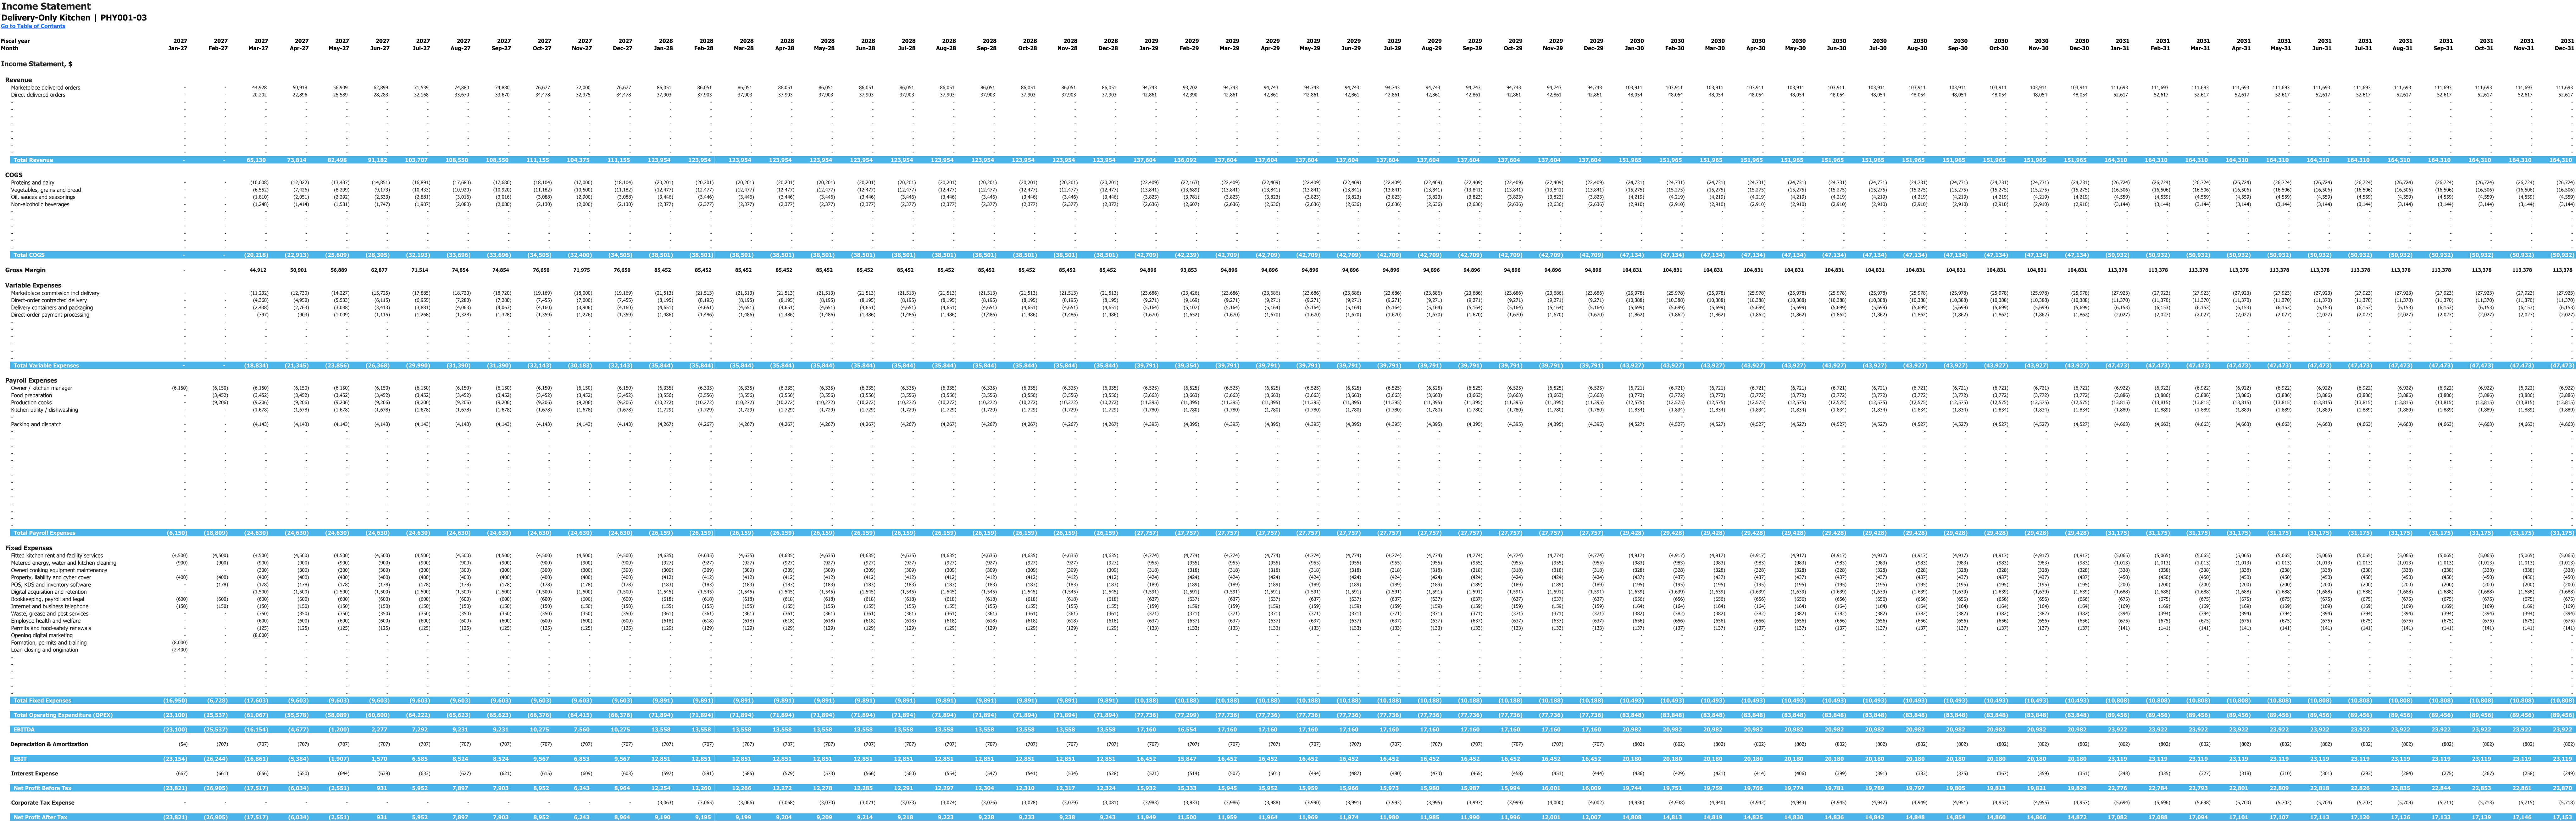
Monthly income statement for 2027–2031, in USD. This is an income statement view; it does not show payroll setup inputs. Enlarge to inspect the wide monthly table.
Enlarge image in a new tab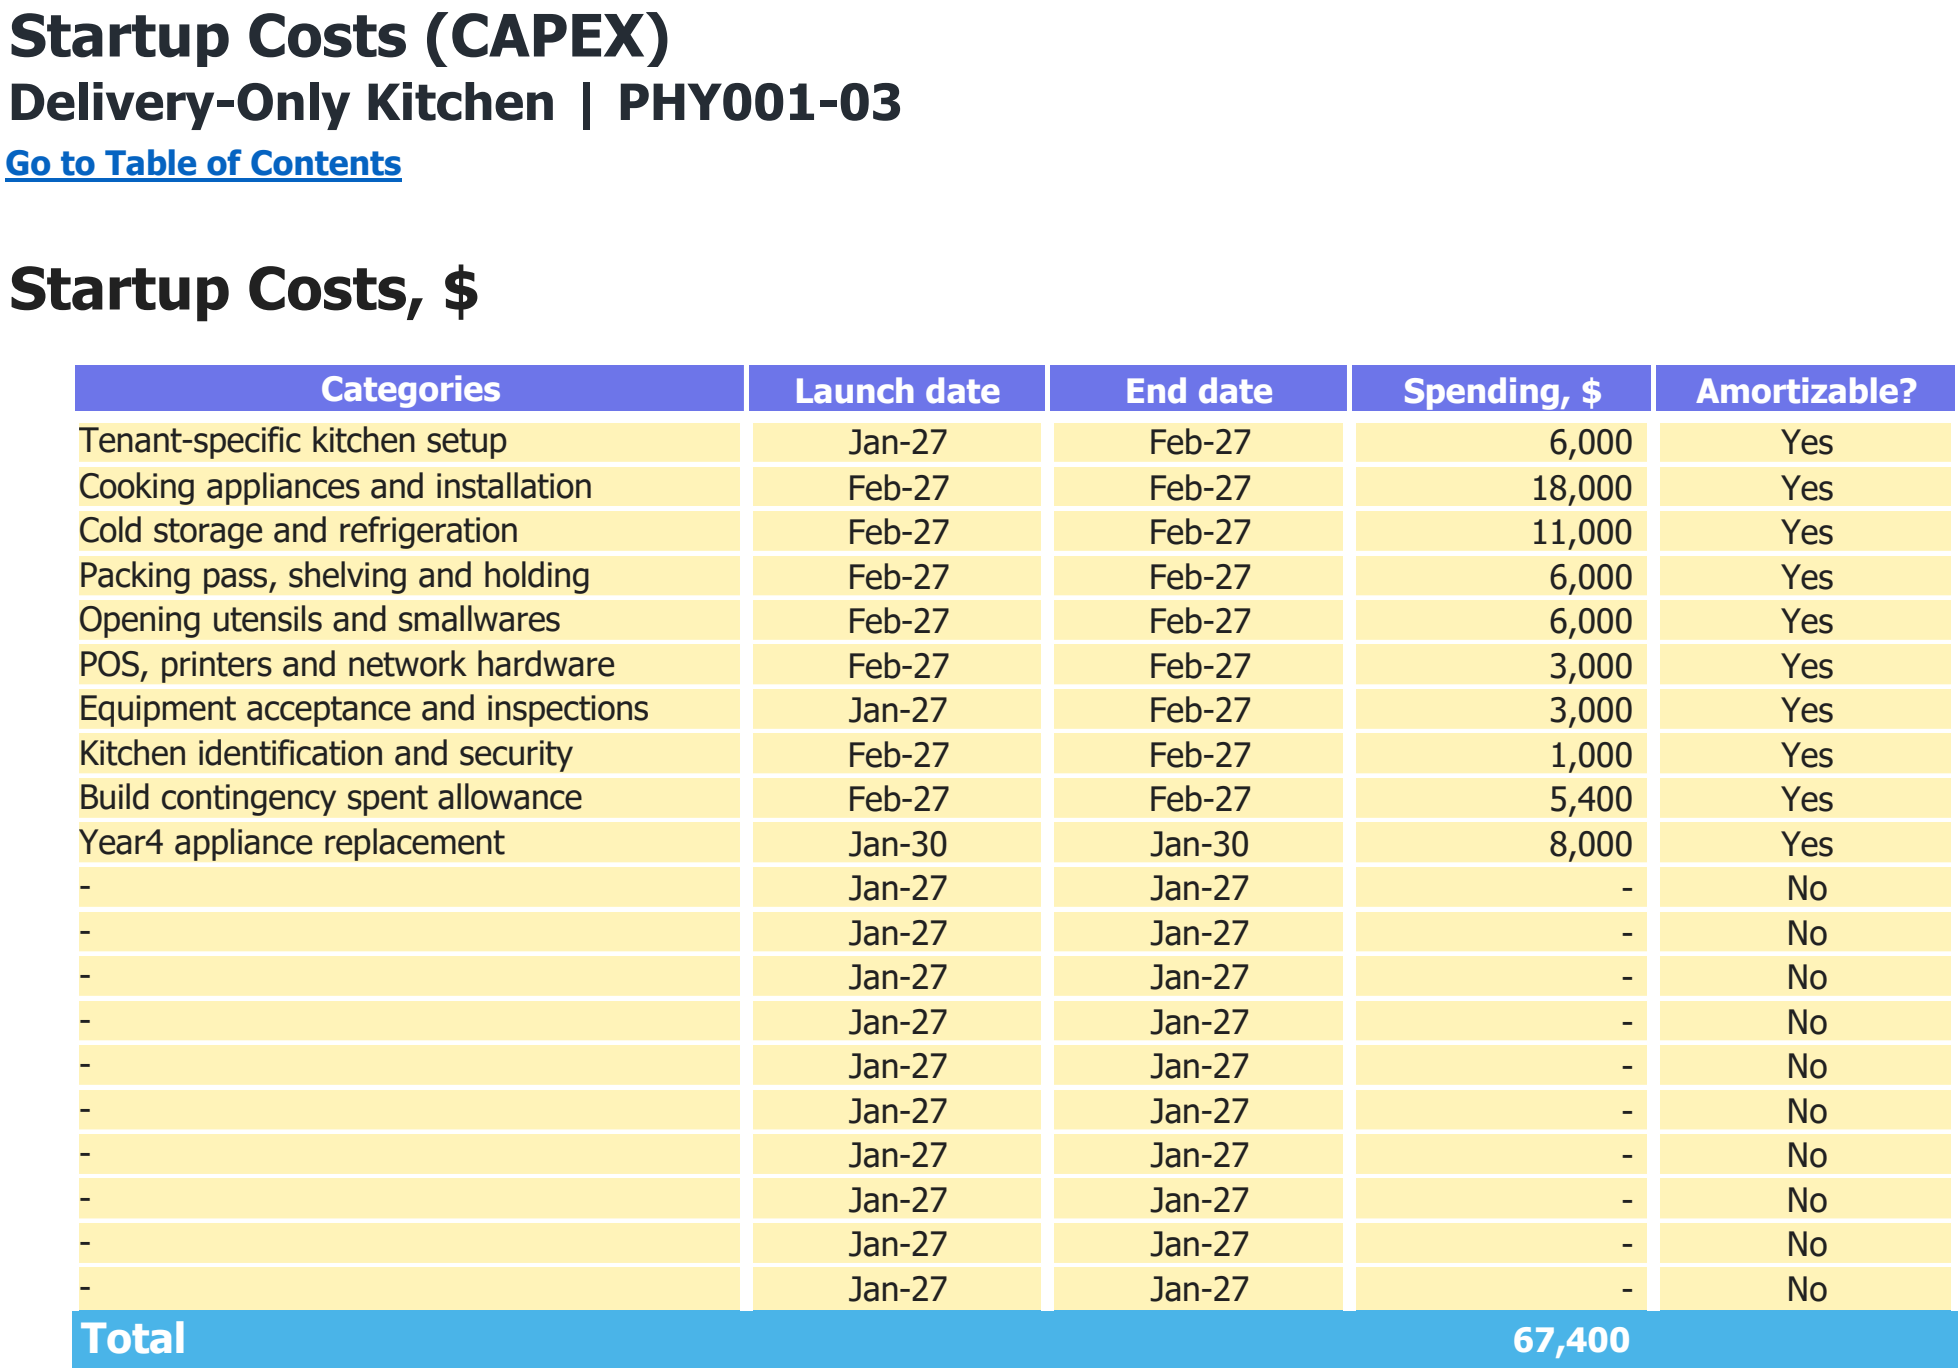
Asset categories, purchase dates and spending assumptions in USD. The total includes every scheduled purchase shown, including later replacements where present.
Enlarge image in a new tab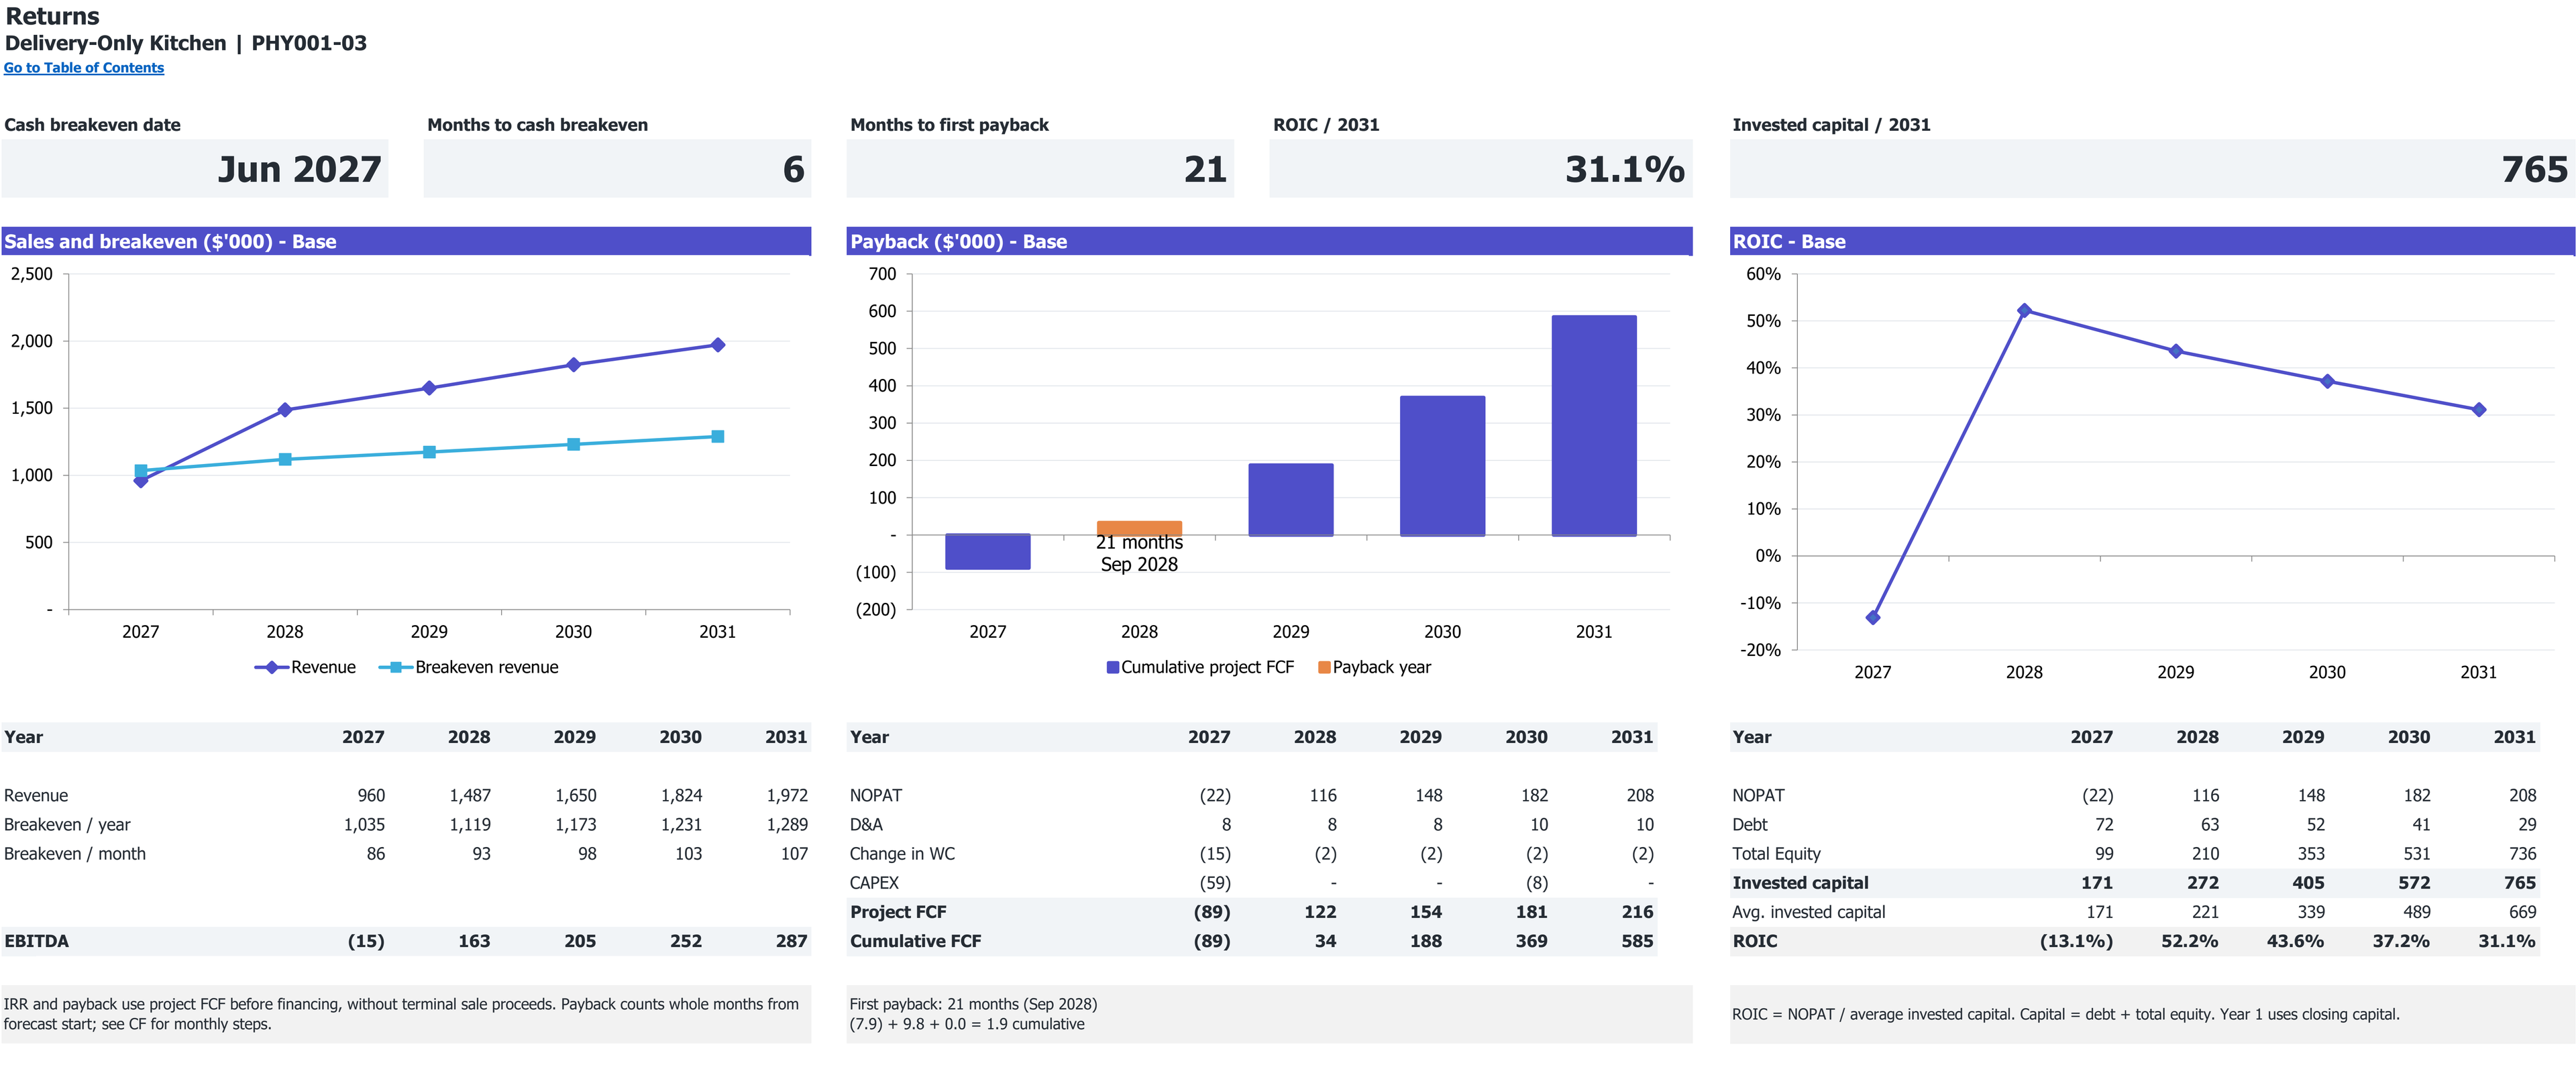
Excerpt from Returns: cumulative project free cash flow and first payback, if reached. 2027–2031 base case; dollar amounts in thousands.
Open full Returns view in a new tabExcerpt from Returns: revenue, annual and monthly break-even revenue, and EBITDA. 2027–2031 base case; dollar amounts in thousands.
Open full Returns view in a new tab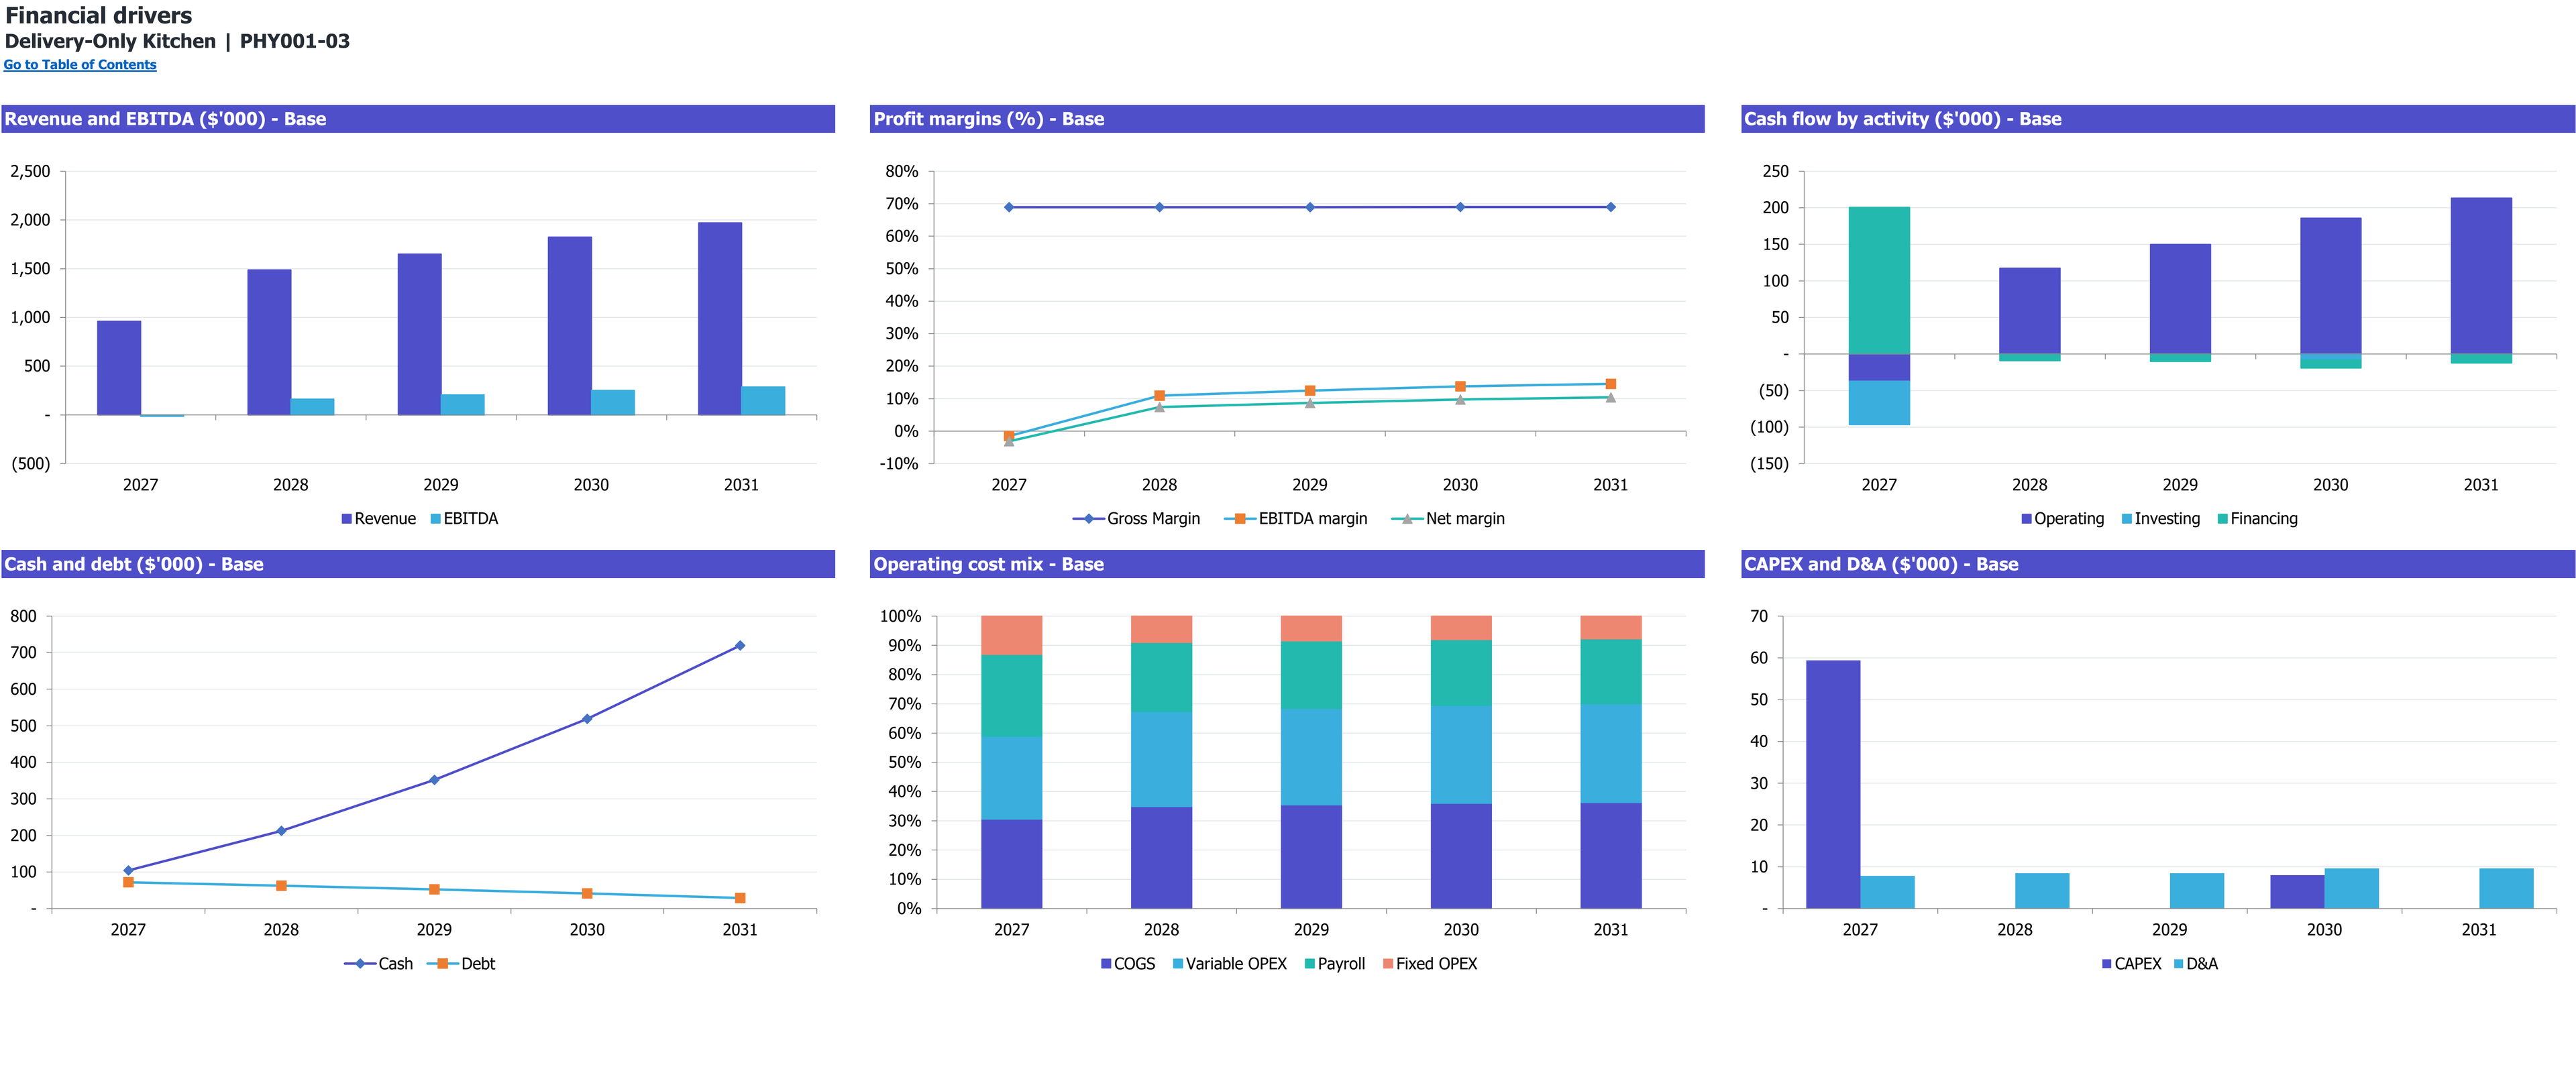
Six annual financial-driver charts for Delivery-Only Kitchen, 2027–2031 (Base scenario). Dollar amounts are in thousands; margins and cost mix are percentages.
Enlarge image in a new tab8 selected worksheet views. Figures show this workbook’s starting case.
Workbook overview
What is inside the Excel model
Compare marketplace and direct delivery after their different costs. This workbook links delivered orders to shared kitchen, dispatch and courier capacity, then carries feasible sales through staffing, investment and cash.
Selected worksheets from the documented workbook. Forecast period: January 2027–December 2031. Model reference: PHY001-03.
Inputs you control. Results you can inspect.
On a small screen, scroll within the table to read every column.
| Planning area | Inputs you review | How they connect | Results to inspect |
|---|---|---|---|
| Channel demand | Marketplace and direct requests, service calendar and launch ramp. | Both channels share kitchen, dispatch and courier constraints. | Delivered orders by channel. |
| Food and fees | Food baskets and the operator-retained direct delivery charge. | Each order earns food revenue once; direct fees are added separately. | Food revenue and retained delivery fees. |
| Channel costs | Commission, direct carrier fees, packaging and direct processing. | Each expense uses its applicable sales or order base. | Channel-specific variable costs. |
| Paid resources | Cook and dispatch FTE, wages and productive-hour assumptions. | Funded hours determine labor costs and practical capacity. | Staffing needs and fulfillment limits. |
| Facility and assets | Fitted rent, equipment, setup and replacement schedules. | Operator costs remain separate from landlord infrastructure. | Operating overhead and CAPEX. |
| Funding and cash | Equity, loan, tax, inventory and settlement assumptions. | Monthly statements include working capital and debt service. | Cash trough, shortfalls and project payback. |
Is this the right model for your business?
Check the starting case before changing the assumptions.
The starting operation
- One fitted commercial kitchen selling exclusively through marketplace and direct delivery channels.
- An operator that earns food revenue as the principal and contracts delivery to outside providers.
- A plan that must test channel mix, funded kitchen growth and the subsidy on direct delivery.
Check the boundary
This case excludes owned drivers and vehicles, dining seats, table service and route-by-route delivery optimization.
Compare the other restaurant typesHow this business makes money
Connect the unit sold to the resources required by this operating case.
Revenue logic
Revenue = delivered food orders × food value, plus retained direct-delivery fees.
Marketplace food sales are gross; commission is separate. Both channels share capacity, and unfilled demand expires.
Does direct delivery necessarily earn more than marketplace delivery?
The model tests that question through separate cost bases. Marketplace food revenue bears a commission that includes delivery. A direct order earns a retained fee but incurs its own carrier and payment charges. Here the initial $5 retained fee is below the $8 carrier allowance, so food margin funds the difference. Channel choice also changes dispatch workload.
- Marketplace
- Gross food subtotal as revenue; 25% initial commission.
- Direct
- Food subtotal plus retained fee; carrier and processing charged separately.
- Shared resources
- Kitchen work, dispatch minutes and available courier slots.
- Fitted facility
- Landlord infrastructure reduces operator capital but remains part of lease economics.
What to establish for your own operation
- Obtain route-specific delivery pricing and realistic availability.
- Confirm exactly which services fitted rent includes.
- Test dispatch workload and demand without assuming a favorable channel shift.
Follow the plan from demand to cash
Open each section for the assumptions, calculations, and limits of this workbook’s starting case.
Earn food revenue once and allocate shared capacityRevenue
The initial case requests 90 marketplace and 35 direct orders per open day. Each has a $32 food basket; direct orders additionally earn a $5 retained delivery fee. Revenue excludes platform-retained customer charges, sales tax and courier tips.
Every order uses 1.5 kitchen workload units. Marketplace orders need two internal dispatch minutes and direct orders 2.5. A common fulfillment fraction applies the tightest kitchen, dispatch or courier constraint to both channels, preserving the selected within-year mix. Unfilled orders expire.
- March 2027 opening; Tuesday–Sunday service for eight hours; six-month ramp from 60% demand.
- Kitchen equipment: 45 units/hour; productive cooks: 16 units/hour at 75% productive time.
- Courier capacity assumes 30 orders/hour at 80% availability. These are operating assumptions, not platform guarantees.
Keep delivery costs on the correct channelPayroll
Marketplace commission starts at 25% of marketplace food sales and includes its delivery service. Direct orders instead incur an $8 carrier fee, compared with only $5 retained from the customer. Direct payment costs use 2.9% of gross tender plus $0.30; packaging starts at $1.25 for every delivered order.
Food is 32.4% of food sales, excluding retained delivery charges. The workbook recalculates linked cost ratios when Revenue inputs change. Staffing begins at 6.1 FTE, including the paid owner, and grows to 6.9 as production cooks increase. Initial fitted rent is a $4,500 monthly allowance.
- Marketplace orders do not also incur the direct carrier or direct payment charge.
- Production cooks grow from 2.4 to 3.2 FTE; packing/dispatch stays at 1.2 FTE.
- Payroll load is 10.65%, annual wage growth 3%, and health/welfare starts at $600 monthly.
Price the operator’s assets and the fitted lease separatelyCAPEX
The landlord provides building systems, hood infrastructure and shared courier reception in the starting case. Operator CAPEX covers cooking appliances, refrigeration, packing facilities, tools and devices. Initial capital spending is $59,400, including $5,400 fully spent contingency; January 2030 replacement adds $8,000.
January funding totals $209,000: $129,000 equity and $80,000 debt. The loan assumption is 10% fixed interest over 84 monthly annuity payments, plus a separately expensed $2,400 closing cost. Equity covers the modeled deficit and a $60,000 retained reserve.
- The cash trough before equity, including debt and service, is −$68,443.
- Receivables use two days of sales; food inventory seven days of food cost; payables zero.
- There is no property purchase, refundable deposit, fleet or terminal asset sale.
Read channel economics alongside the funding requirementCF
Base revenue grows from $960,116 in 2027 to $1,971,719 in 2031. First-year EBITDA is −$14,527; five-year EBITDA totals $892,329. This improvement relies on delivered volume, increased funded cooks, the selected basket and channel costs.
June 2027 is the first active month with nonnegative EBITDA, EBIT and operating cash, sustained thereafter in Base. Undiscounted unlevered project cash flow recovers its cumulative deficit in September 2028. That payback excludes financing and does not describe an owner distribution.
- The tested monetary Low scenario leaves minimum cash of −$280,458 with Base financing unchanged.
- An $8 direct carrier allowance is near the referenced starting fee; actual routes may cost more.
- KPIs include carrier cost/direct order and food cost/food sales, alongside labor, occupancy and profit measures.
Selected results from the starting case
Modeled results in USD unless stated otherwise. These describe the selected inputs, not an estimate for your location or a guaranteed outcome.
- First-year revenue
- $960,116Base calendar 2027, USD; ten service months and 28,746 expected delivered orders.
- Five-year EBITDA
- $892,329Base January 2027–December 2031, USD; 11.3% weighted margin on $7,892,597 revenue.
- Minimum funded cash
- $60,557Base monthly cash minimum in June 2027, USD, after the selected loan and equity.
- Operating break-even
- June 2027 · month 6First active Base month with nonnegative EBITDA, EBIT and operating cash, sustained thereafter.
- Project payback
- September 2028 · month 21Base cumulative undiscounted unlevered project cash flow crosses zero, starting the clock in January 2027.
- Low-scenario cash minimum
- −$280,458Tested monetary Low scenario, USD, over 60 months. Base funding is fixed and does not fill the gap.
Make the case your own
Work from the operating plan toward the cash requirement.
Define the real food basket, retained fee and expected channel mix.
Replace commission and carrier assumptions with applicable agreements.
Check the kitchen, dispatch and courier constraints while adjusting funded staff.
Update facility scope and startup spending, then resize financing against the monthly cash trough.
Interpretation and scope
- The national planning case was researched September 26, 2026; demand, rent and productivity remain assumptions.
- Monthly proportional allocation does not model geography, route travel, refunds, cancellations or intraday queues.
- The 25% blended tax rate has no selected jurisdiction or loss carryforward. No shareholder distributions are scheduled.
The workbook is an Excel file for local planning. Learn how to interpret assumptions and evidence.
Other restaurant types
Each operating type calls for its own financial structure.
Questions
Is marketplace revenue shown after commission?
No. The operator recognizes gross food revenue and records commission separately because the modeled business is the food supplier and principal.
Does the model charge delivery twice?
No. Marketplace commission includes delivery. A separate carrier charge applies only to direct orders.
Is the retained direct fee food revenue?
It is operator revenue, but it is excluded from the food-cost base. Food cost follows the food subtotal.
Does a fitted kitchen eliminate equipment spending?
No. Landlord infrastructure is excluded, but the operator funds appliances, refrigeration, packing equipment and tools.
Can the channel mix vary independently every month?
This version uses a common within-year fulfillment factor and annual channel assumptions. Independent monthly mixes require a different monthly expense interface.
What happens if delivered orders have zero recognized sales?
That combination is unsupported by the retained percentage-expense interface and exposes an error rather than silently removing real costs.
Does the high modeled cash return include the landlord’s investment?
No. Project cash measures cover the operator’s investment and deficits. They exclude host assets, unused financing reserves and owner distributions.
What if a purchased file is damaged or cannot be downloaded?
See the refund and replacement policy for file correction, replacement and download assistance. Keep the product name and your order reference when requesting help.
Which software does the workbook use?
The documented file is an Excel workbook (.xlsx). Compatibility with other spreadsheet applications is not established by the file extension.
Read the planning guides
Explore the relevant operating questions and how to interpret a workbook’s assumptions.
How much does a delivery order leave after channel costs?
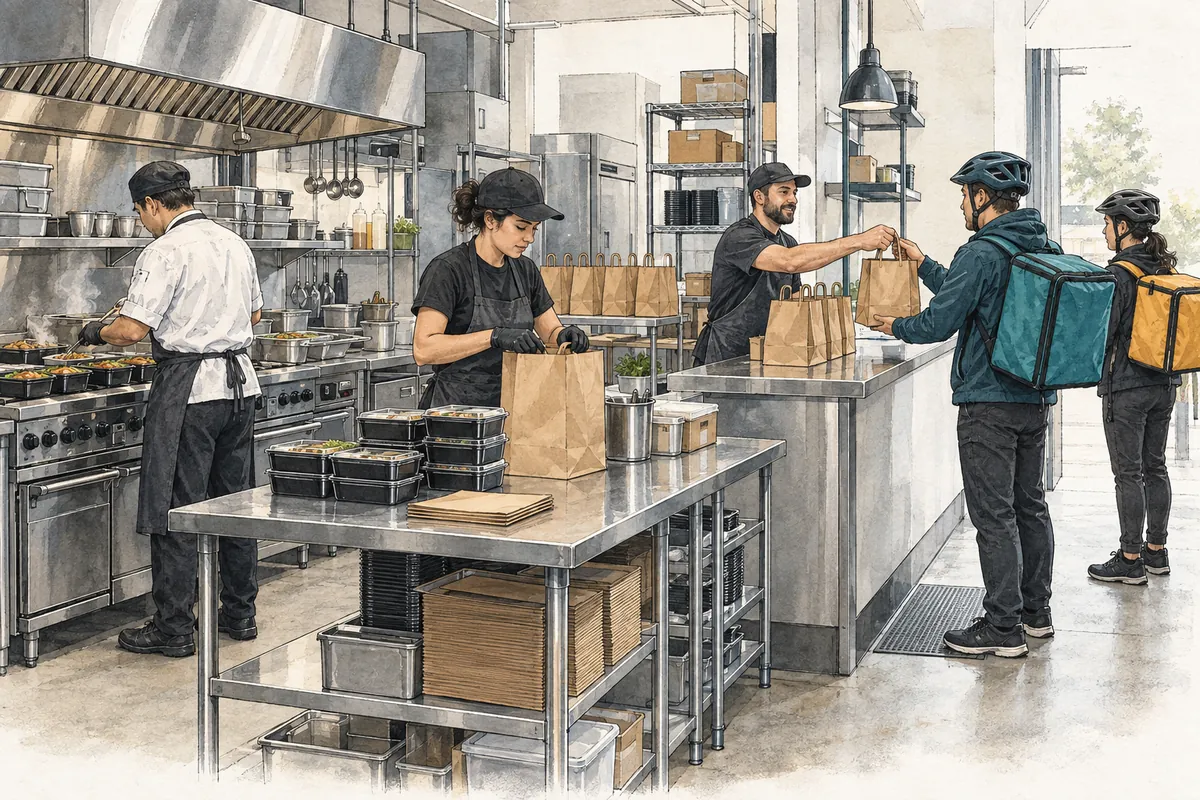
Compare marketplace and direct delivery orders using their own fee bases, then connect order contribution to shared kitchen, dispatch, and paid staffing limits.
Read the guide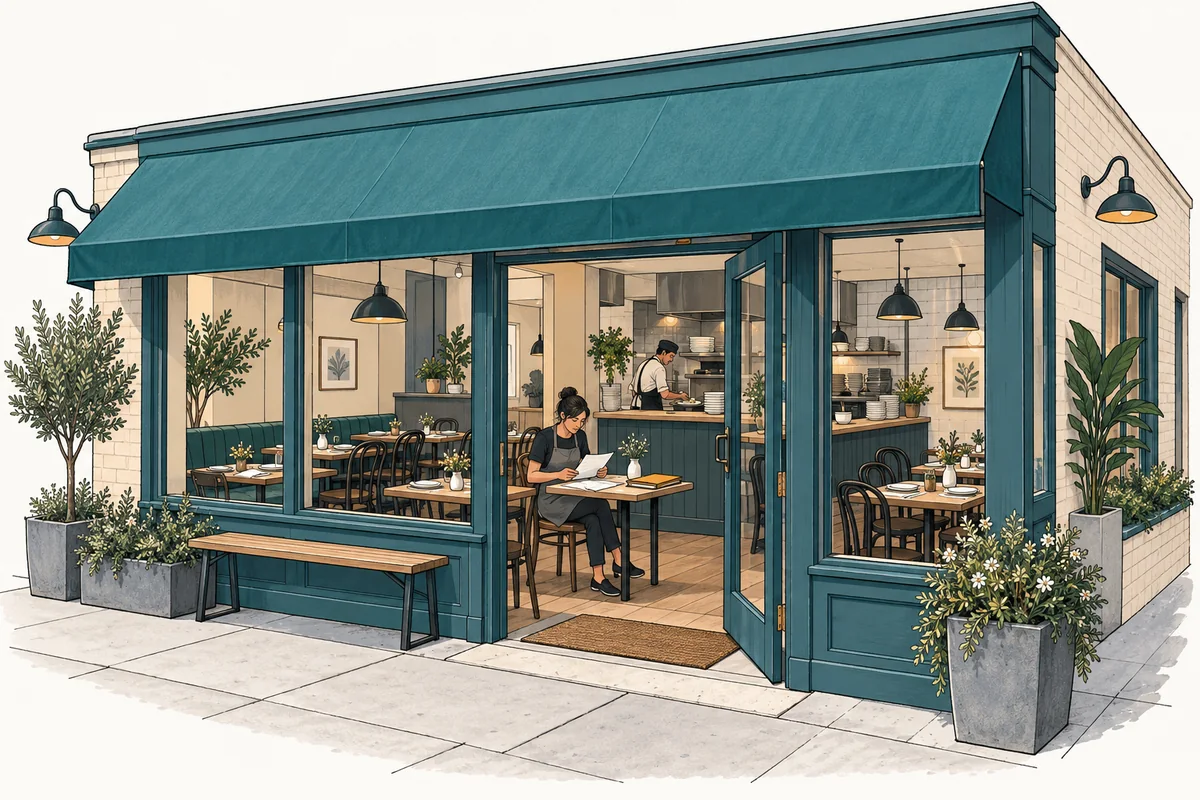
Which restaurant business idea fits the way you want to operate?
Choose among dine-in, pickup, delivery, catering, and a temporary residency by comparing the customer promise, operating work, and commitments each creates.
Read the guide
How to read financial assumptions before editing an Excel model
Follow the chain from operating assumptions to calculated results, check units and timing, and keep a useful record of changes to a financial workbook.
Read the guideEvidence and scope
A related category or operator is referenced. Do not interpret the link as independent proof of this exact configuration or its viability.
The links below provide operating-format context; they do not verify the workbook’s selected inputs or calculated returns.
The workbook guide and figures describe model PHY001-03, revision r01, for January 2027–December 2031. These are a documented planning case, not observed results for a particular business.