
Restaurant Financial Model: Fast-Casual Restaurant
Model made-to-order meals, customization time, shared preparation, assembly labor and startup funding for a 50-seat fast-casual restaurant.
- Excel (.xlsx)
- Forecast: 60 months / calendar years 2027–2031
- Starting footprint: 2,600 sq ft / 50 seats
- Service: 10 hours daily / seven days per week
- Opening: March 2027 / 60% initial demand
Planning several types? Compare 17 restaurant formats
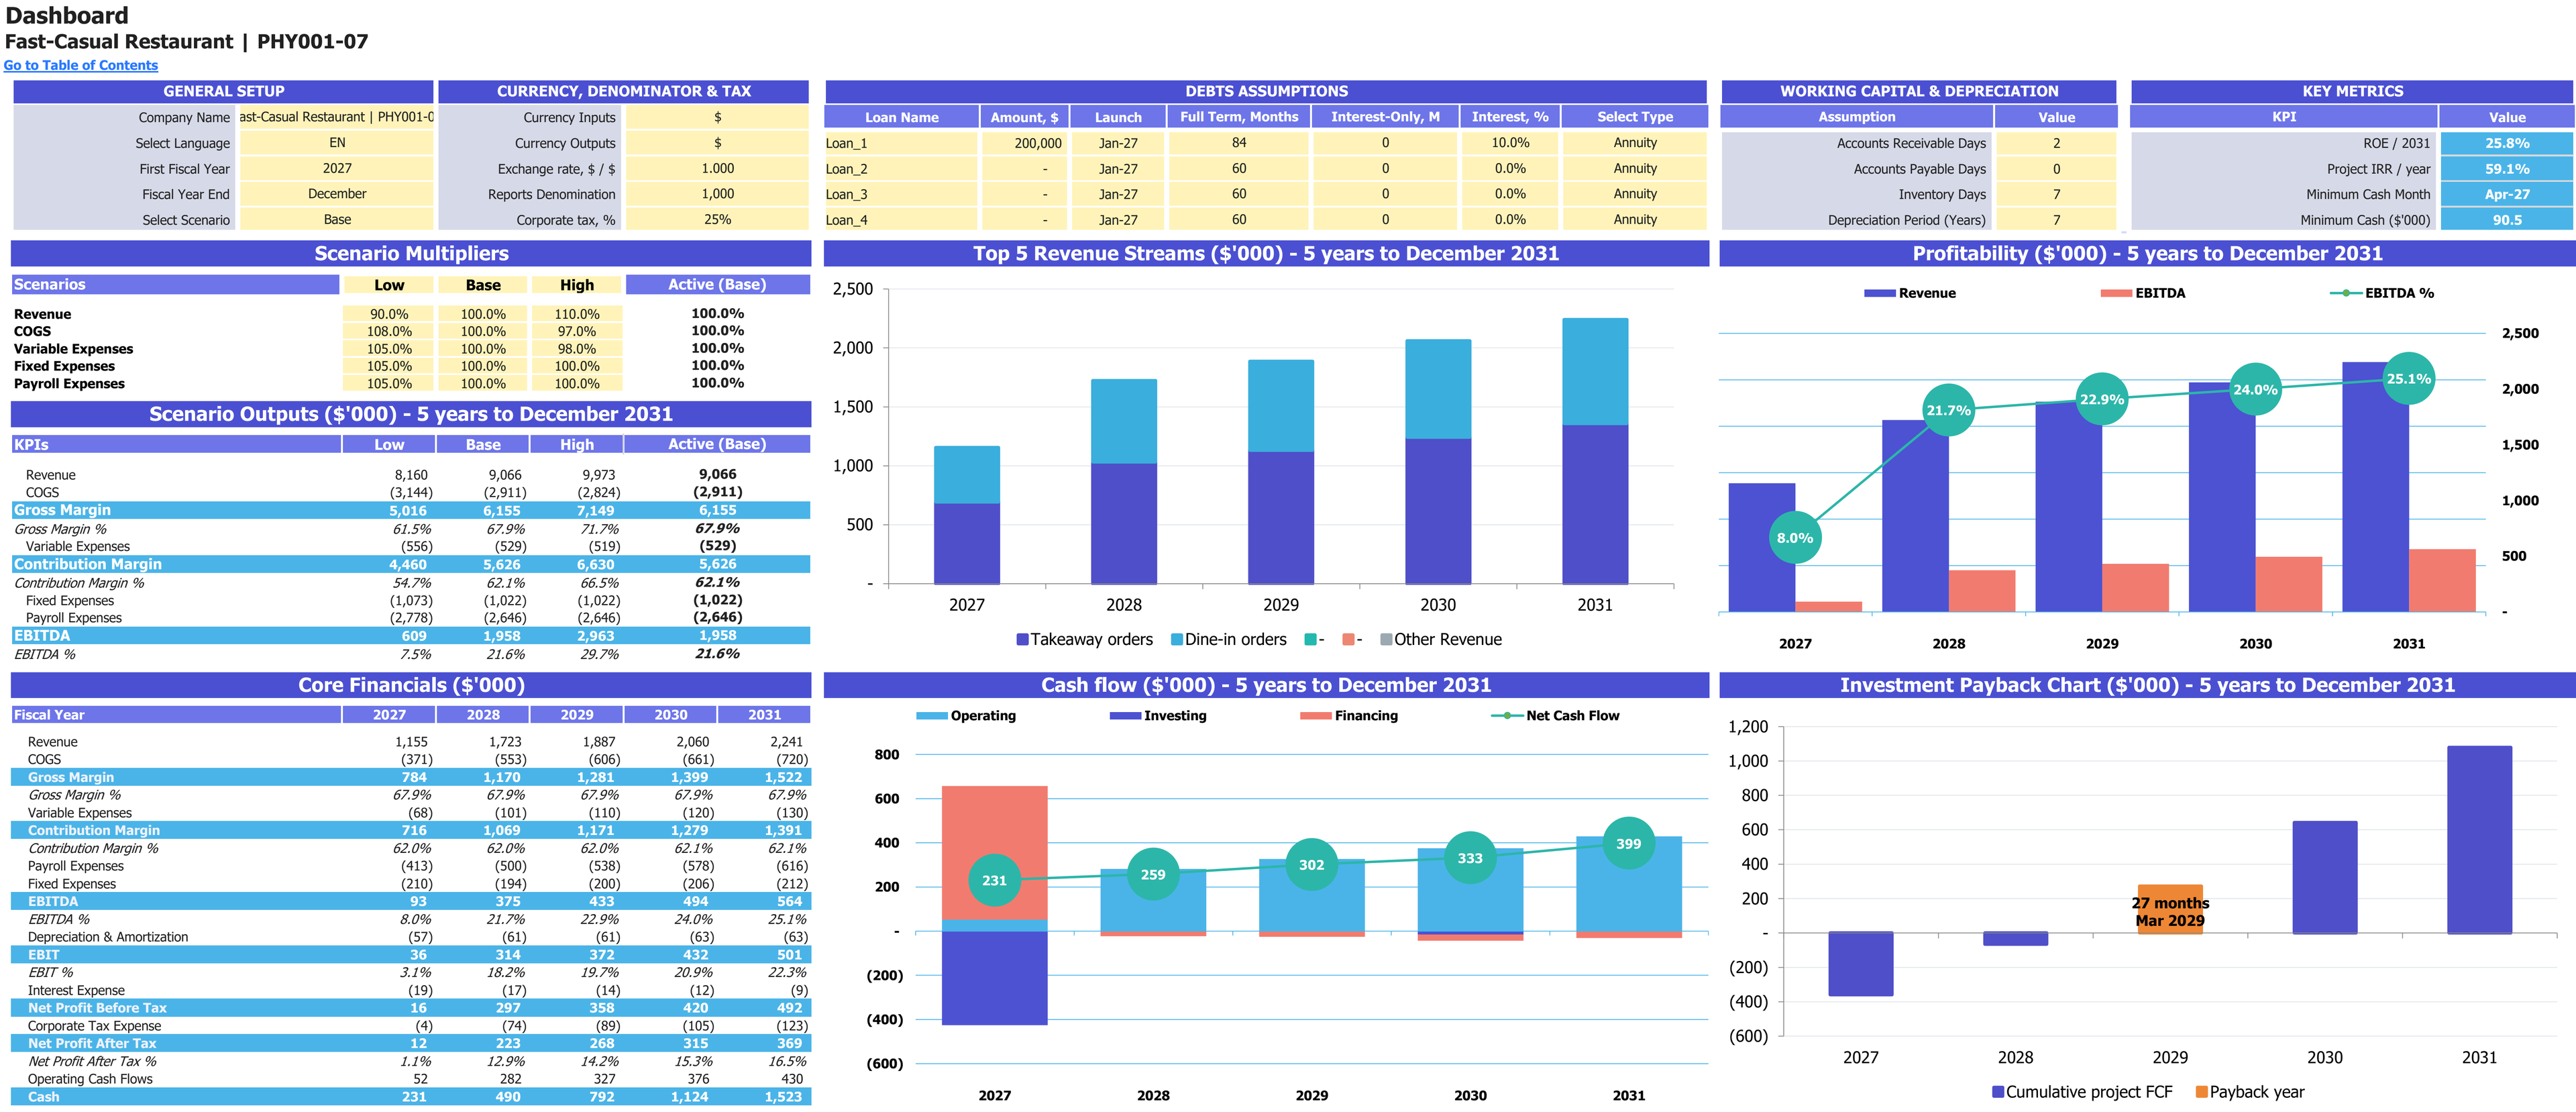
Base-case scenario controls, annual financial results and charts for 2027–2031. Financial report amounts are shown in thousands of USD; percentage measures retain their own units.
Enlarge image in a new tab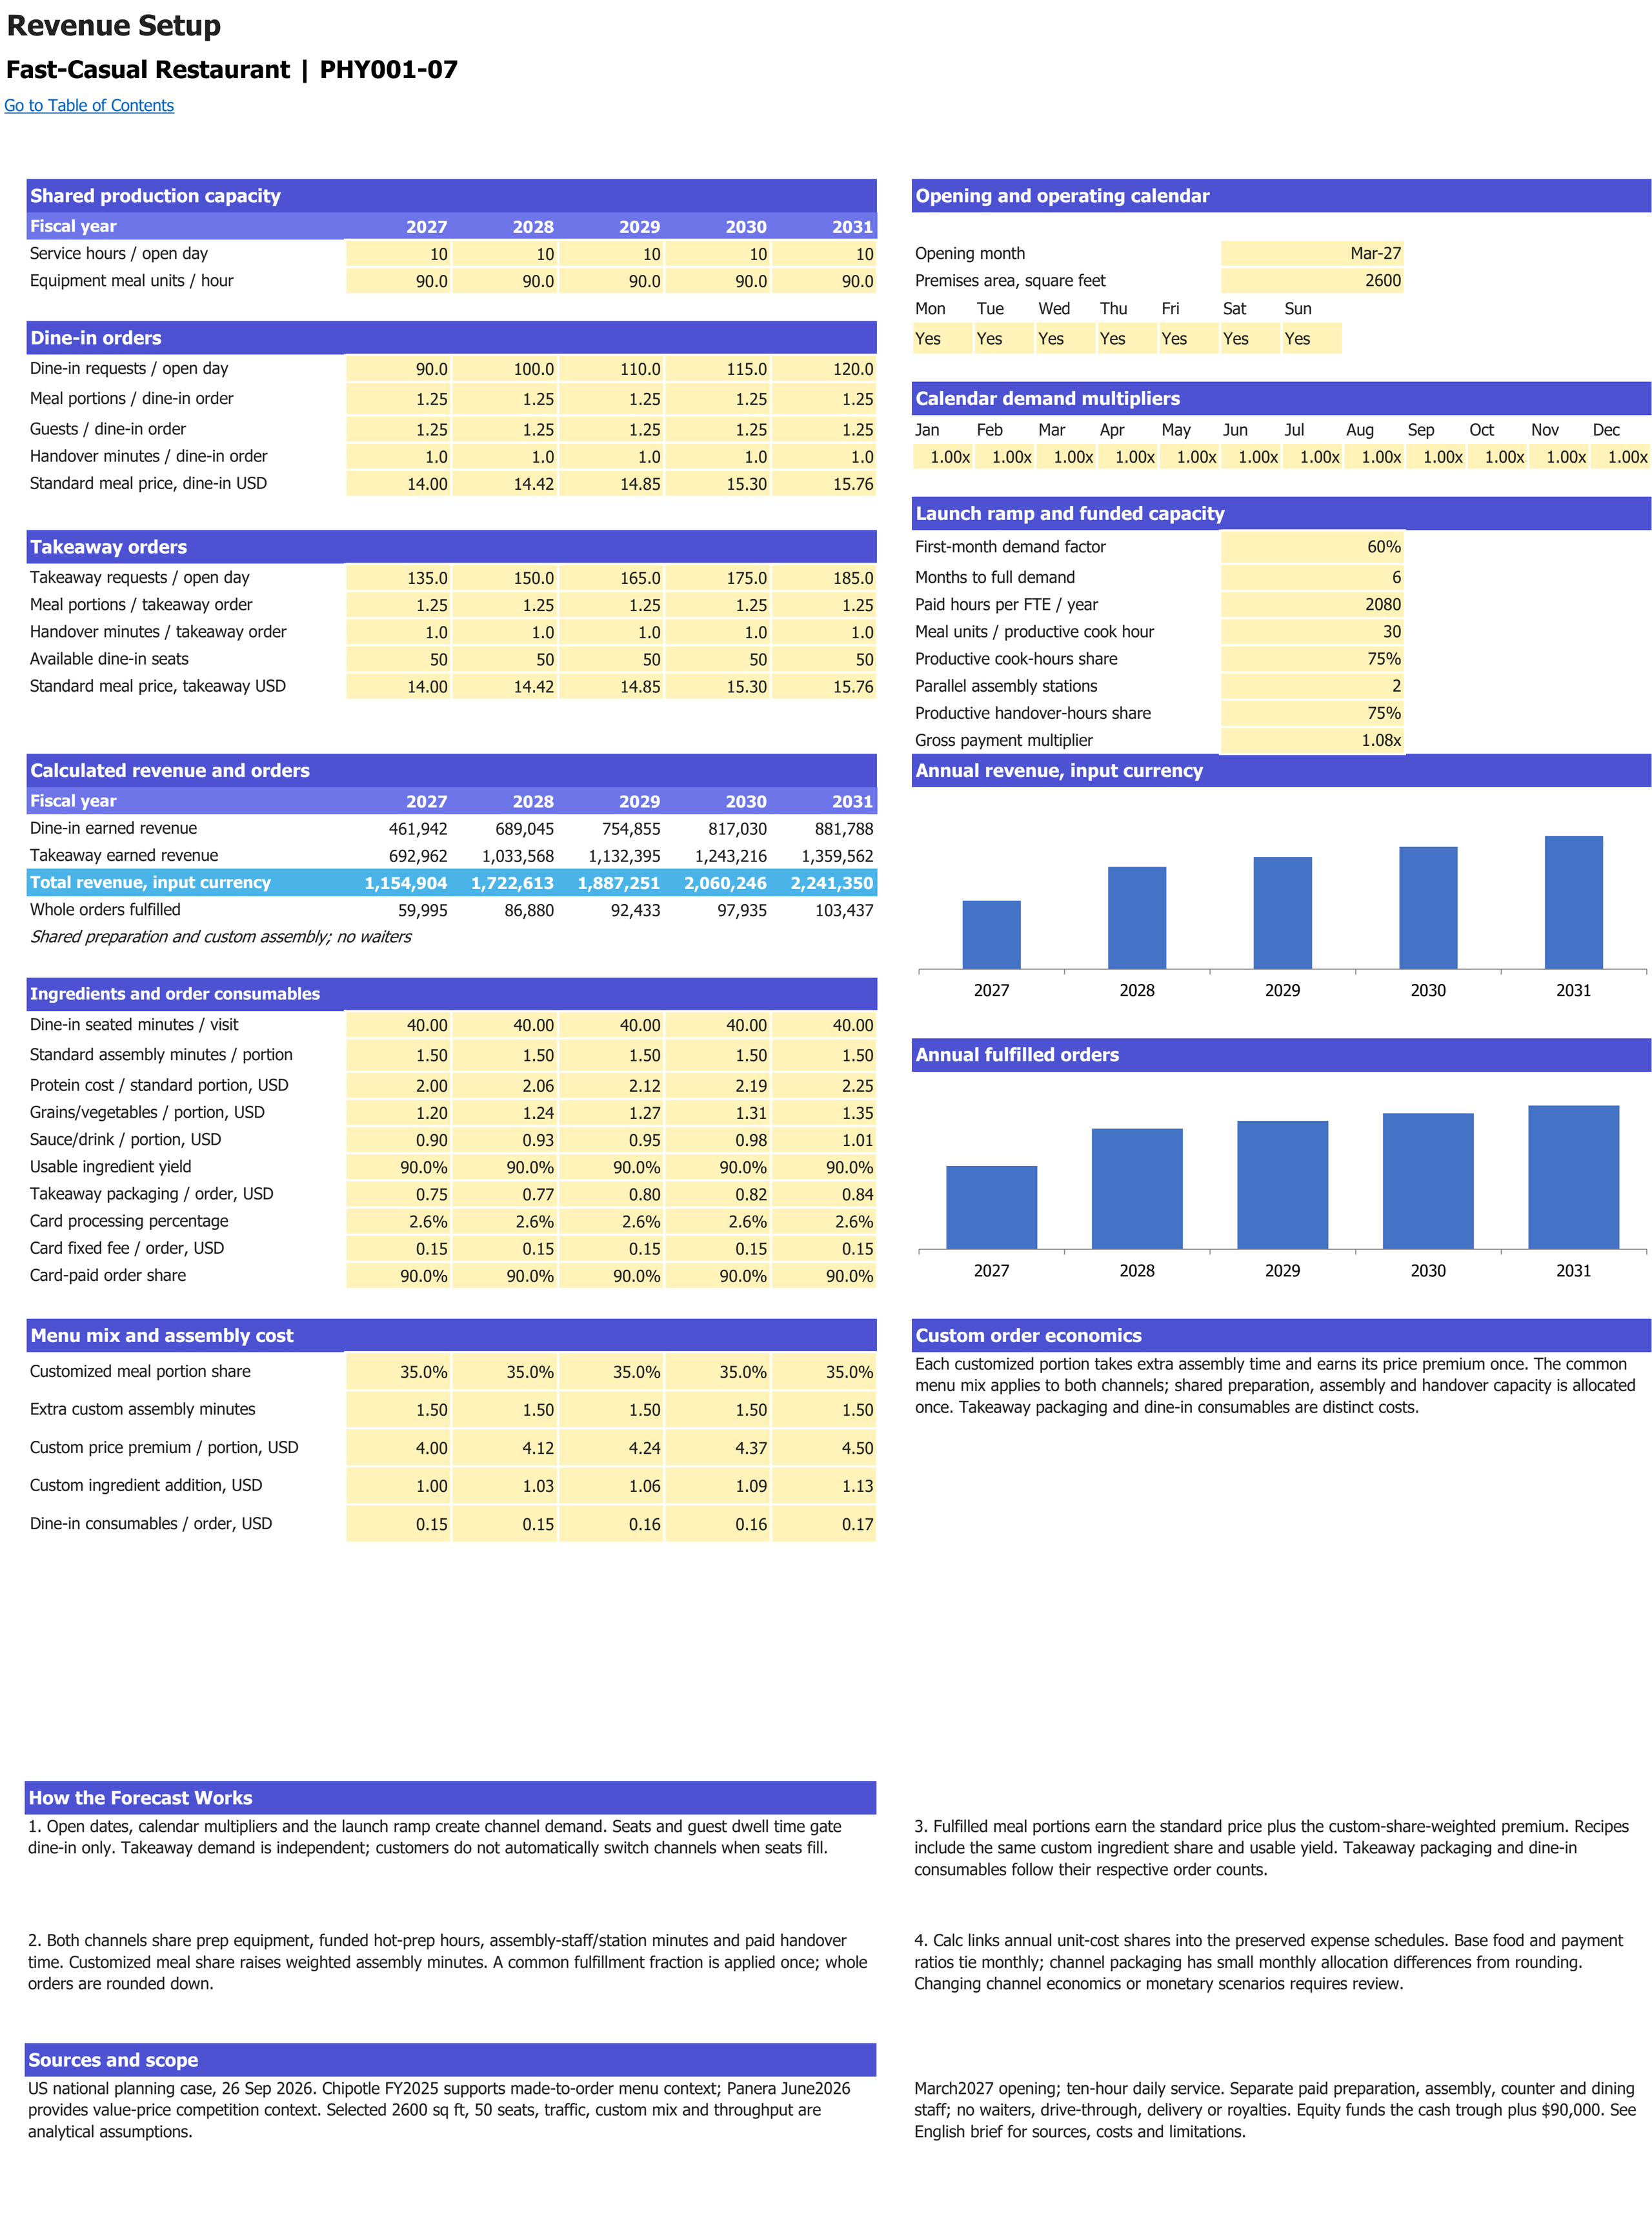
Standard and customized meal demand with preparation, assembly and handover constraints. Monetary inputs and sales use USD; operating volumes retain their labelled units. Forecast years are 2027–2031.
Enlarge image in a new tab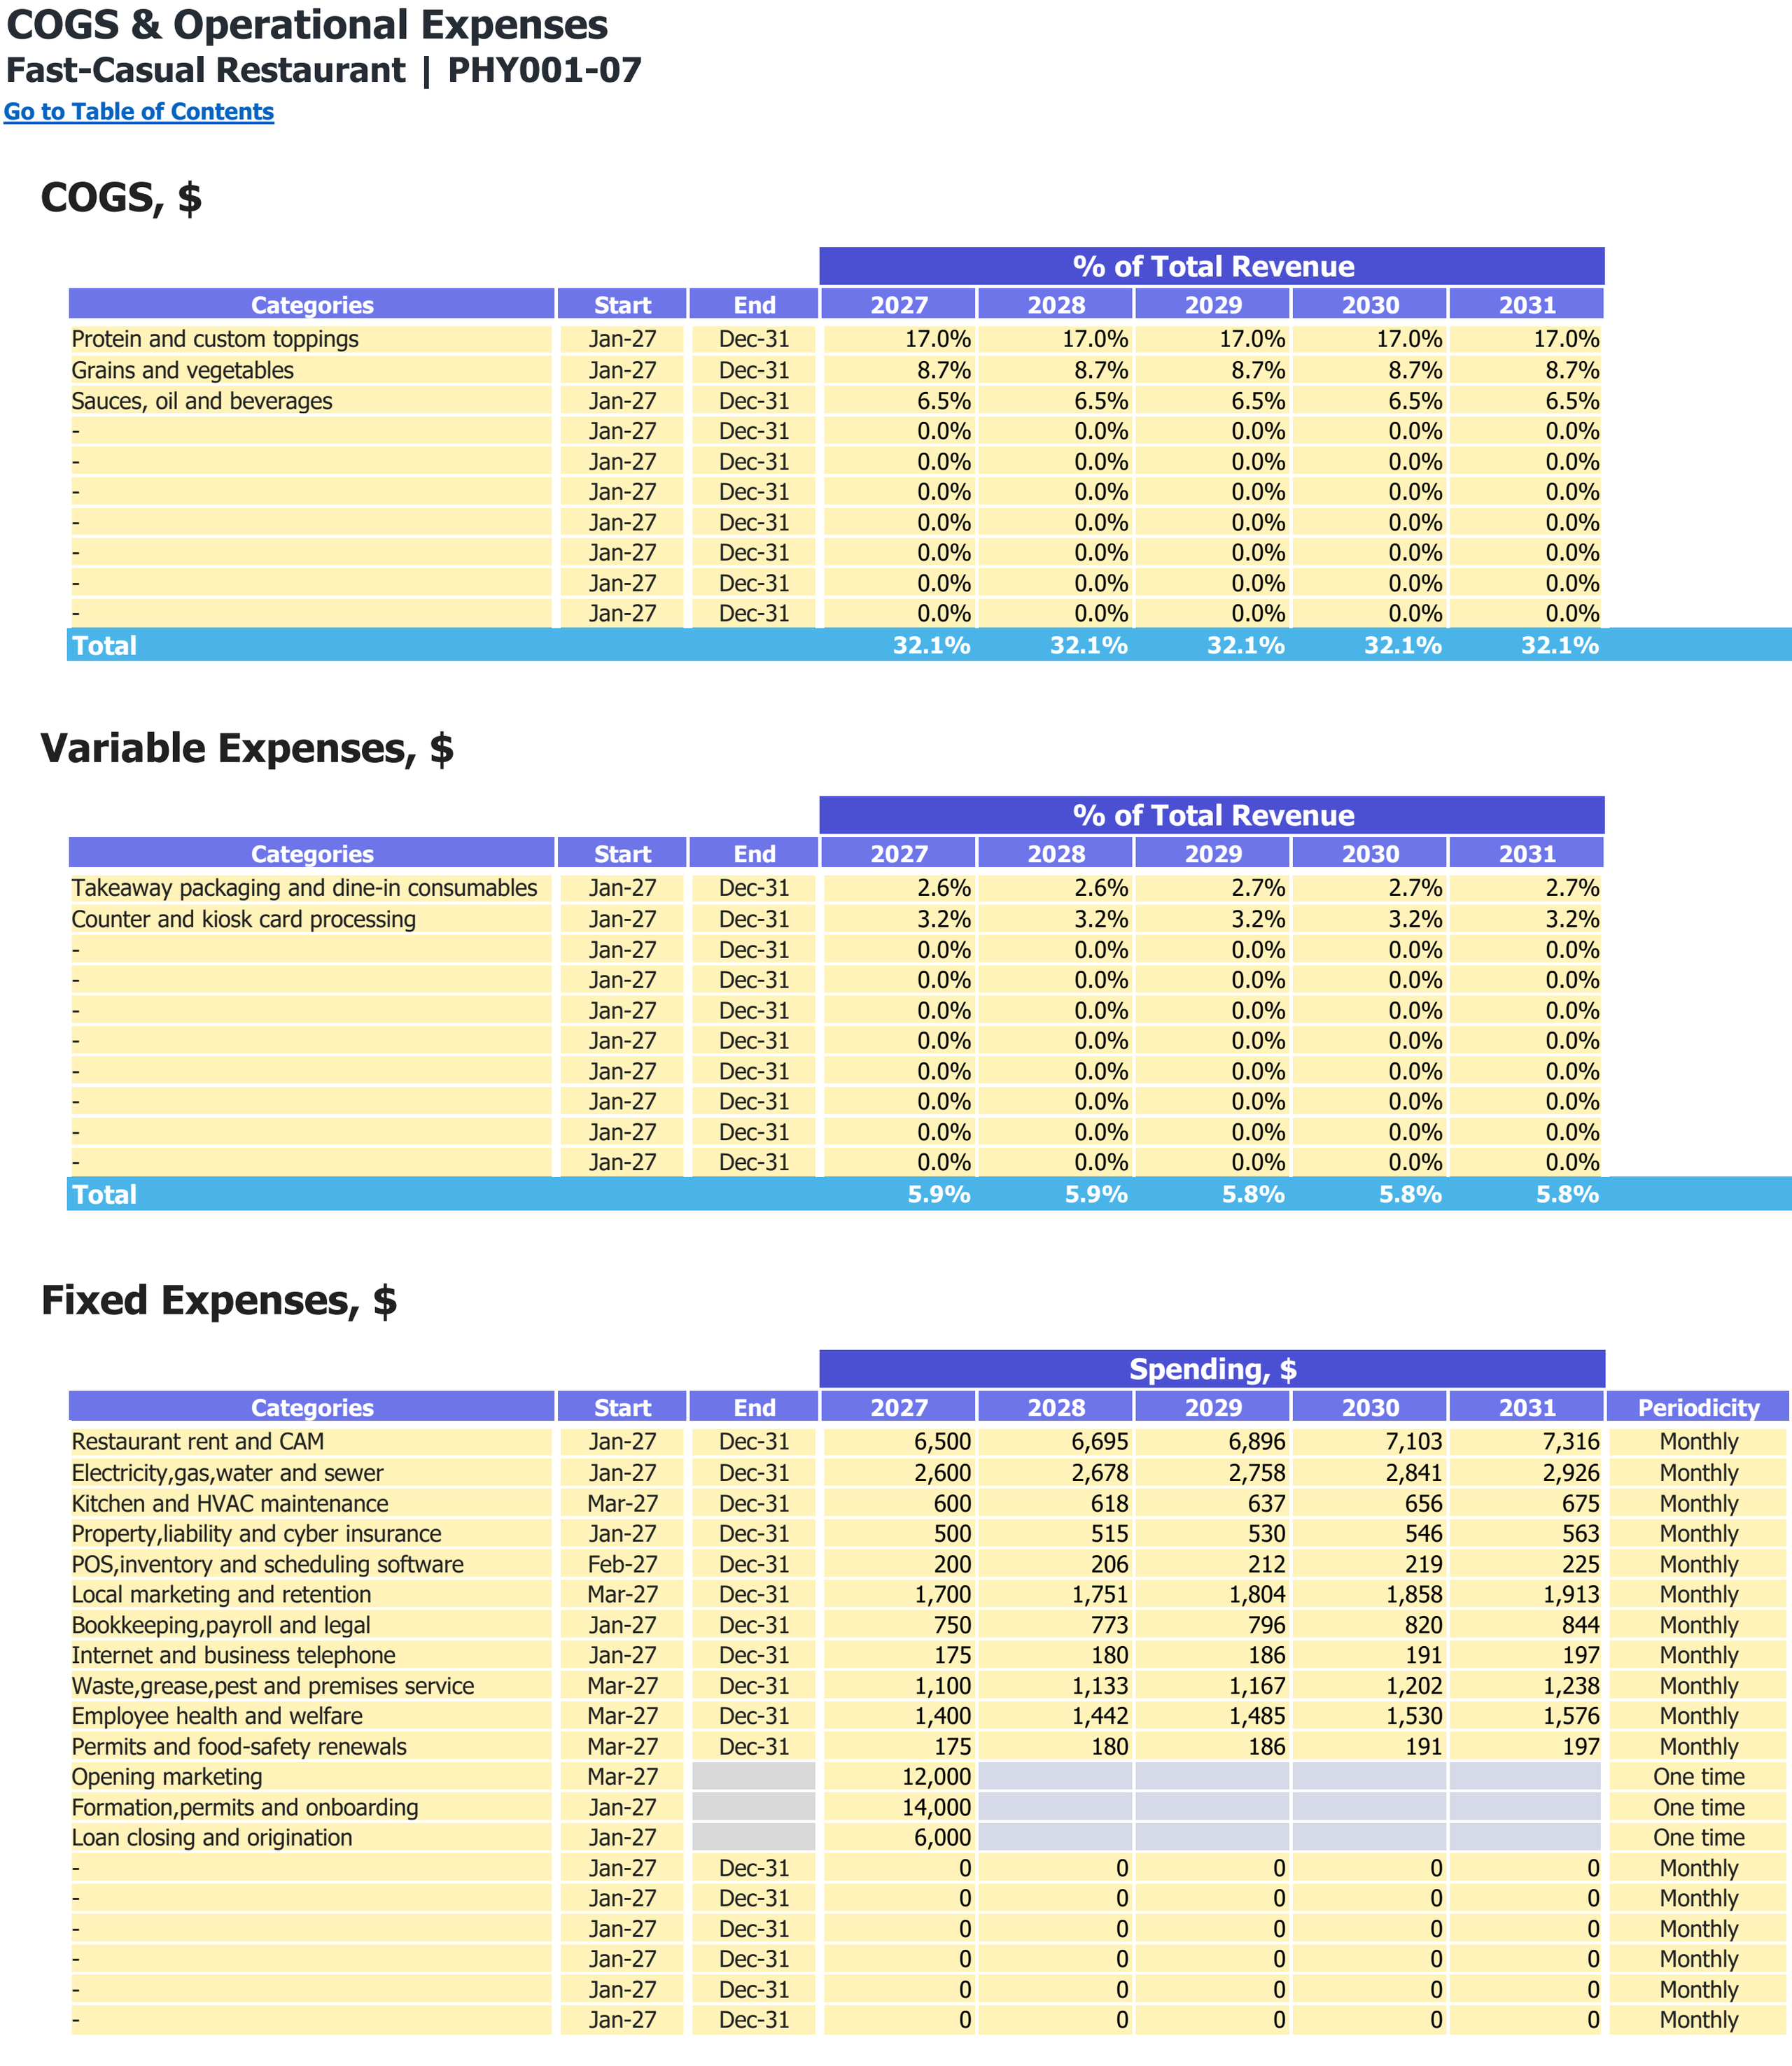
Food and other direct-cost categories, variable expense shares and fixed operating expenses. Monetary inputs are USD; the annual percentage columns are cost shares of revenue.
Enlarge image in a new tab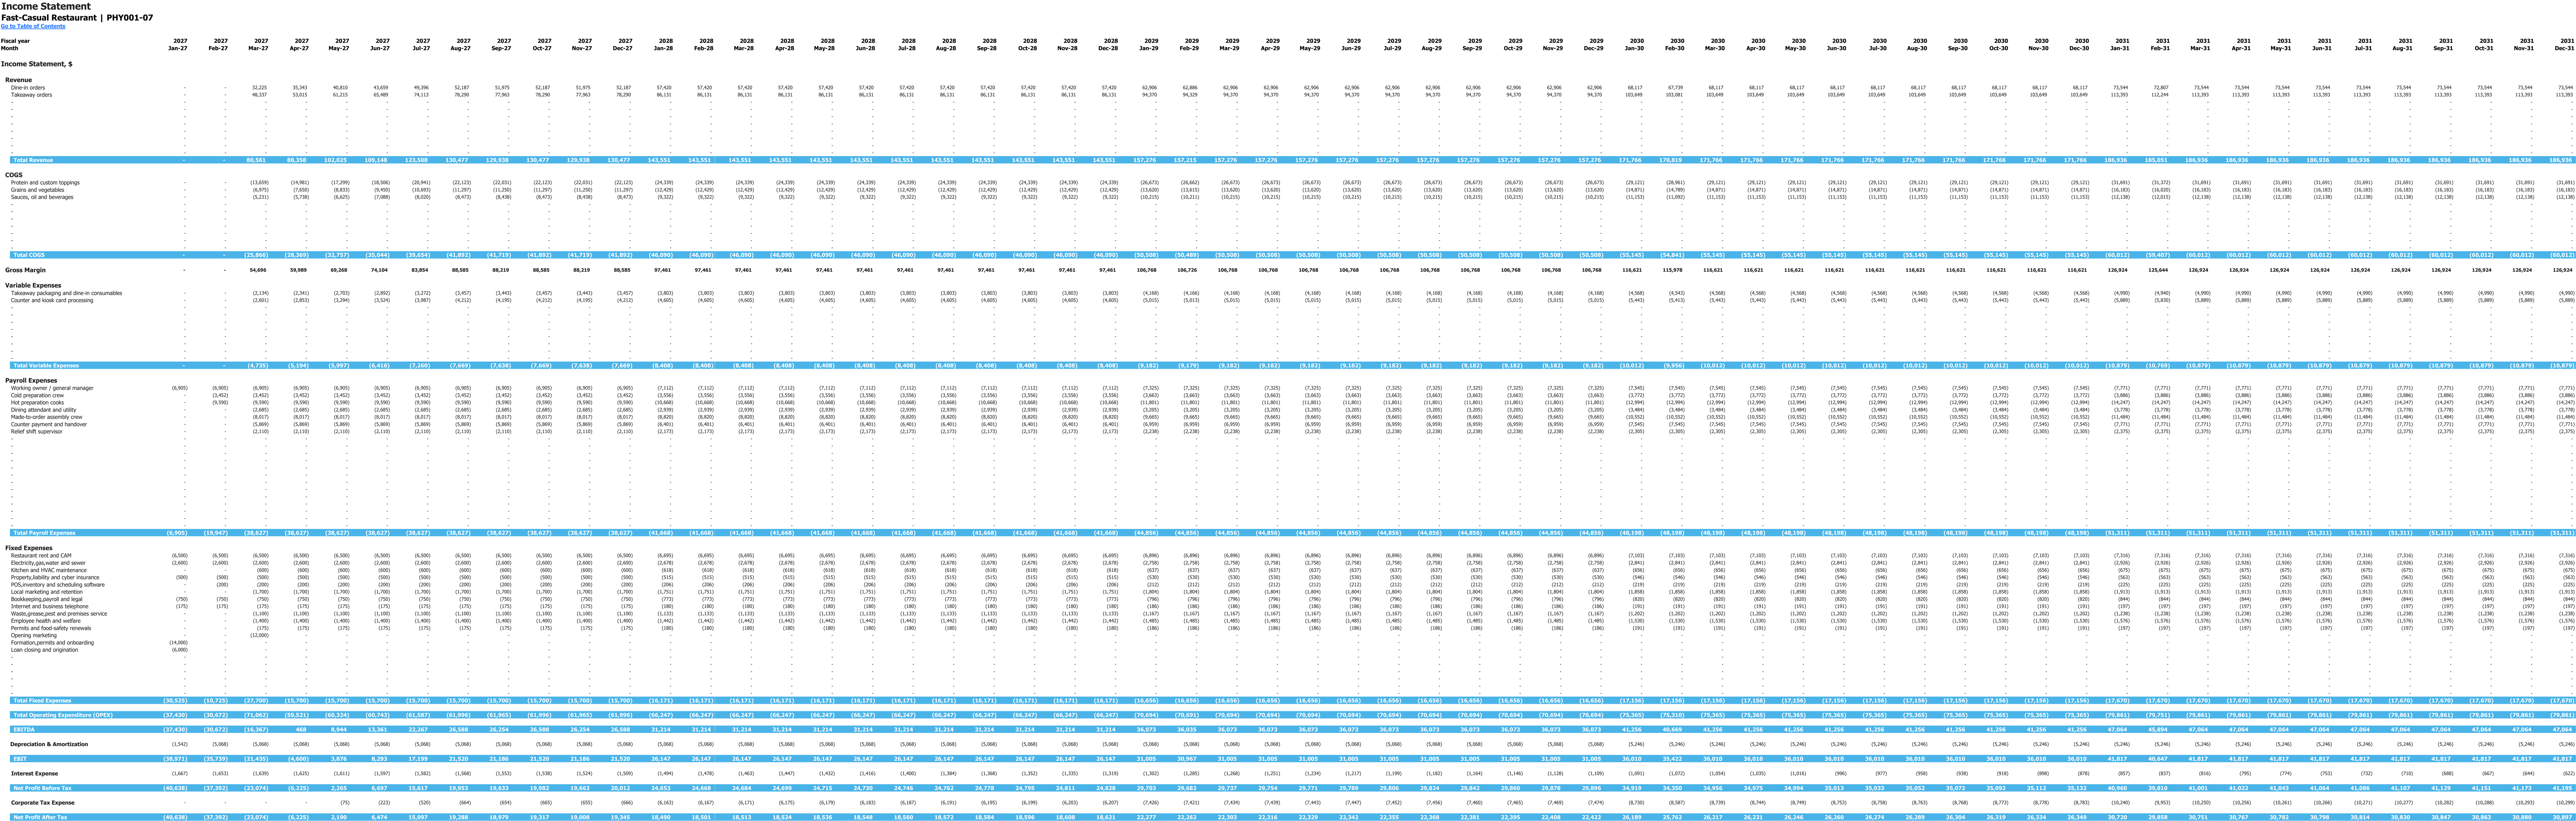
Monthly income statement for 2027–2031, in USD. This is an income statement view; it does not show payroll setup inputs. Enlarge to inspect the wide monthly table.
Enlarge image in a new tab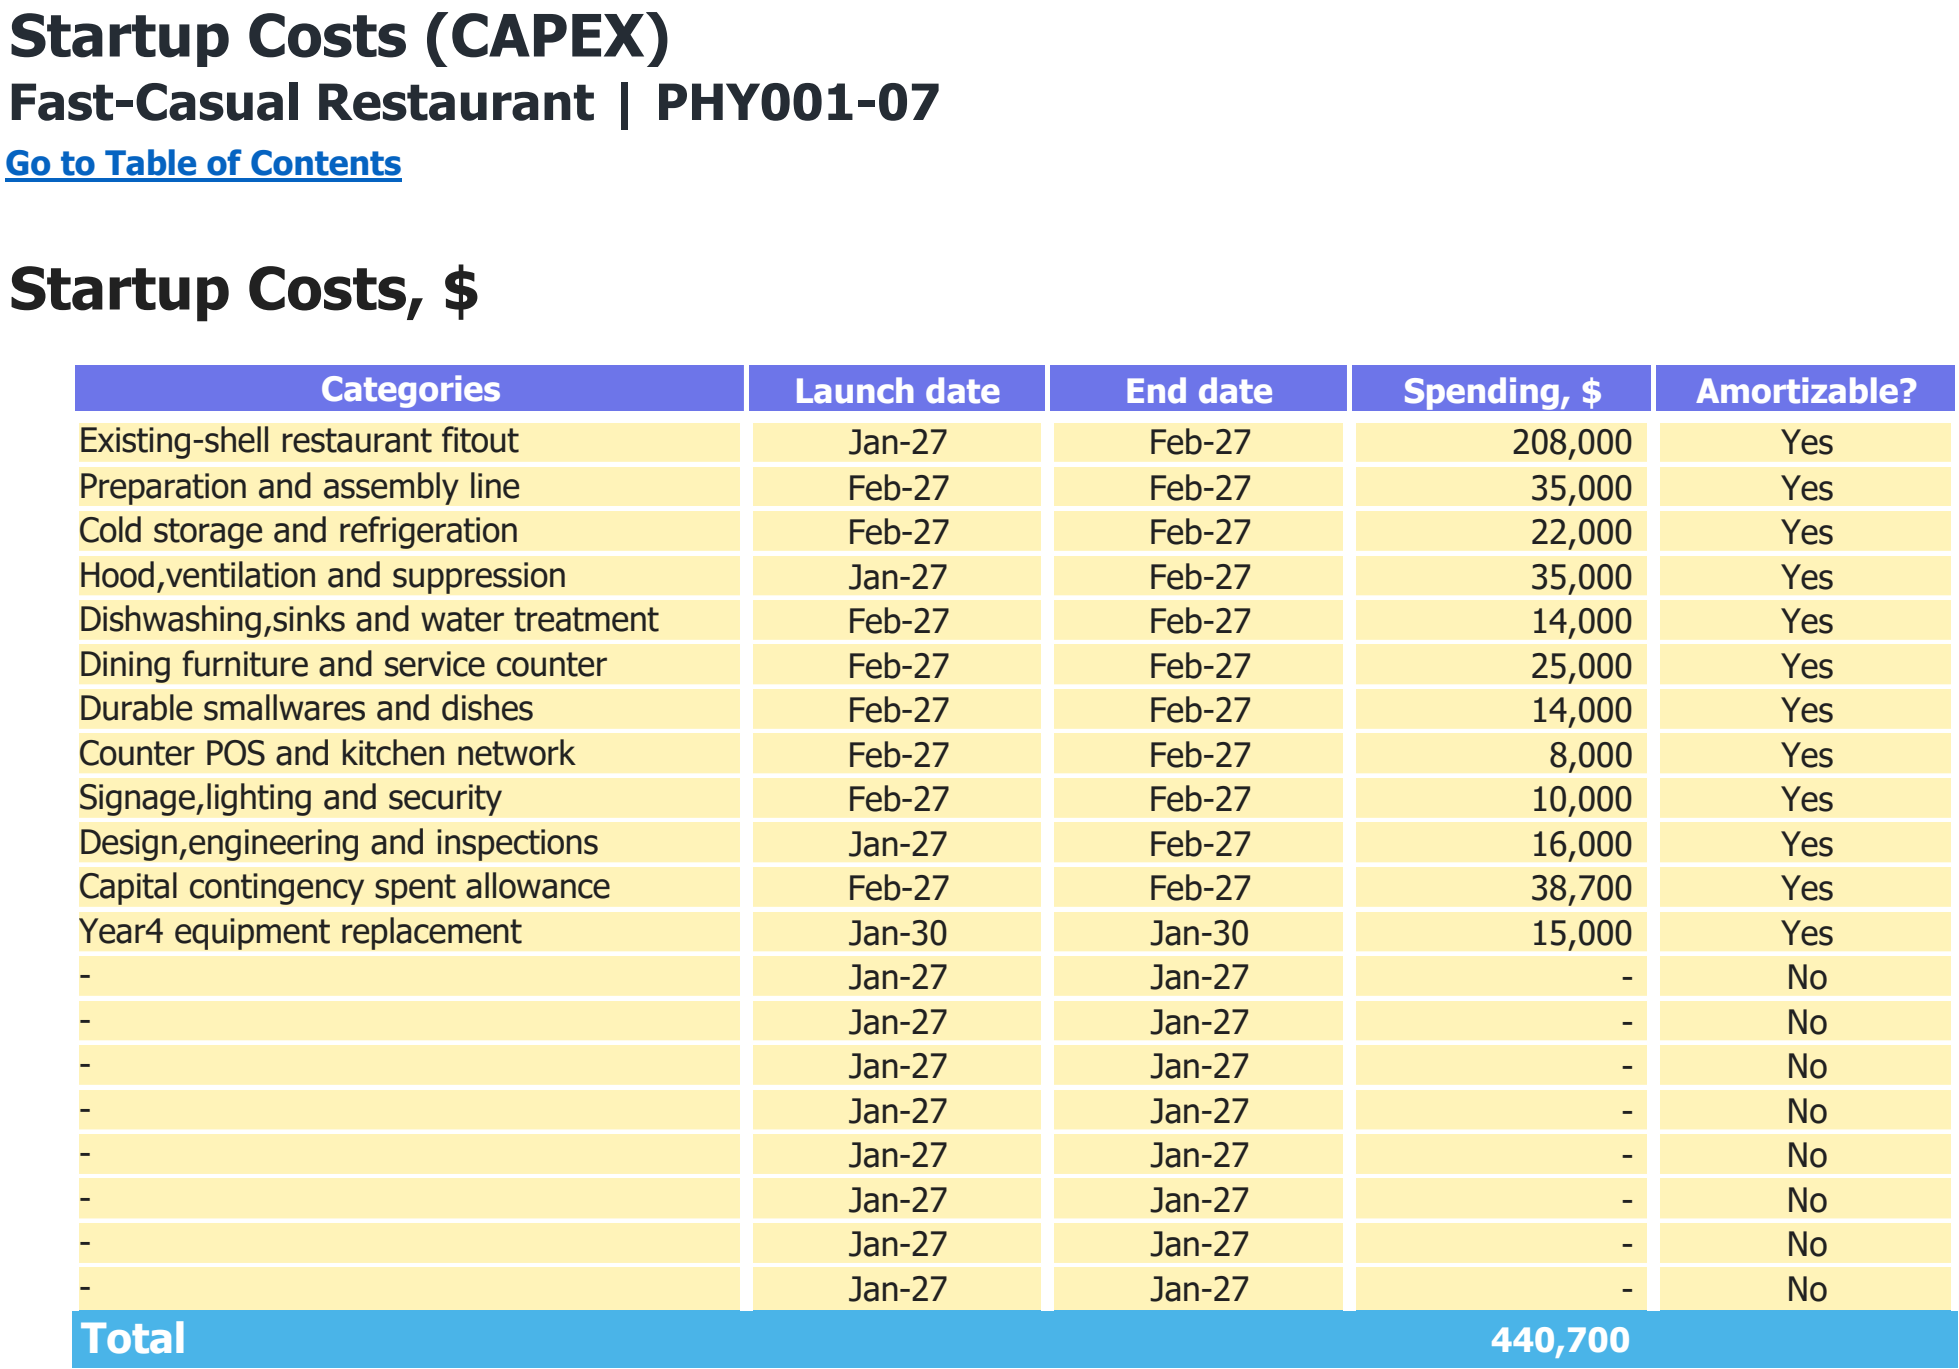
Asset categories, purchase dates and spending assumptions in USD. The total includes every scheduled purchase shown, including later replacements where present.
Enlarge image in a new tab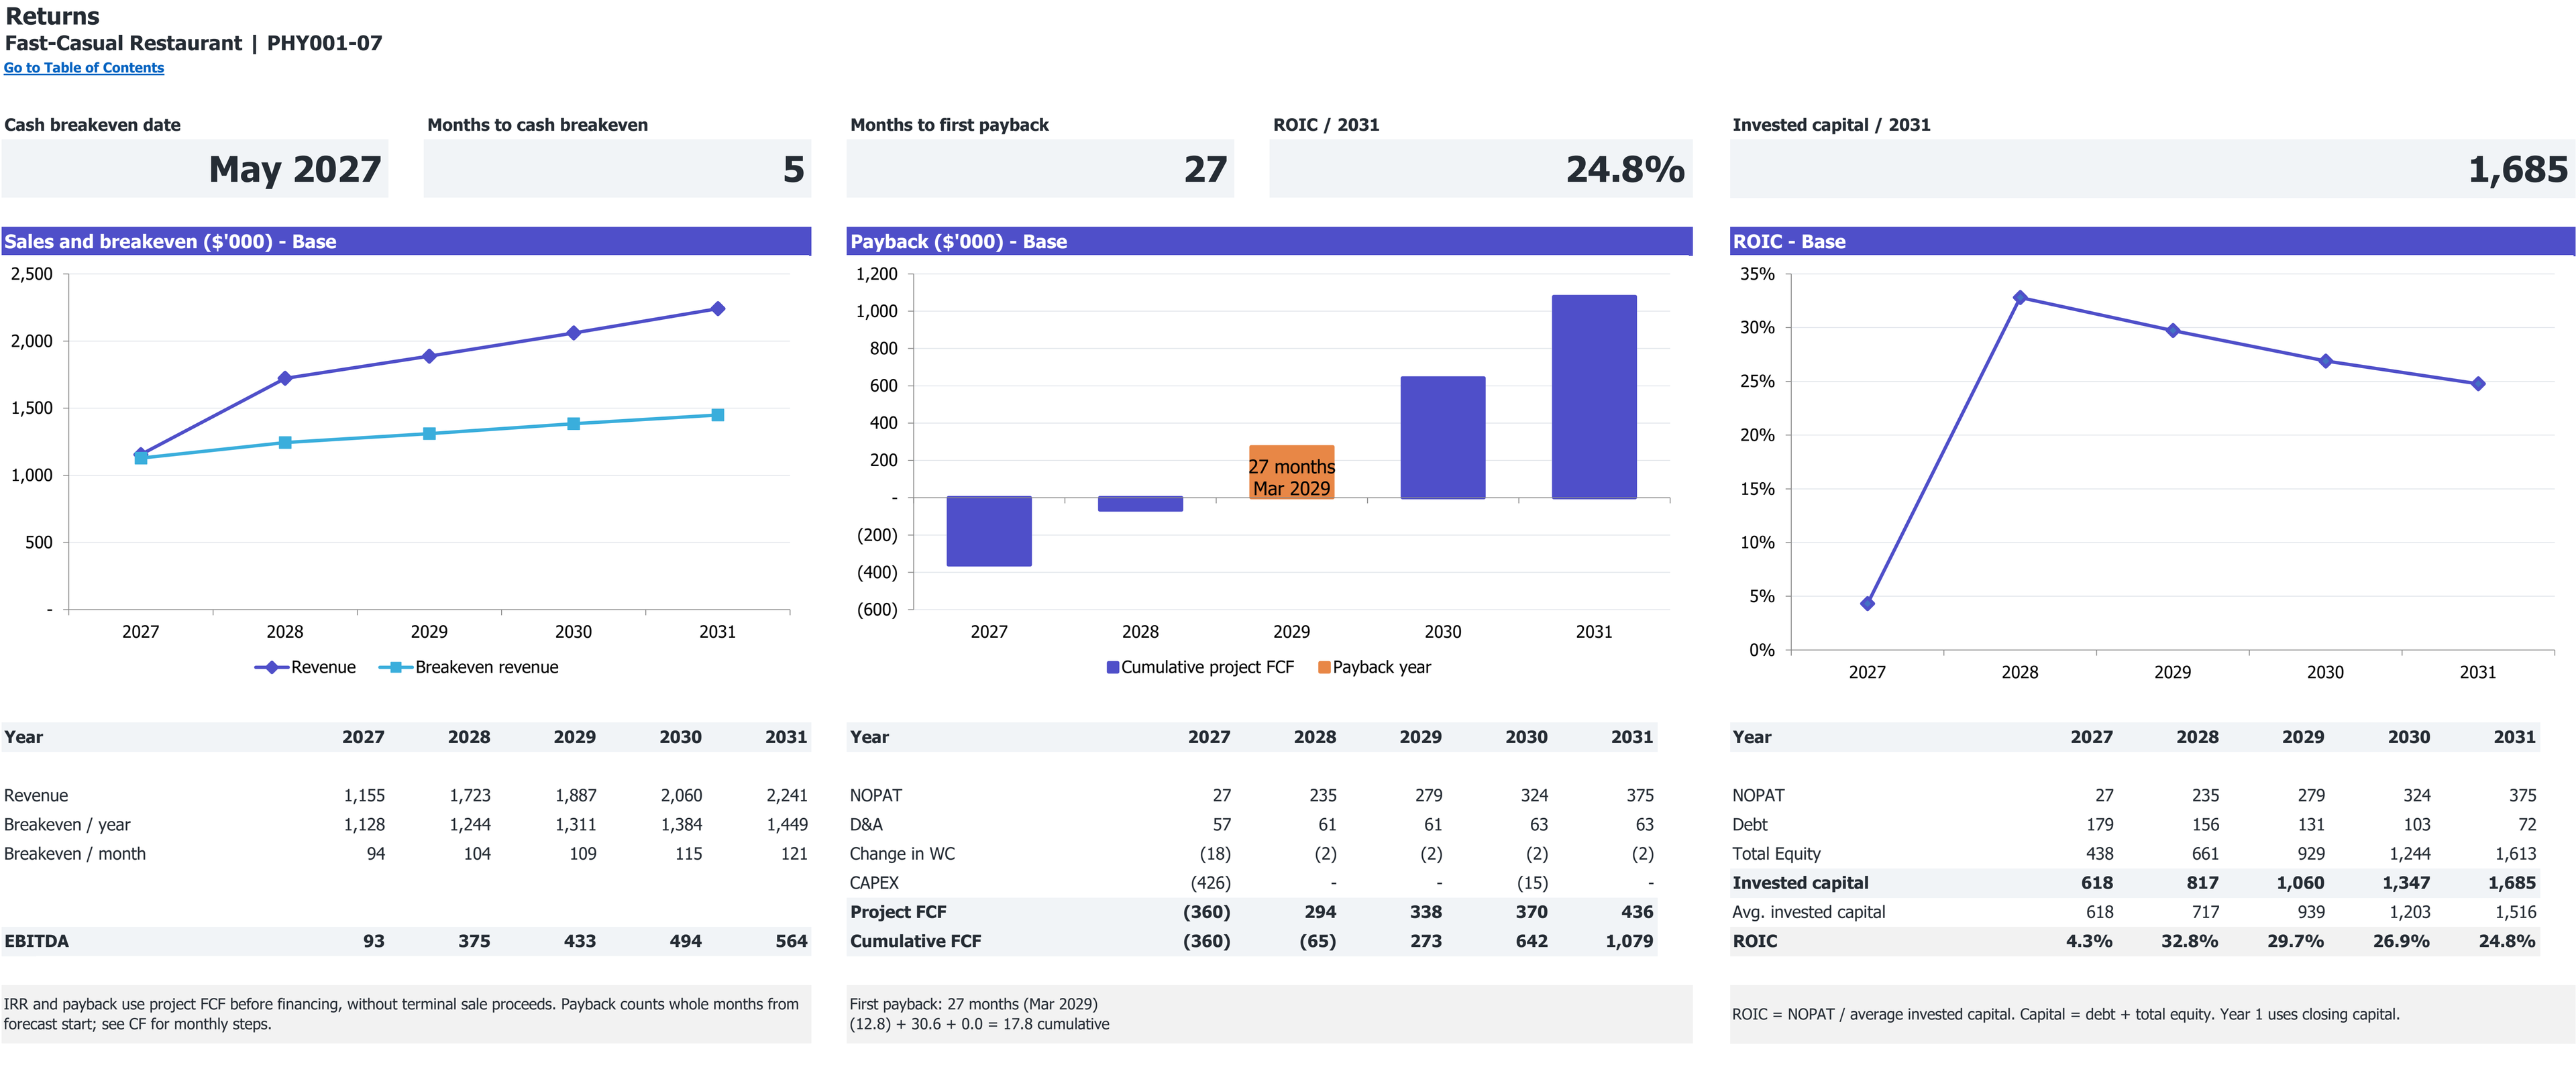
Excerpt from Returns: cumulative project free cash flow and first payback, if reached. 2027–2031 base case; dollar amounts in thousands.
Open full Returns view in a new tabExcerpt from Returns: revenue, annual and monthly break-even revenue, and EBITDA. 2027–2031 base case; dollar amounts in thousands.
Open full Returns view in a new tab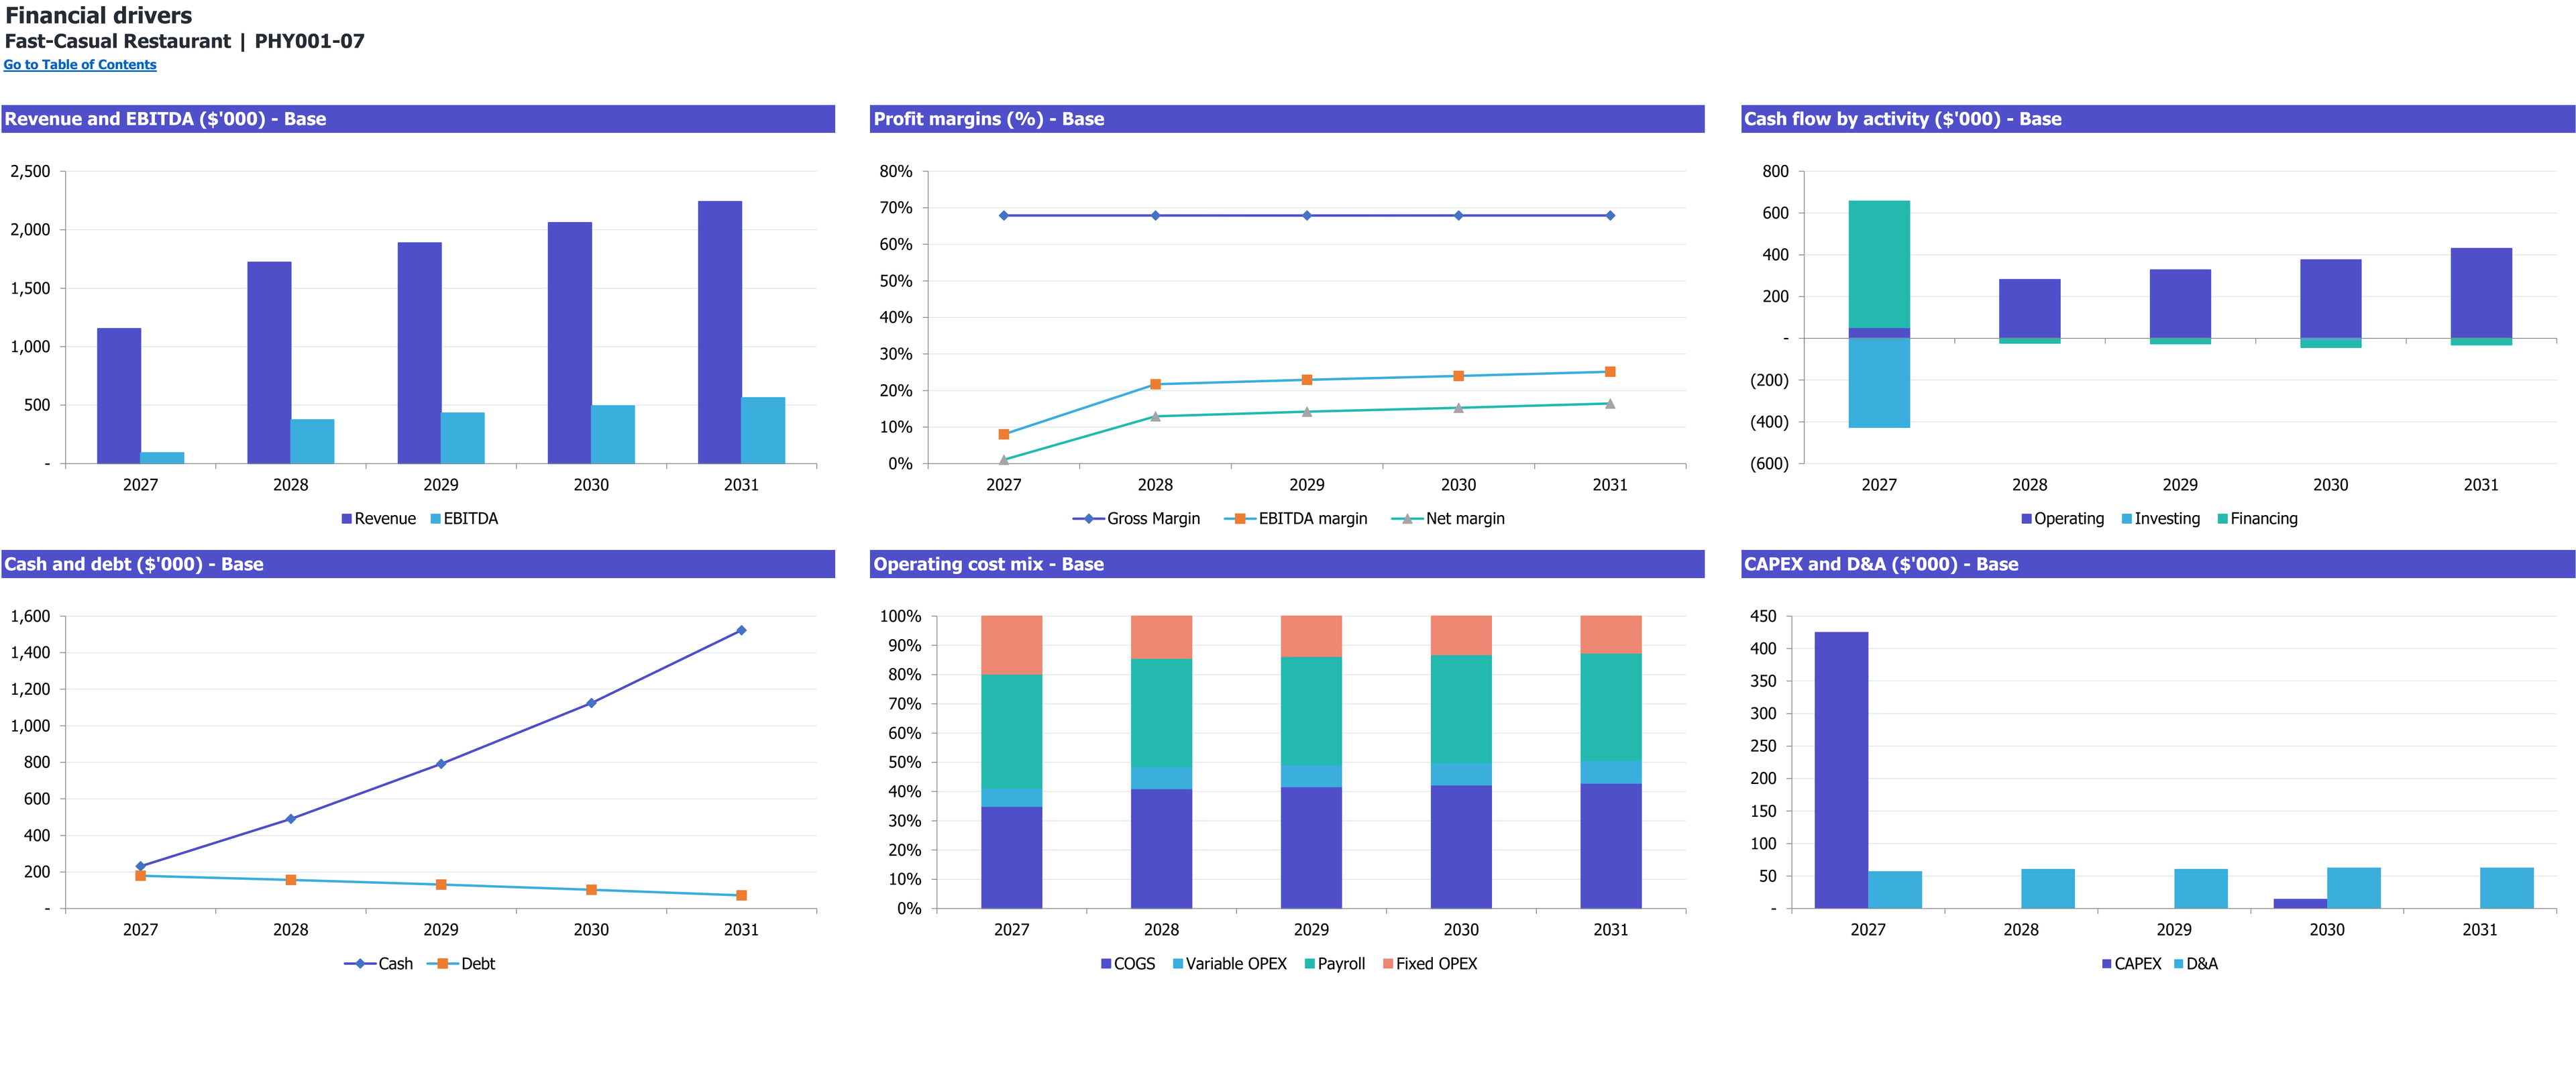
Six annual financial-driver charts for Fast-Casual Restaurant, 2027–2031 (Base scenario). Dollar amounts are in thousands; margins and cost mix are percentages.
Enlarge image in a new tab8 selected worksheet views. Figures show this workbook’s starting case.
Workbook availability
What is inside the Excel model
Connect custom-meal pricing to preparation, assembly time and paid handover capacity. This fast-casual restaurant case follows dine-in and takeaway orders through recipe purchases, staffing and five-year cash flow.
Selected worksheets from the documented workbook. Forecast period: January 2027–December 2031. Model reference: PHY001-07.
Inputs you control. Results you can inspect.
On a small screen, scroll within the table to read every column.
| Planning area | Inputs you review | How they connect | Results to inspect |
|---|---|---|---|
| Channel demand | 90 dine-in and 135 takeaway mature daily requests; six-month ramp. | Open dates, demand factors and channel seating eligibility create requests. | Eligible dine-in and takeaway orders. |
| Menu customization | $14 standard portion; 35% custom share; $4 premium. | Weighted price and 1.25 portions per order determine the check. | Initial $19.25 net order value. |
| Assembly resources | Two stations; 1.5 standard plus 1.5 extra custom minutes. | Weighted work consumes separately funded assembly minutes. | Capacity after preparation, assembly and handover limits. |
| Food and supplies | $4.10 standard ingredients; $1 custom addition; 90% yield. | Portion mix drives food; each channel has its own order consumables. | Ingredient purchases and transaction costs. |
| Labor and premises | 9.7 initial FTE; 10.65% employer load; $6,500 monthly rent/CAM. | Role start dates fund capacity and operating expense. | Paid labor, overhead and operating margins. |
| Investment and financing | $425,700 initial CAPEX; $426,000 equity; $200,000 loan. | Monthly cash incorporates spending, settlement, debt and startup losses. | Liquidity, cash reserve and project recovery. |
Is this the right model for your business?
Check the starting case before changing the assumptions.
The starting operation
- An independent made-to-order restaurant with dine-in and takeaway orders using the same preparation kitchen.
- An operator comparing custom-ingredient premiums with assembly time and ingredient additions.
- A founder planning 50 seats, two assembly stations and a separate payment/handover counter.
Check the boundary
The starting operation excludes drive-through, delivery, waiter service, alcohol and franchise royalties.
Compare the other restaurant typesHow this business makes money
Connect the unit sold to the resources required by this operating case.
Revenue logic
Fulfilled dine-in and takeaway orders earn the weighted standard-and-custom meal price.
Customization raises the price and ingredient cost while adding assembly work; it is not a second sale.
Can more custom orders increase revenue and reduce throughput at the same time?
Yes, within this design. A custom portion adds a price premium and ingredients, but also consumes extra assembly time. If assembly becomes the binding constraint, the restaurant can earn more per order while fulfilling fewer orders. Preparation and handover must still support that mix, so a price-only change cannot answer the operating question.
- Custom mix
- 35% of portions initially
- Assembly workload
- 2.025 weighted minutes per portion
- Resource separation
- Preparation, assembly and handover have distinct paid budgets
What to establish for your own operation
- Time standard and custom orders separately, including reset and handover work.
- Test custom share, premium and ingredient addition together.
- Check whether an added station also has funded assembly labor and enough upstream preparation.
Follow the plan from demand to cash
Open each section for the assumptions, calculations, and limits of this workbook’s starting case.
Make customization part of both price and capacityRevenue
A standard $14 portion represents an $11 bowl and $3 beverage. With 35% of portions customized at a $4 premium, the weighted portion price is $15.40 and the 1.25-portion order is $19.25. Customization is part of that sale, not another transaction.
Each portion needs 1.5 standard assembly minutes plus the custom share times 1.5 extra minutes: 2.025 minutes initially. Preparation, two staffed assembly stations and a one-counter handover limit all apply to eligible demand. Dine-in also needs seating, using a 40-minute visit and 1.25 guests per order. Takeaway bypasses seats.
- Installed preparation is 90 portions per hour, also limited by productive hot-preparation cooks.
- Assembly and handover use their own paid crews; the same minutes are not spent twice.
- A common fulfillment fraction is rounded down by channel. Monthly averages do not model peak queues.
Price the custom recipe and its separate assembly crewPayroll
Initial purchased food is ($2 protein + $1.20 grains/vegetables + $0.90 sauces/drinks + 35% × $1 custom additions) divided by 90% yield, or approximately $4.94444 per portion. That produces a modeled 32.11% food-to-sales ratio. The recipe determines cost; an industry benchmark does not set it.
The team starts at 9.7 FTE and reaches 11.6. Initial roles include 2.5 hot-preparation cooks, 2.2 assembly staff and 1.7 counter/handover FTE, alongside paid management and support. The $74,880 owner salary begins in January. A 10.65% employer load and separate $1,400 monthly welfare pool are included.
- Takeaway packaging starts at $0.75/order; dine-in consumables at $0.15/order.
- Recurring salaries and expenses rise 3% annually; rent/CAM starts at $6,500/month.
- Annual expense shares reconcile annual unit costs; changing channel economics can affect monthly allocation accuracy.
Budget the assembly layout and the opening cash troughCAPEX
The $425,700 initial asset budget includes $387,000 base capital and $38,700 spent contingency. The reused-shell fitout is $208,000. Preparation/assembly, ventilation, refrigeration, warewashing, dining fixtures and counter systems have separate allowances. January 2030 adds $15,000 replacement capital. These budgets need installed supplier bids.
Funding is $626,000 in January: $426,000 equity and $200,000 debt. The assumed loan carries 10% fixed interest over 84 monthly annuity payments, without grace, plus a $6,000 expensed fee. Without equity, the cash trough is −$335,491. Equity adds a $90,000 retained reserve and rounds the requirement upward to $1,000.
- The cash trough already contains startup losses, working capital, investment and debt service.
- Receivables use two revenue days, food inventory seven food-cost days and payables zero.
- No land purchase, refundable deposit, salvage or exit sale is included.
Distinguish first operating profit from project recoveryCF
Base 2027 sales are $1,154,904 across 59,995 orders. EBITDA is $92,844 and net income $12,369 after the setup period. Cumulative 60-month revenue is $9,066,365, with $1,958,342 EBITDA. Later margins depend on the selected traffic, prices and labor productivity.
Monthly EBITDA first becomes and stays nonnegative in April 2027. EBIT and operating cash follow in May. Project payback is March 2029, month 27: cumulative undiscounted unlevered free cash flow recovers startup investment and deficits, without a later negative reversal. It excludes financing and terminal proceeds.
- Base minimum cash is $90,509 in April 2027, with financing held as entered.
- Low monetary stress reduces minimum cash to $38,426; it does not change physical order counts.
- Retained company cash is not an owner payout; no distributions are scheduled.
Selected results from the starting case
Modeled results in USD unless stated otherwise. These describe the selected inputs, not an estimate for your location or a guaranteed outcome.
- 2027 revenue
- $1,154,904USD, Base; includes ten operating months after March opening.
- 2027 fulfilled orders
- 59,995Dine-in plus takeaway transactions; portions and guests are separate units.
- 60-month EBITDA
- $1,958,342Cumulative Base operating result before interest, tax, depreciation and amortization.
- Minimum cash
- $90,509Base funded monthly cash balance in April 2027.
- Project payback
- March 2029 / month 27Cumulative undiscounted unlevered project free cash flow, starting January 2027.
- Low-case minimum cash
- $38,426Monetary stress with original Base financing; not a physical throughput scenario.
Make the case your own
Work from the operating plan toward the cash requirement.
Set the site's standard meal, custom options and dine-in/takeaway demand.
Replace productivity assumptions with observed prep, assembly and handover times.
Update paid roles, lease allowances and installed capital costs.
Review monthly liquidity, separate operating milestones and project payback under changed assumptions.
Interpretation and scope
- This is an analytical national case, not a chain forecast, local feasibility study or supplier quote.
- Annual cost-share schedules can approximate monthly costs when channel prices, packaging or mix diverge.
- The 25% tax planning rate selects no jurisdiction and has no loss carryforward.
- No peak-hour queues, individual menu recipes, automatic channel switching or backlog are simulated.
The workbook is an Excel file for local planning. Learn how to interpret assumptions and evidence.
Other restaurant types
Each operating type calls for its own financial structure.
Questions
Is customization a separate sale?
No. Its weighted premium is included in the meal price; each fulfilled order earns revenue once.
Why can custom mix change order capacity?
The initial custom portion adds 1.5 assembly minutes. More custom portions consume more of the same staffed station budget.
Are prep cooks and assembly workers interchangeable?
The saved design funds distinct crews. Their productive minutes feed different constraints and are not pooled automatically.
Does reducing seats stop takeaway?
No. Takeaway uses preparation, assembly and handover, but does not require dining seats.
Do both channels use the same packaging budget?
No. Initial takeaway packaging is $0.75 per order; dine-in consumables are $0.15, with reusable dishes in CAPEX.
Why is funding larger than initial CAPEX?
The $626,000 financing package also supports startup operating cash needs and a retained $90,000 reserve objective.
Does the profitable first year mean investment is recovered?
No. Base project payback is month 27, March 2029. First-year income and cumulative project cash recovery measure different things.
Can I buy this model now?
No. Purchasing and workbook downloads are not available on this site.
Which software does the workbook use?
The documented file is an Excel workbook (.xlsx). Compatibility with other spreadsheet applications is not established by the file extension.
Read the planning guides
Explore the relevant operating questions and how to interpret a workbook’s assumptions.
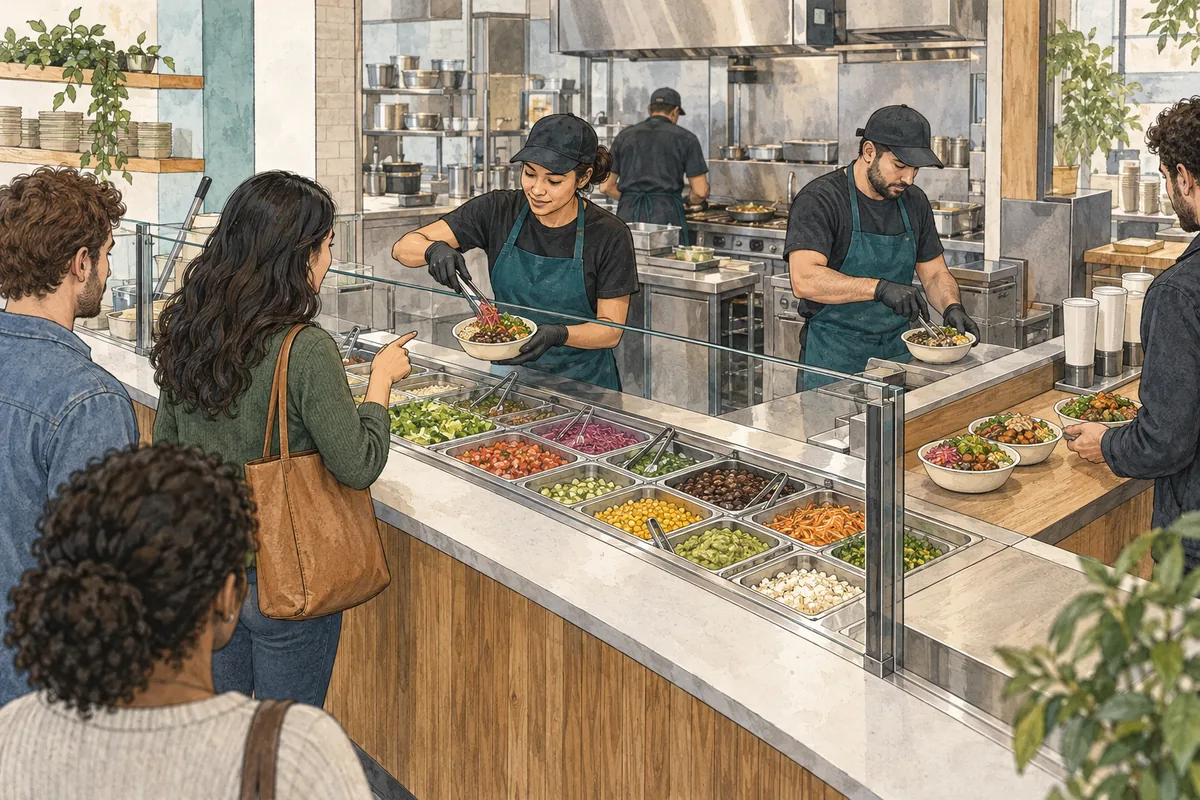
When does menu customization reduce fast-casual capacity?
Trace how a fast-casual menu premium changes assembly time, ingredient cost, and fulfilled orders in one selected restaurant planning case.
Read the guide
How to read financial assumptions before editing an Excel model
Follow the chain from operating assumptions to calculated results, check units and timing, and keep a useful record of changes to a financial workbook.
Read the guideEvidence and scope
User-selected analytical restaurant configuration. No direct operator source was assigned; formulas and capacity assumptions are specifications rather than verified market facts.
The links below provide operating-format context; they do not verify the workbook’s selected inputs or calculated returns.
The workbook guide and figures describe model PHY001-07, revision r01, for January 2027–December 2031. These are a documented planning case, not observed results for a particular business.