
Restaurant Financial Model: Off-Site Catering Operation
Plan staffed off-site events with guest guarantees, recipe costs, casual crew, van and equipment capacity, startup investment and cash flow.
- Excel (.xlsx)
- Forecast: 60 months · five calendar years
- Starting format: Staffed events · customer venues
- Model inputs: English · USD · Base scenario
Planning several types? Compare 17 restaurant formats
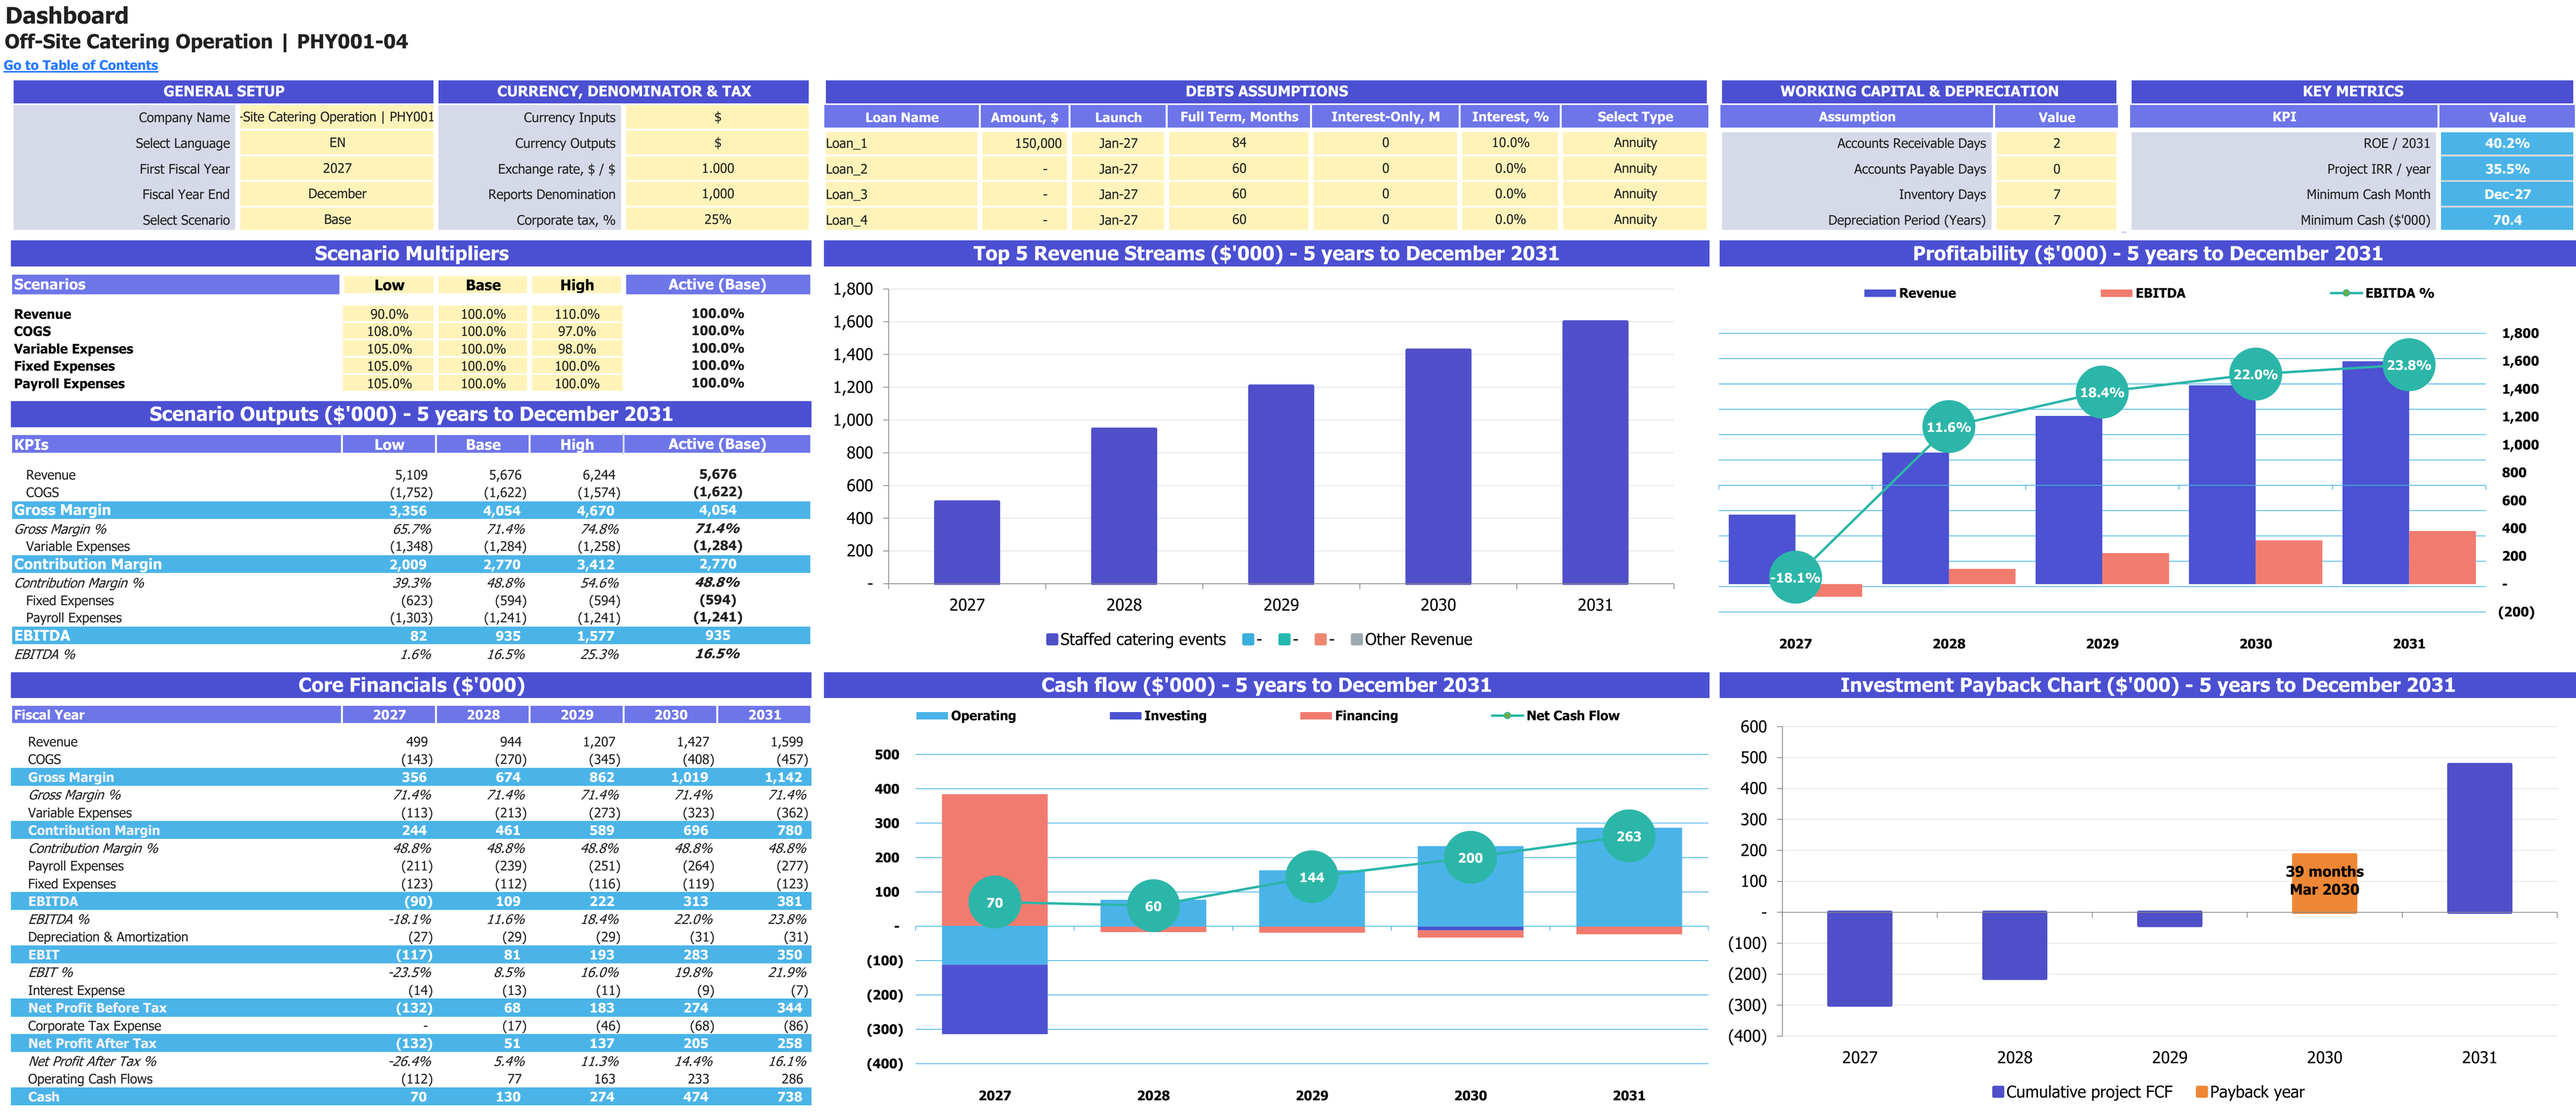
Base-case scenario controls, annual financial results and charts for 2027–2031. Financial report amounts are shown in thousands of USD; percentage measures retain their own units.
Enlarge image in a new tab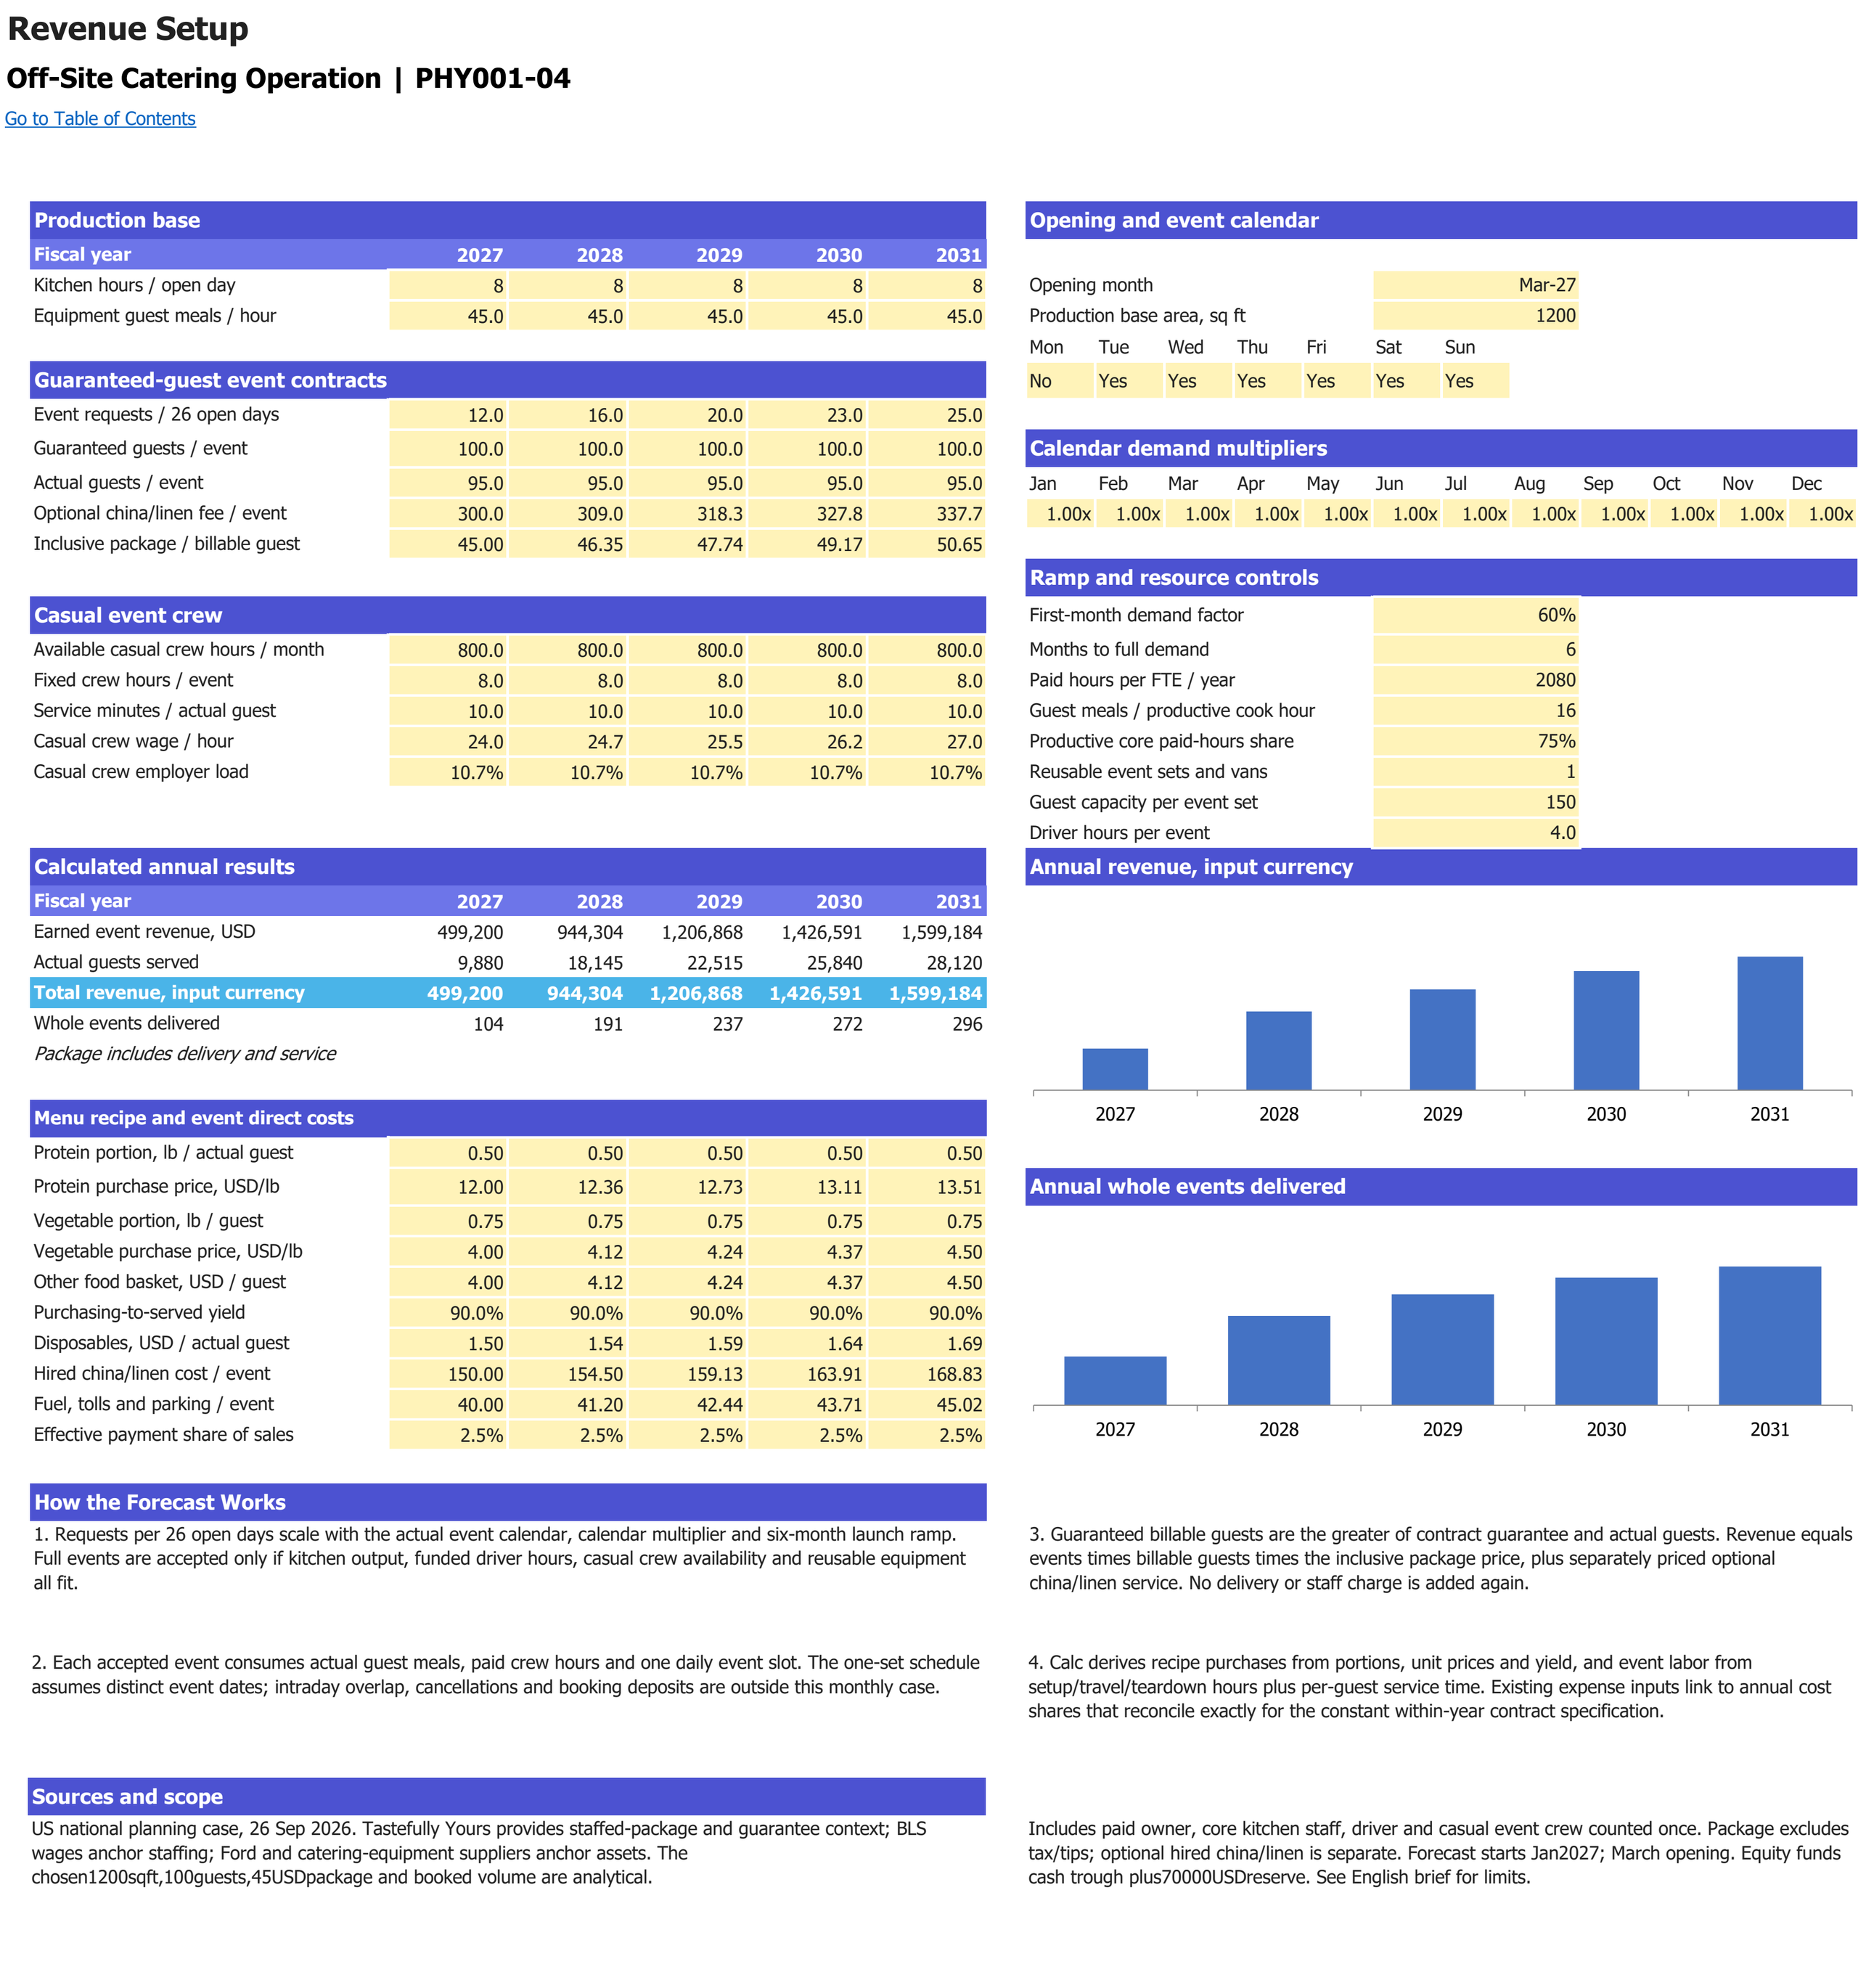
Event requests, guest guarantees, kitchen and service-crew constraints, with accepted contracts and sales. Monetary inputs and sales use USD; operating volumes retain their labelled units. Forecast years are 2027–2031.
Enlarge image in a new tab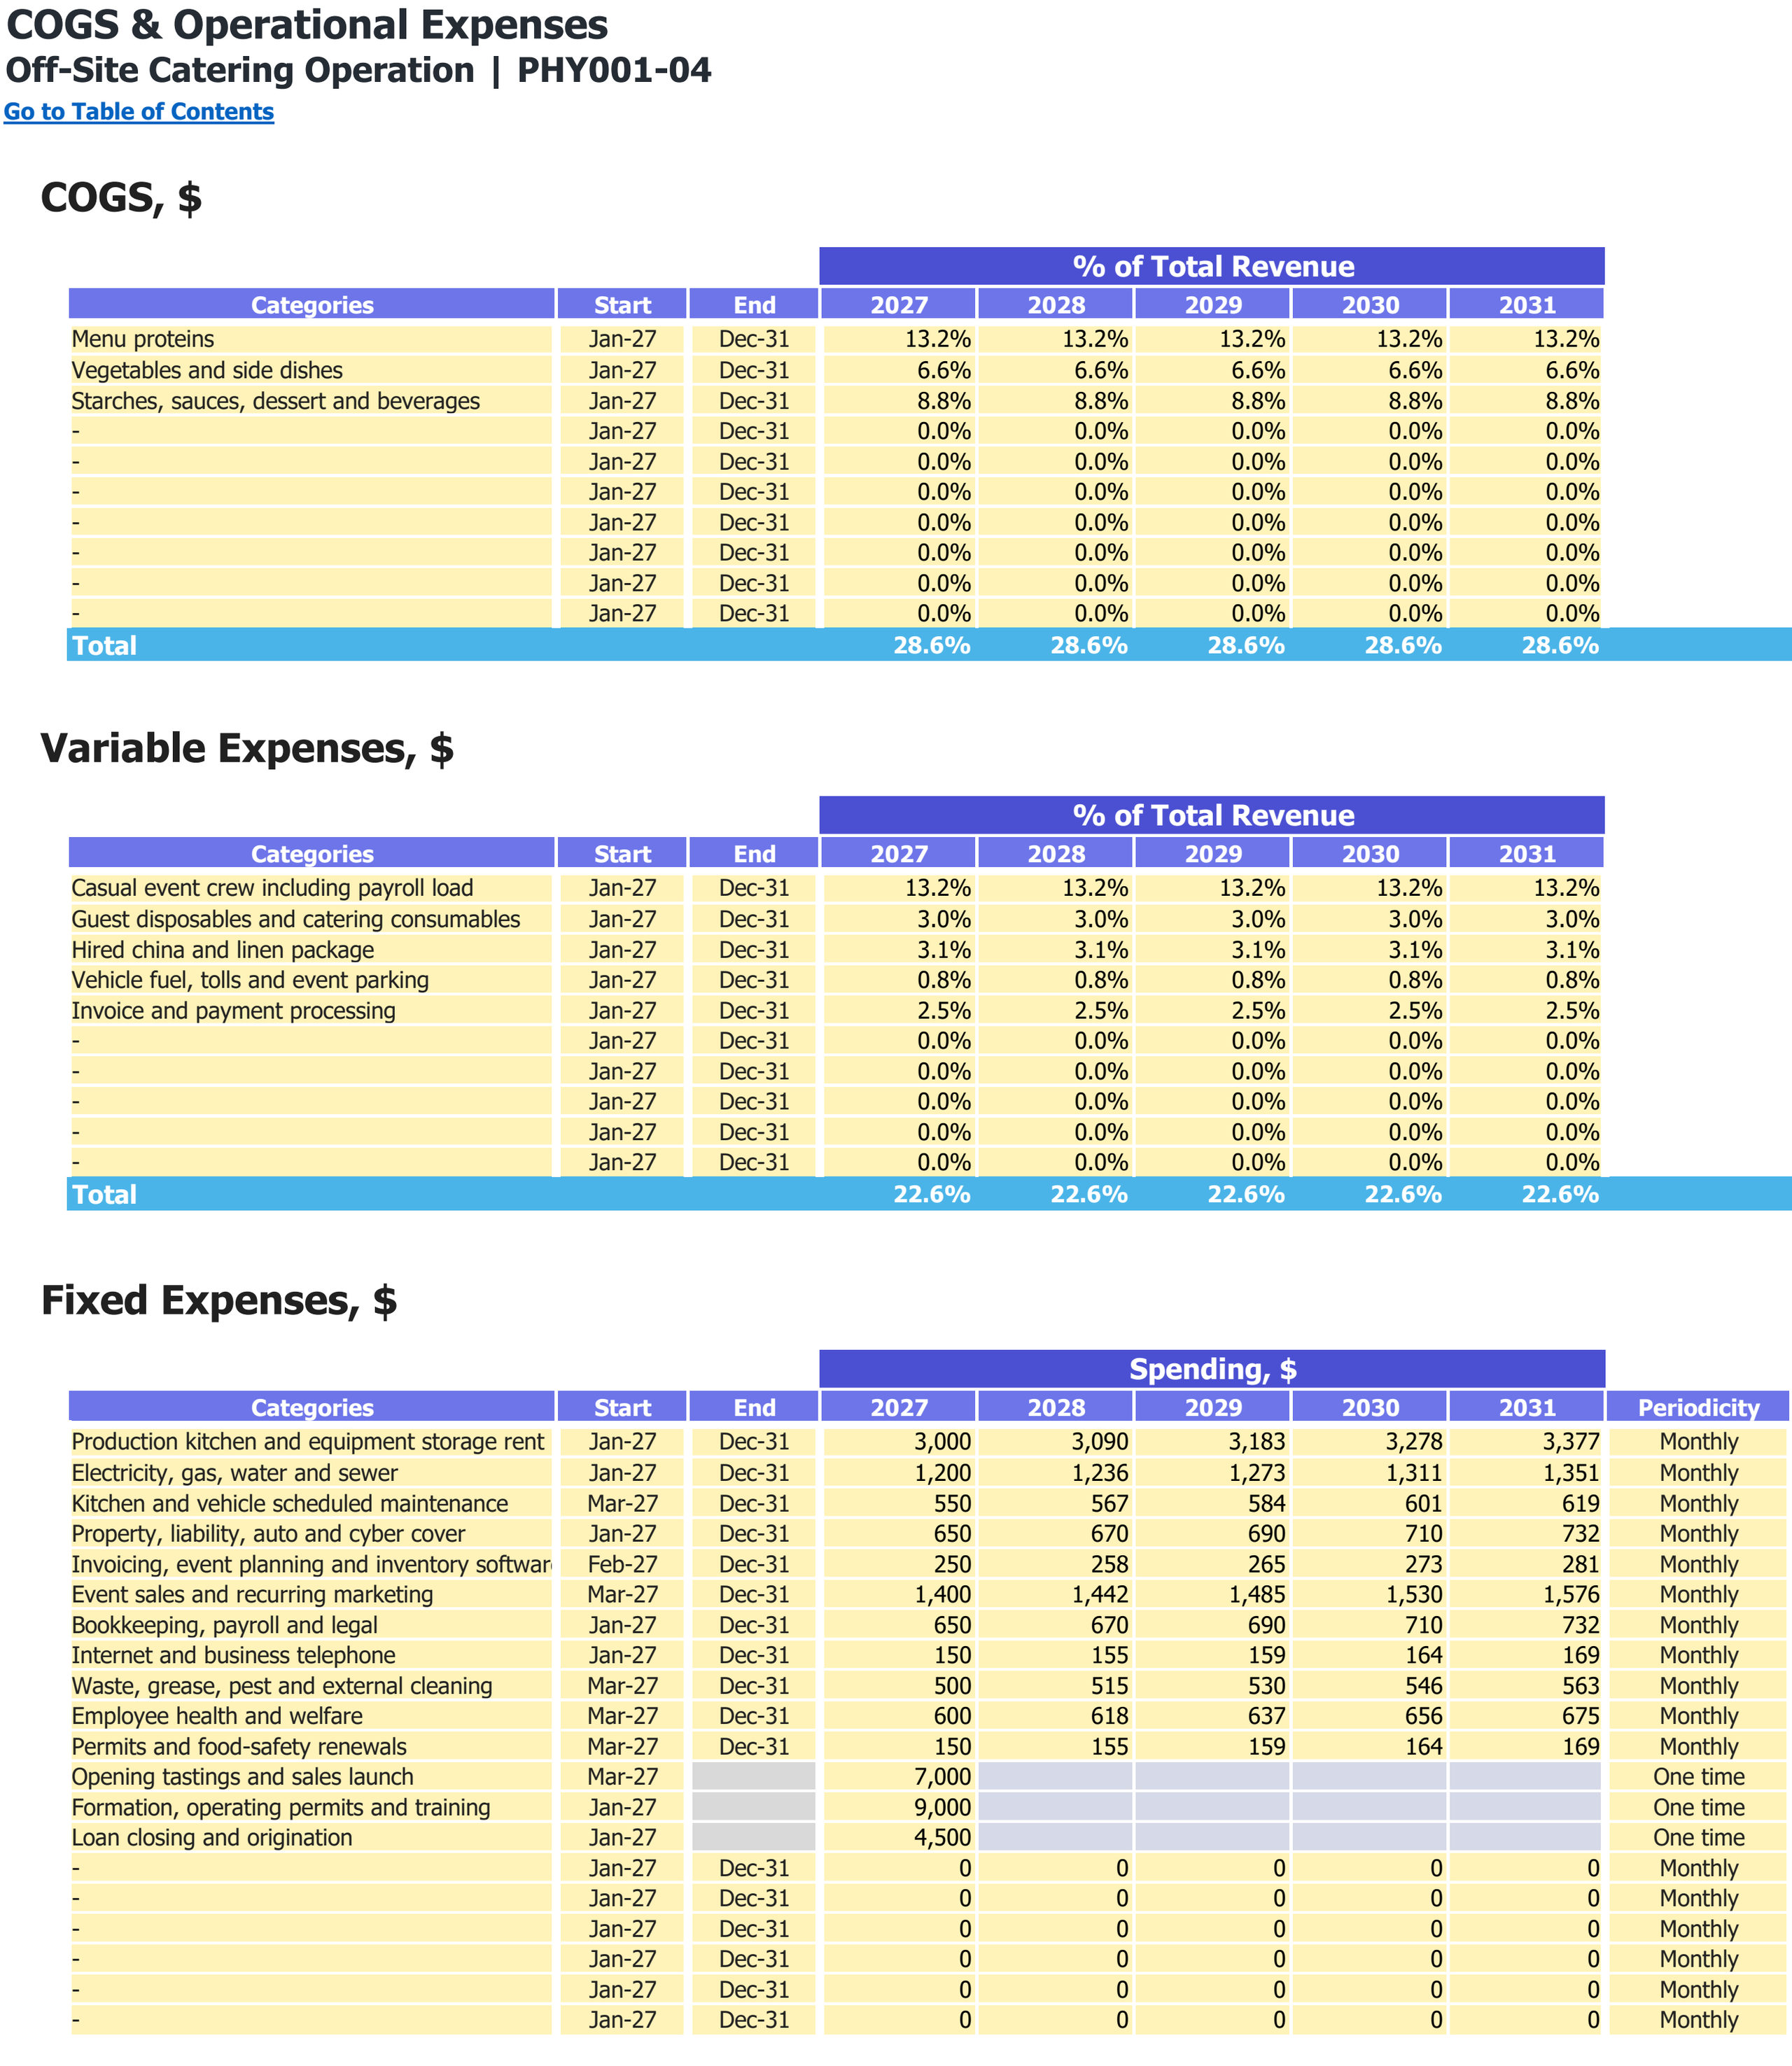
Food and other direct-cost categories, variable expense shares and fixed operating expenses. Monetary inputs are USD; the annual percentage columns are cost shares of revenue.
Enlarge image in a new tab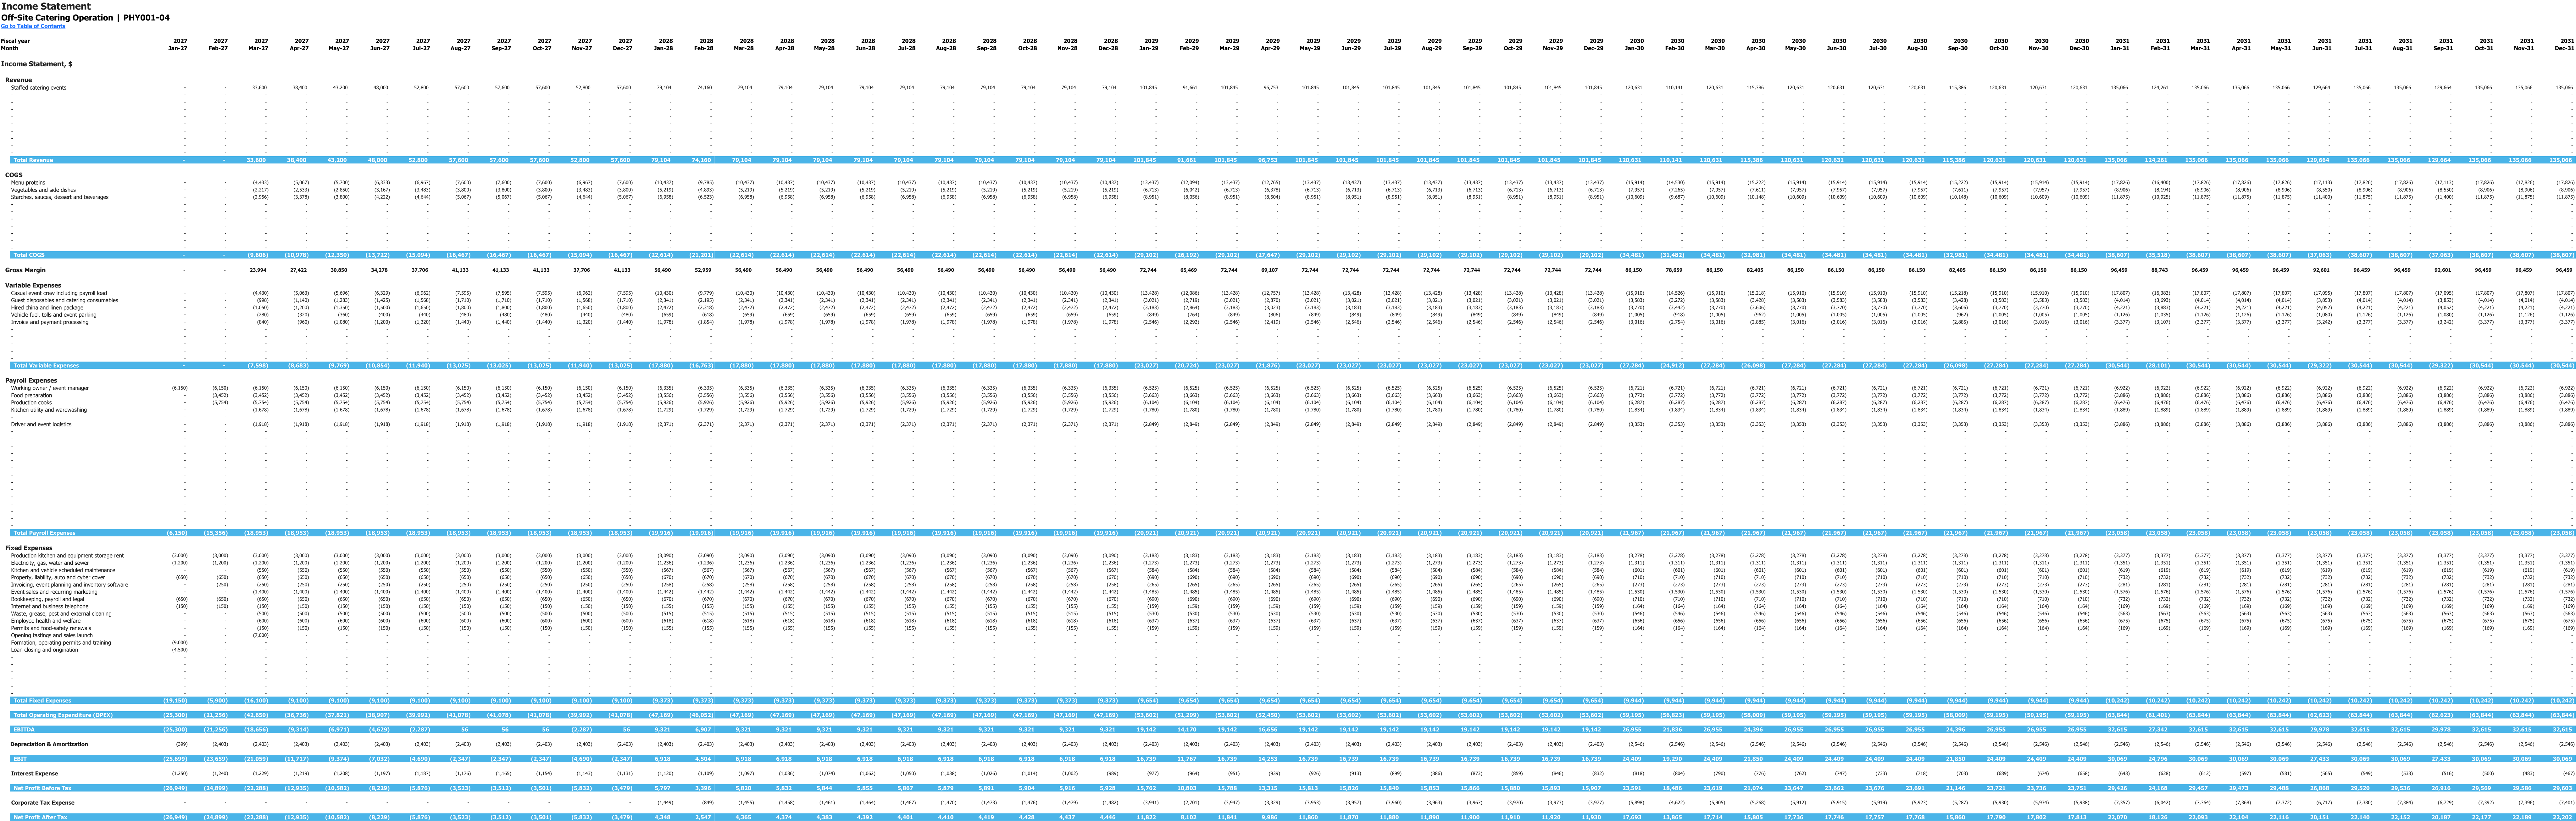
Monthly income statement for 2027–2031, in USD. This is an income statement view; it does not show payroll setup inputs. Enlarge to inspect the wide monthly table.
Enlarge image in a new tab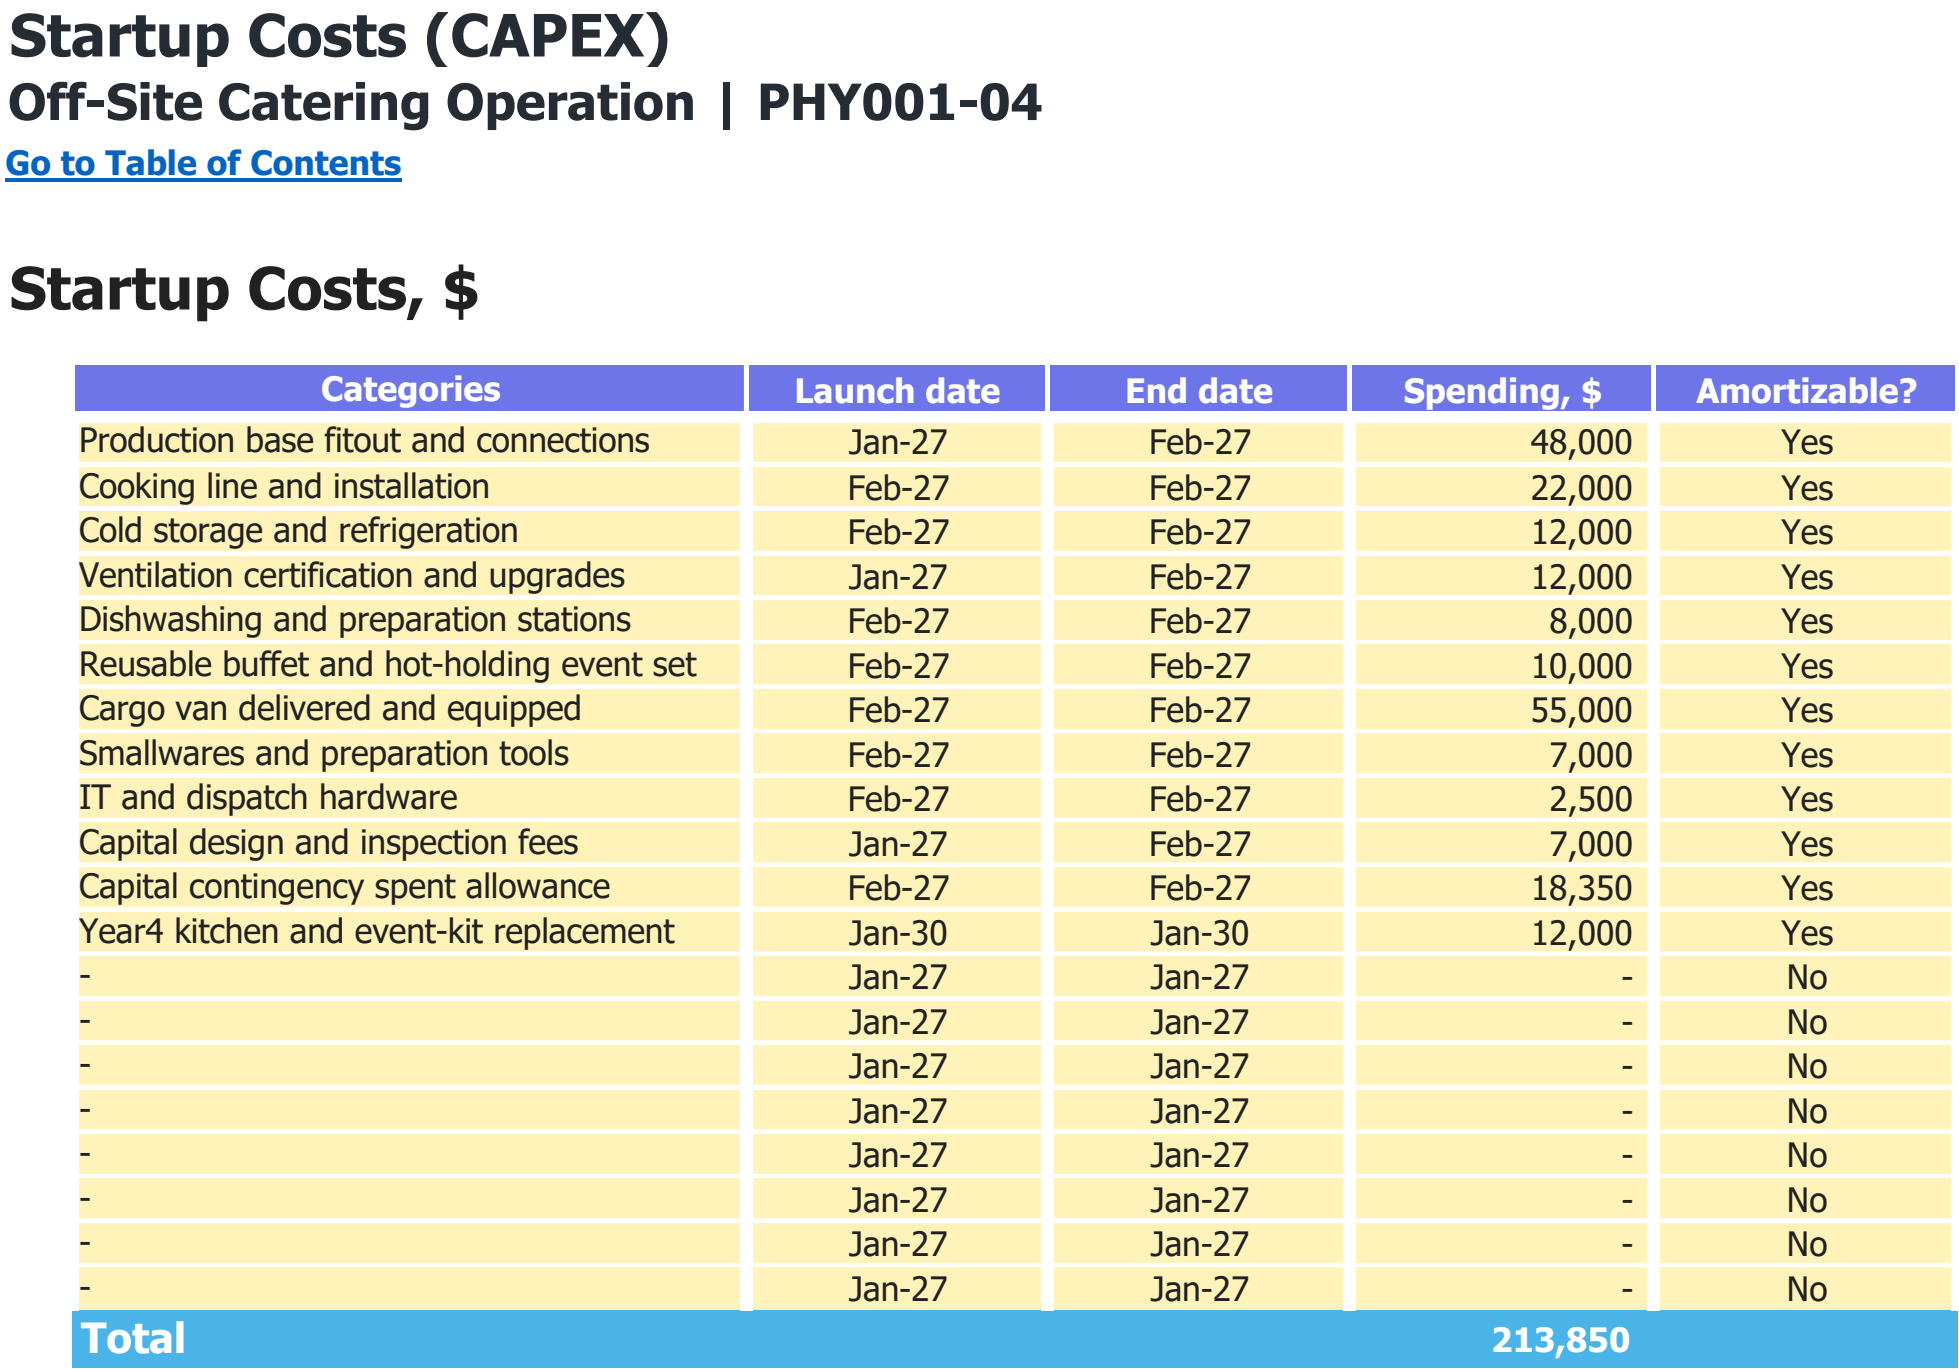
Asset categories, purchase dates and spending assumptions in USD. The total includes every scheduled purchase shown, including later replacements where present.
Enlarge image in a new tab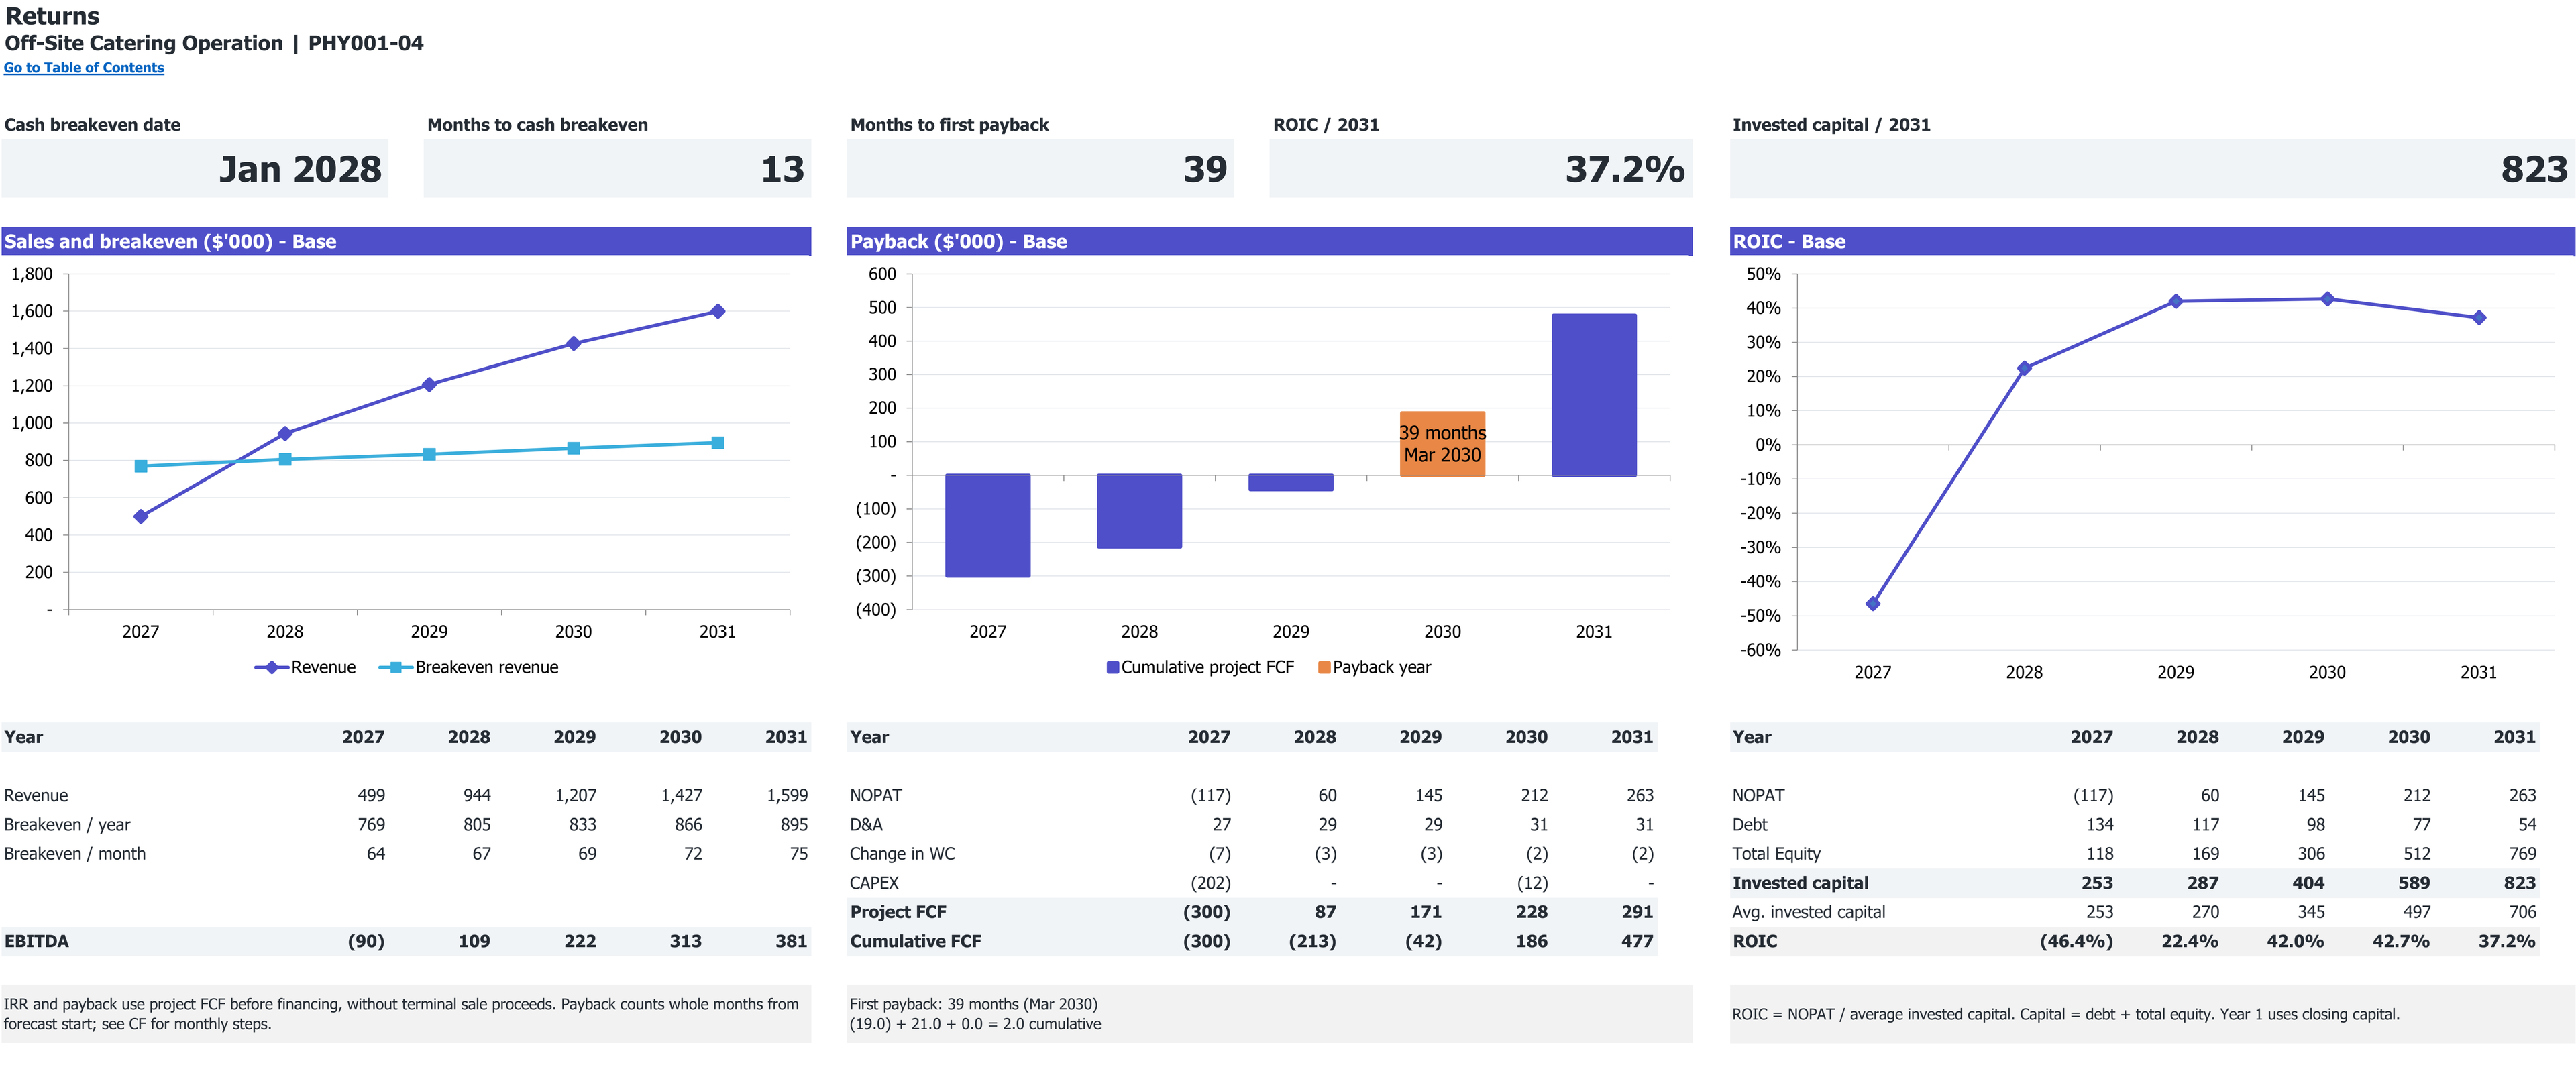
Excerpt from Returns: cumulative project free cash flow and first payback, if reached. 2027–2031 base case; dollar amounts in thousands.
Open full Returns view in a new tabExcerpt from Returns: revenue, annual and monthly break-even revenue, and EBITDA. 2027–2031 base case; dollar amounts in thousands.
Open full Returns view in a new tab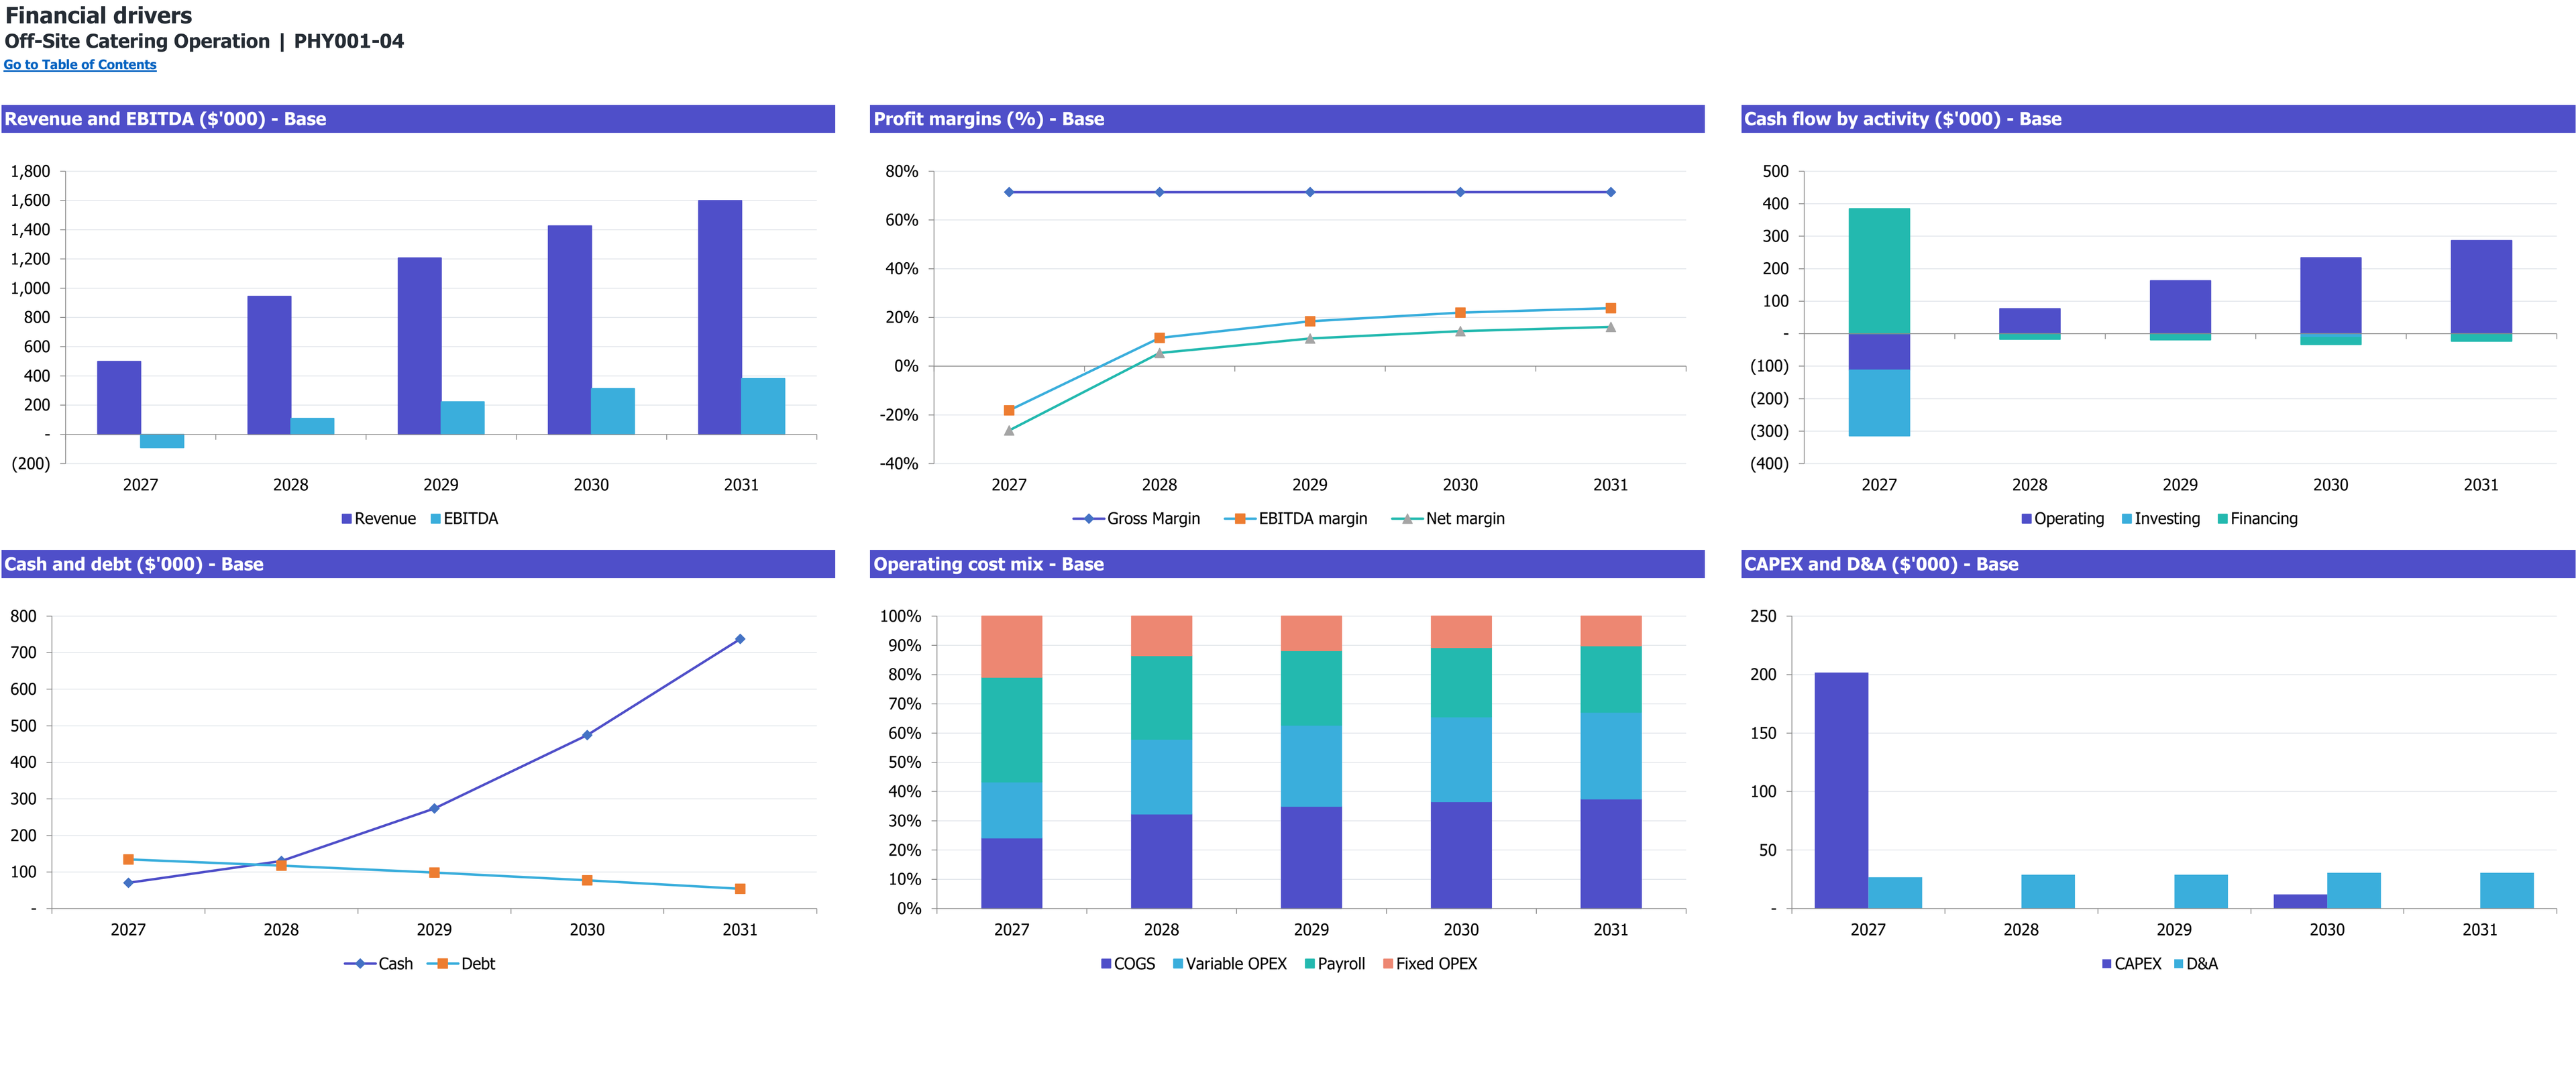
Six annual financial-driver charts for Off-Site Catering Operation, 2027–2031 (Base scenario). Dollar amounts are in thousands; margins and cost mix are percentages.
Enlarge image in a new tab8 selected worksheet views. Figures show this workbook’s starting case.
Workbook overview
What is inside the Excel model
Connect each catering contract to the food, crew and equipment it requires. This workbook accepts whole events against shared resources and separates guaranteed billing from actual attendance.
Selected worksheets from the documented workbook. Forecast period: January 2027–December 2031. Model reference: PHY001-04.
Inputs you control. Results you can inspect.
On a small screen, scroll within the table to read every column.
| Planning area | Inputs you review | How they connect | Results to inspect |
|---|---|---|---|
| Contracts and billing | Qualified requests, guaranteed guests, actual guests and package prices. | Whole delivered events earn the larger of guaranteed or actual guest billing. | Events, served guests and revenue. |
| Shared capacity | Cook productivity, casual crew hours, driver time, van and event-set capacity. | The tightest resource limits accepted whole events. | Feasible monthly event count. |
| Recipe purchases | Protein, vegetables, other ingredients, prices and usable yield. | Actual attendees determine ingredient purchases after yield adjustment. | Food quantities and costs. |
| Event expenses | Crew wages, consumables, china/linen hire, transport and processing. | Fulfilled events and actual guests drive their applicable costs. | Direct event expenses. |
| Core organization | Owner, kitchen and logistics payroll; fixed overhead and asset schedules. | Permanent resources are funded separately from casual event hours. | Payroll, operating earnings and CAPEX. |
| Funding | Equity, debt, working capital and the retained reserve. | Monthly cash includes setup, trading losses and debt service. | Cash trough and unlevered project payback. |
Is this the right model for your business?
Check the starting case before changing the assumptions.
The starting operation
- A 1,200-square-foot production and storage base serving staffed events at customer venues.
- A standard contract for 100 guaranteed guests and 95 expected attendees, supported by one van and one reusable event set.
- An owner who needs to test booking volume, event size, core staff and casual service labor together.
Check the boundary
The case excludes an owned event venue, restaurant dining room, alcohol sales and an individual event-booking calendar.
Compare the other restaurant typesHow this business makes money
Connect the unit sold to the resources required by this operating case.
Revenue logic
Revenue = completed events × (billable guests × package price + china/linen fee).
Billable guests are the greater of guaranteed and actual attendance. Only whole feasible events earn revenue.
Why can catering revenue rise without adding the same number of guests?
Contract billing and operating workload use different counts. In this case the guarantee supports billing for 100 guests even when 95 attend, while ingredients and service labor follow attendance. Actual attendance above the guarantee raises both billing and workload. The number of whole events is then limited by the kitchen, crew, driver and available equipment dates.
- Billing unit
- Delivered event × greater of guaranteed and actual guests, plus the separate package.
- Food and service
- Actual attendees, recipe yield and crew minutes.
- Logistics
- Funded driver hours, one van and a 150-guest reusable set.
- Booking pattern
- Monthly demand assumes events can use distinct available dates.
What to establish for your own operation
- Check contract inclusions before adding separate staff or delivery charges.
- Validate guest counts, recipe yield and crew time with actual event plans.
- Check overlapping dates and customer deposits outside this monthly model.
Follow the plan from demand to cash
Open each section for the assumptions, calculations, and limits of this workbook’s starting case.
Bill the guarantee, serve the actual attendeesRevenue
The initial package is $45 per billable guest, including delivery, professional service, setup and breakdown. A separate $300 china/linen package is selected for every modeled event. With 100 guaranteed guests and 95 attendees, revenue is $4,800; ingredients and service workload follow the 95 attendees.
Demand begins at 12 qualified requests per 26 open days, adjusted for actual Tuesday–Sunday dates and a six-month ramp from 60%. Accepted events are rounded down to whole events and constrained by kitchen output, casual crew, driver hours and equipment/calendar capacity. Unaccepted work expires.
- One reusable set serves up to 150 guests; larger events consume enough simultaneous sets, rounded upward.
- Each standard event needs eight fixed crew hours plus ten minutes per actual attendee: 23.83 crew hours.
- The 800-hour monthly casual pool is availability; only used hours are paid.
Separate core payroll from paid event workPayroll
Core staffing starts at 4.5 FTE and reaches 4.9 as driver/logistics staffing increases. It includes a paid owner/event manager, preparation, 1.5 production cooks and utility staff. Core salaries increase 3% annually, with 10.65% employer load and a separate $600 monthly welfare pool.
Recipe purchasing starts at $14.44 per actual guest: protein, vegetables and other ingredients divided by 90% usable yield. A standard event incurs $632.92 casual crew expense, plus consumables, china/linen hire and transport. Casual service labor is recorded once outside core Payroll.
- The $150 hired china/linen package differs from the owned buffet equipment.
- The $40 event transport allowance covers fuel, tolls and parking; driver wages remain in Payroll.
- Initial rent is $3,000 monthly; payment processing uses a 2.5% sales proxy that needs actual processor review.
Fund the production base, van and reusable service setCAPEX
Initial owned CAPEX is $201,850, including a $55,000 equipped van, reusable event equipment and a fully spent $18,350 contingency. The production base assumes a reusable shell. January 2030 adds $12,000 for kitchen and event-kit replacement.
January financing is $400,000: $250,000 equity and $150,000 debt. The assumed loan is 10% fixed over 84 monthly annuity payments. Equity covers the modeled pre-equity cash deficit and a $70,000 reserve. Capital contingency is spent; the reserve remains cash.
- The cash trough before equity, including the loan and debt service, is −$179,643.
- Receivables are two sales days, inventory seven food-cost days, and payables zero.
- Advance customer deposits and cancellation cash flows are not modeled, even though they may matter in an actual contract.
Distinguish the first profitable event month from sustained coverageCF
Base 2027 delivers 104 events and $499,200 revenue, with EBITDA of −$90,476. In 2031 it delivers 296 events and $1,599,184 revenue. Growth depends on booking volume, available dates, funded logistics and the selected contract economics.
EBITDA first becomes nonnegative in August 2027 but remains nonnegative only from December. EBIT and operating cash first become, and remain, nonnegative in January 2028. Project payback is March 2030, counted from January 2027 using cumulative undiscounted unlevered cash flow.
- Payback includes startup deficits and replacement capital, while excluding financing, interest and terminal value.
- The tested monetary Low scenario has positive five-year EBITDA but minimum cash of −$84,317.
- Multiple project cash-flow sign changes retain a REVIEW signal; the workbook does not assert a unique meaningful IRR.
Selected results from the starting case
Modeled results in USD unless stated otherwise. These describe the selected inputs, not an estimate for your location or a guaranteed outcome.
- Five-year revenue
- $5,676,147Base January 2027–December 2031, USD; annual revenue follows whole delivered events.
- Five-year EBITDA
- $935,259Base over 60 months, USD; 16.5% weighted EBITDA margin, including startup losses.
- Minimum funded cash
- $70,357Base monthly minimum in December 2027, USD; includes selected equity and debt.
- Sustained operating cash coverage
- January 2028 · month 13Base EBIT and operating cash become nonnegative and remain so; EBITDA is sustained from December 2027.
- Project payback
- March 2030 · month 39Base cumulative undiscounted unlevered project cash flow crosses zero with no later negative reversal.
- Low-scenario cash minimum
- −$84,317Tested monetary Low scenario, USD, over 60 months; Base financing does not expand automatically.
Make the case your own
Work from the operating plan toward the cash requirement.
Set the actual guest guarantee, expected attendance and included package scope.
Enter booking demand and test whole-event kitchen, crew and logistics limits.
Replace recipe costs, casual wages, equipment and vehicle budgets.
Compare monthly cash and sustained coverage, then resize financing for the selected booking plan.
Interpretation and scope
- This national case was researched September 26, 2026; no local venue, vehicle, insurance or credit quotation is implied.
- All events share a specification within each year. Different monthly contract mixes require a different cost interface.
- The 25% blended tax rate has no selected jurisdiction or loss carryforward. No shareholder distributions are scheduled.
The workbook is an Excel file for local planning. Learn how to interpret assumptions and evidence.
Other restaurant types
Each operating type calls for its own financial structure.
Questions
Are 95 attendees billed as 95 guests?
Not in the standard case. The 100-guest guarantee determines billing unless actual attendance is higher.
Are delivery and service charged again?
No. They are included in the $45 guest package. Only the separate china/linen package adds another charge.
Does the model accept fractional events?
No. Demand and each practical constraint produce whole-event limits; accepted events are rounded down.
Are all 800 available casual hours paid?
No. That pool constrains availability. Expense follows the hours required by delivered events.
Does adding a van automatically permit overlapping events?
The model tests monthly equipment and date capacity. It does not schedule individual bookings or prove simultaneous-event feasibility.
Does it include customer deposits?
No. Event-month recognition and settlement are retained; there is no deposit, deferred-revenue or cancellation schedule.
Why does a REVIEW signal remain?
Project cash flow changes sign more than once. That economic pattern limits IRR interpretation; it is distinct from a broken financial reconciliation.
What if a purchased file is damaged or cannot be downloaded?
See the refund and replacement policy for file correction, replacement and download assistance. Keep the product name and your order reference when requesting help.
Which software does the workbook use?
The documented file is an Excel workbook (.xlsx). Compatibility with other spreadsheet applications is not established by the file extension.
Read the planning guides
Explore the relevant operating questions and how to interpret a workbook’s assumptions.
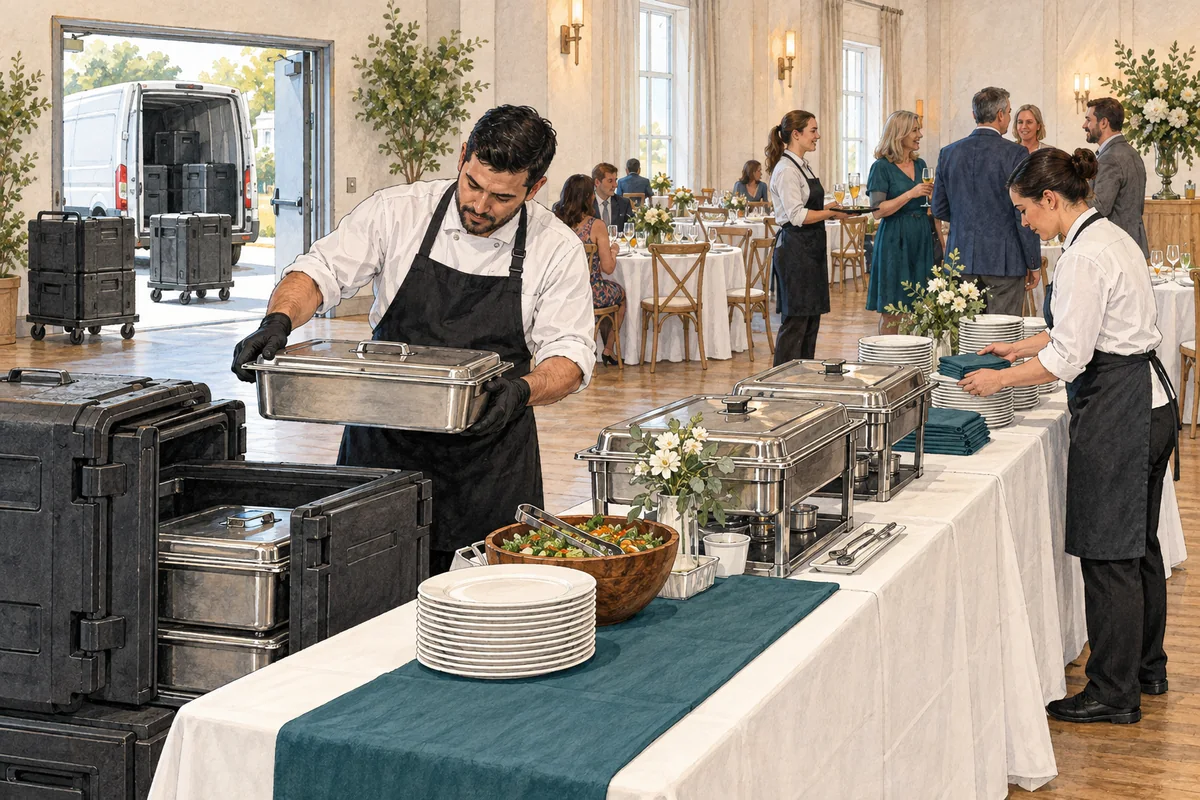
How do event guarantees differ from actual service workload?
Compare a staffed catering package with an event coffee bar to separate guaranteed billing, expected attendance, crew capacity, and advance cash.
Read the guide
Which restaurant business idea fits the way you want to operate?
Choose among dine-in, pickup, delivery, catering, and a temporary residency by comparing the customer promise, operating work, and commitments each creates.
Read the guide
How to read financial assumptions before editing an Excel model
Follow the chain from operating assumptions to calculated results, check units and timing, and keep a useful record of changes to a financial workbook.
Read the guideEvidence and scope
A related category or operator is referenced. Do not interpret the link as independent proof of this exact configuration or its viability.
The links below provide operating-format context; they do not verify the workbook’s selected inputs or calculated returns.
The workbook guide and figures describe model PHY001-04, revision r01, for January 2027–December 2031. These are a documented planning case, not observed results for a particular business.