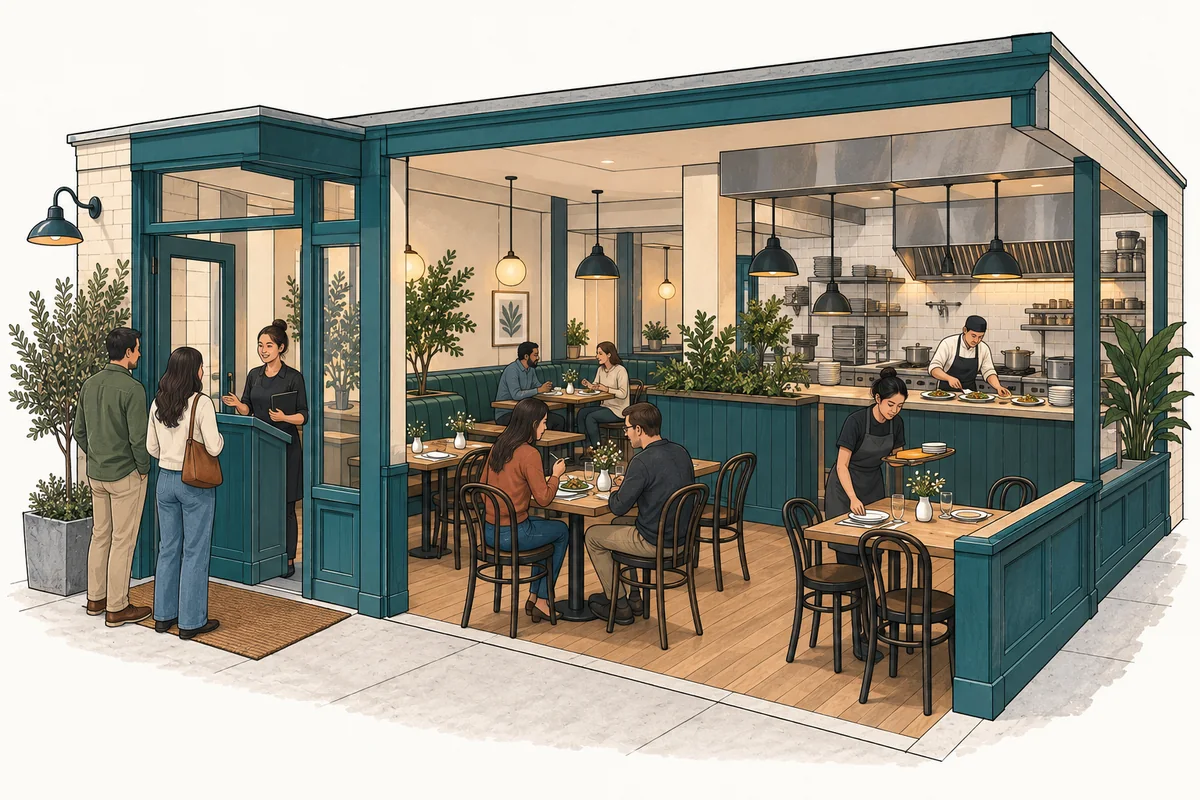
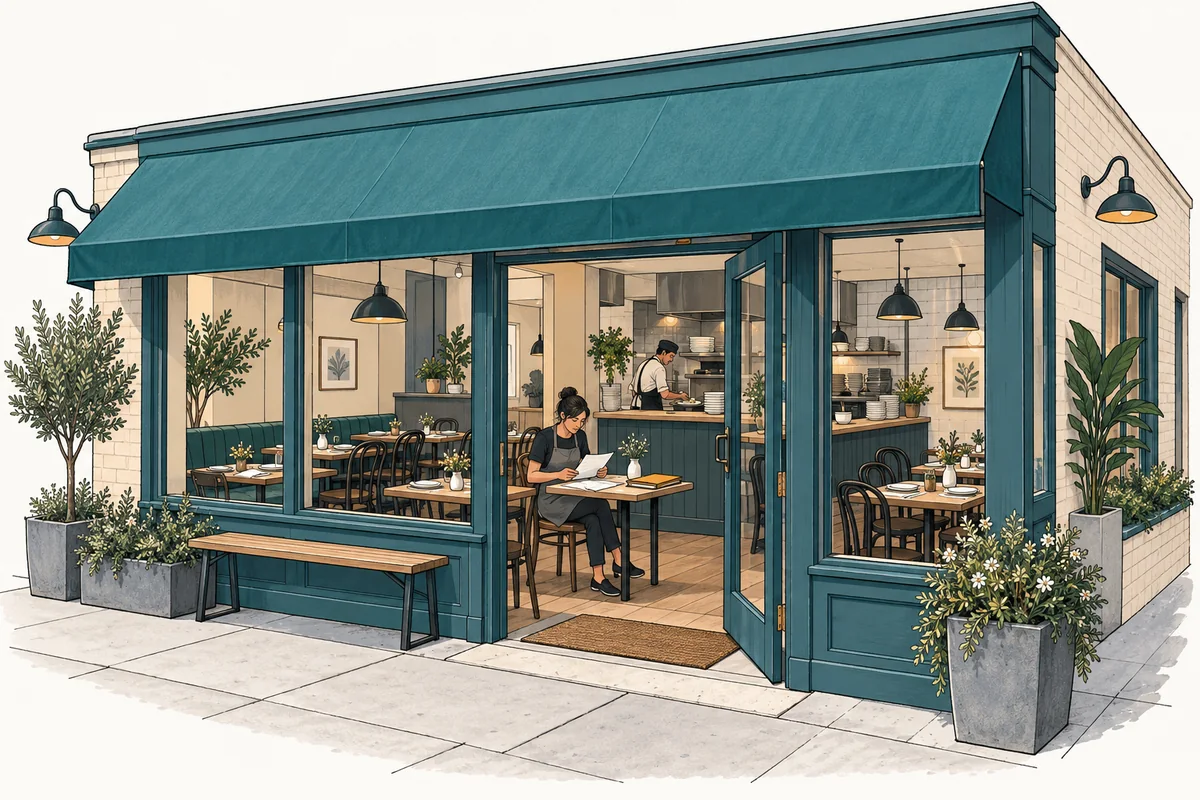
The quick-service restaurant case uses a 2,000-square-foot site with 32 seats, counter or kiosk ordering, and no drive-through or delivery. The figures below are selected 2027 Base operating inputs. Theoretical daily ceilings illustrate the units; they are not a recalculated daily sales forecast.
Why separate guests, meal units, and orders?
The selected order contains 1.5 complete-meal equivalents at $12 each, earning $18 net revenue. A dine-in order also represents 1.5 seated guests. Those matching numbers are separate assumptions: meal units determine kitchen work, while guests determine occupied seats.
Mature requests are 100 dine-in and 150 takeaway orders per open day. Together they request 375 meal units: (100 + 150) × 1.5. The opening ramp, actual operating dates, and resource limits still stand between those requests and recognized revenue.
Using 250 orders as 250 meals would understate the production workload. Treating every takeaway order as another seated party would overstate dining demand. The forecast needs the conversion appropriate to each resource rather than one interchangeable volume label.
What does the seating calculation actually tell you?
Only dine-in requests pass the seating gate. At 32 seats, ten opening hours, 30 minutes of dwell, and 1.5 guests per order, the isolated seating calculation is 32 × 10 × 60 ÷ 30 ÷ 1.5 = 426.67 theoretical dine-in orders per day.
That number assumes the selected average dwell and full availability across the service window. It excludes kitchen and paid counter constraints, arrival peaks, and the model’s monthly rounding. It therefore cannot be used as a sales target simply because the arithmetic exceeds the demand input.
Requests rejected by the seating gate do not automatically become takeaway orders. Conversely, setting seats to zero can leave takeaway activity available if the shared production and service resources remain funded and operating.
Which resources belong to both channels?
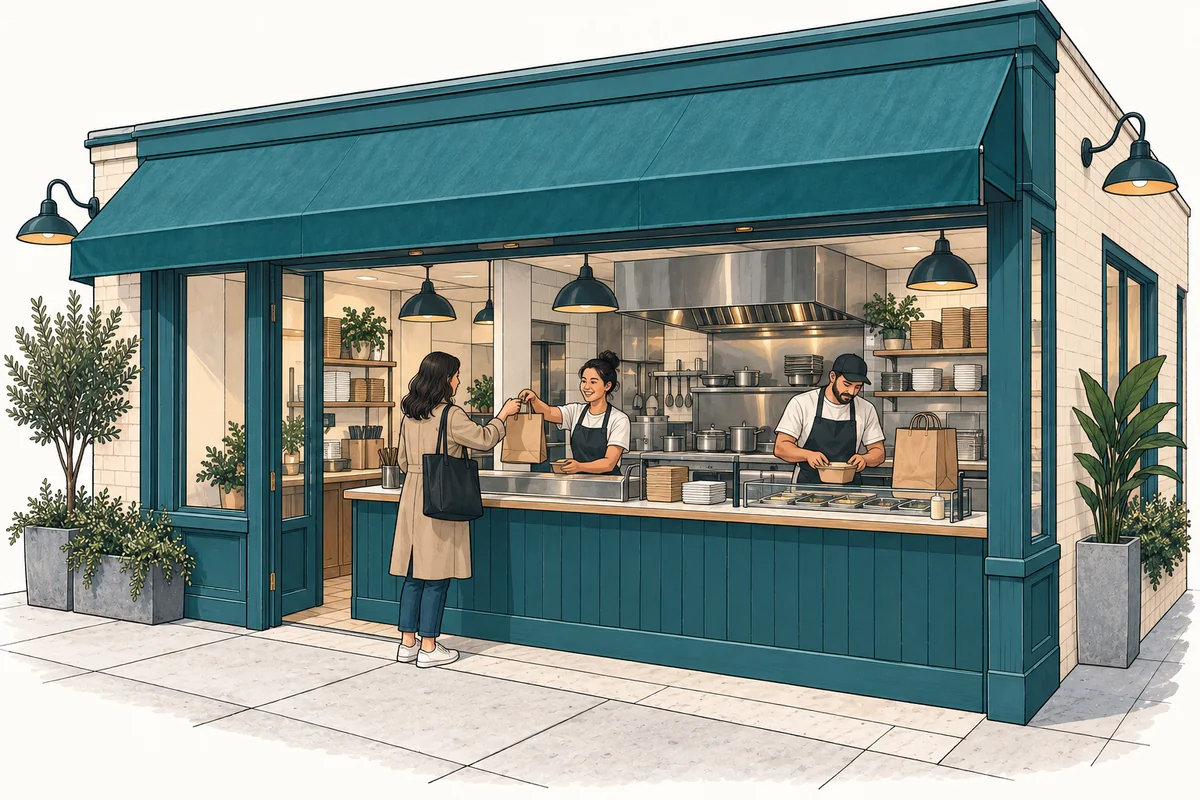
After the seating check, eligible demand from both channels competes for the same kitchen and handover resources. The forecast does not grant one full kitchen budget to dine-in and another identical budget to takeaway.
On a narrow screen, scroll within the table to read the resource limits.
| Resource | Dine-in use | Takeaway use | Relevant limit |
|---|---|---|---|
| Dining seats | 1.5 guests per order | No seats | Seats and dwell time |
| Kitchen | 1.5 meal units per order | 1.5 meal units per order | Lower of installed output and funded cook output |
| Ordering | One order | One order | Two endpoints at 1.5 minutes per order |
| Paid handover | 1.5 staff-minutes per order | 1.5 staff-minutes per order | Productive counter minutes, capped by endpoint hours |
Two ordering endpoints over ten hours at 1.5 minutes per order give an isolated physical ceiling of 800 orders per day. That does not fund 800 handovers: the paid counter team has its own productive-minute budget, and the kitchen has a separate funded cook limit.
The model takes the smallest supported fulfillment fraction across kitchen workload, handover minutes, ordering capacity, and 100% of eligible demand. It applies that fraction to both channels, then rounds each channel down to whole orders. Small unused remainders can remain after rounding.
Which change should a growth scenario test?
Start with the resource that actually limits fulfillment. Adding seats can help constrained dine-in demand, but cannot repair a kitchen shortage. Another ordering endpoint can increase a physical gate while leaving paid handover time unchanged.
The working owner, preparation crew, utility staff, and relief supervisor are paid roles. Their hours do not become extra production-cook or counter capacity merely because the restaurant employs them. Average funded FTE also do not substitute for a workable shift roster.
Operational changes should be tested through demand, meal content, dwell, staffing, and process inputs. The inherited financial scenarios change monetary values while physical orders stay unchanged. If the two channels develop different within-year economics, annual expense shares can also become an average monthly allocation. Use the demand-and-capacity guide to distinguish a resource ceiling from guests or orders actually served.