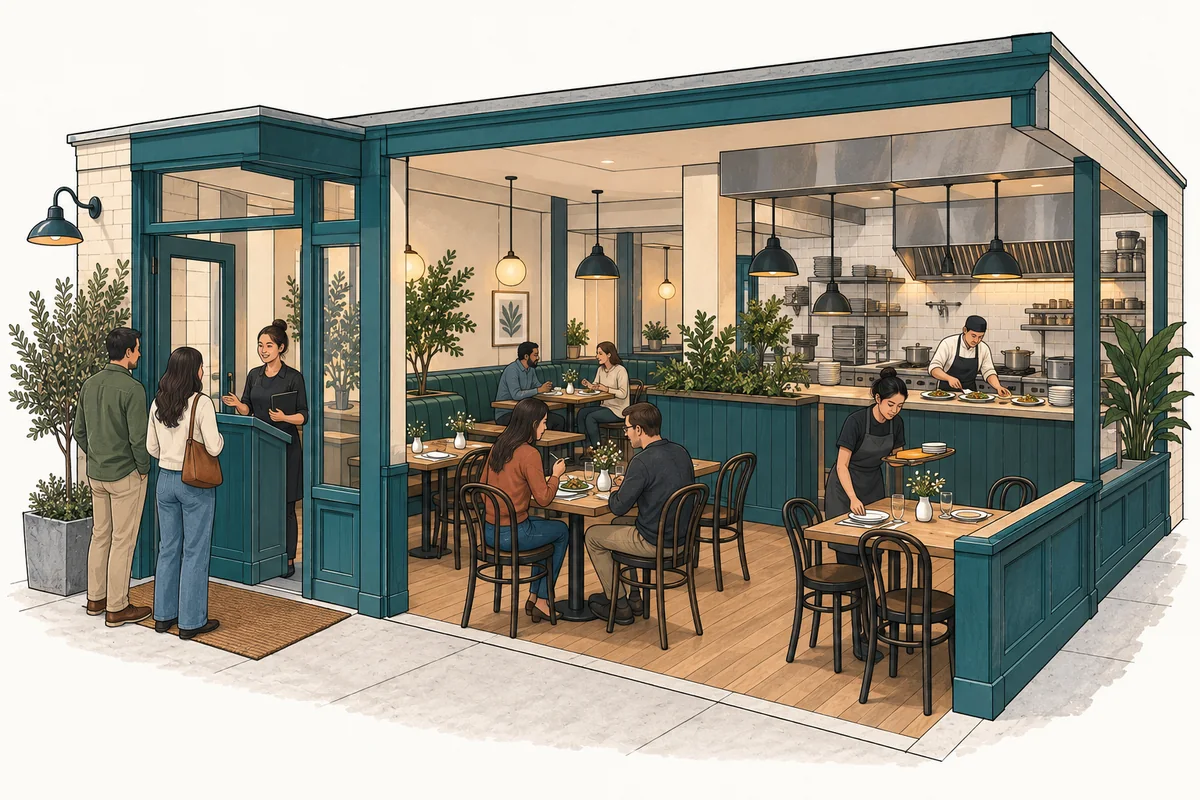
The conveyor-belt restaurant case plans a U.S. sushi venue with 60 diner seats and 48 belt plate positions. Its Base forecast covers January 2027–December 2031, with May 2027 service opening. The following 2027 prices, mix, loss, and timing values are selected case assumptions; they are not observed industry norms.
Which units create revenue?
Each guest purchases an expected 4.5 belt plates. A 30/50/20% mix priced at $2.95/$3.95/$4.95 gives $3.85 per sold plate: 30% × $2.95 + 50% × $3.95 + 20% × $4.95. Separately billed hot orders attach to 35% of guests at $14.50, and soft drinks attach to 65% at $3.50.
For an isolated batch of 100 fulfilled guests, that means 450 sold belt plates, 35 hot orders, and 65 drinks. Their revenues are $1,732.50, $507.50, and $227.50, totaling $2,467.50. Dividing by 100 gives $24.675 expected revenue per guest before costs. A separate full guest check is not added to those sales.
Included soup in the hot order and drink refills stay within their costed products. They do not become extra billable units. The same attachment assumptions also create kitchen, service, and dish workloads, so a change in the basket affects more than average revenue.
How much production supports the sold plates?
The case’s 8% belt discard rate is a share of production. Sold plates therefore represent 92% of what was made. To supply 450 sales, production is 450 ÷ 92% = 489.13 expected plates, with 39.13 discarded. Multiplying sales by 1.08 would produce only 486 plates and would not implement the stated loss definition.
On a narrow screen, scroll within the table to read all columns.
| Food stream | Sold units | Required production | Discarded production |
|---|---|---|---|
| Belt plates | 450.00 | 450 ÷ 0.92 = 489.13 | 489.13 − 450 = 39.13 |
| Complete hot orders | 35.00 | 35 ÷ 0.98 = 35.71 | 35.71 − 35 = 0.71 |
These are expected-flow quantities, not instructions to prepare fractional plates. Raw ingredient usable yields apply before finished-item discard and are counted separately. Every produced belt plate consumes ingredients, preparation, belt handling, and eventual washing, whether it is sold or discarded.
The model ends each day with zero finished stock and tapers replenishment before closing. It does not seed a minimum display on a zero-demand day. A concept that keeps a large display ready regardless of demand would need a different production assumption before using these cost results.
How does residence time use the belt positions?
A belt position remains occupied while a plate circulates. The selected expected sold dwell is 15 minutes; discarded plates use a selected 60-minute expiry interval. Weighting those durations by the 92% sold and 8% discarded shares gives 18.6 minutes per produced plate: 0.92 × 15 + 0.08 × 60.
The case applies a 90% operating allowance to 48 positions, giving 43.2 effective positions. Over eight service hours, the steady-flow ceiling is 43.2 × 480 ÷ 18.6 = 1,114.84 produced plates per day. Each guest requires 4.5 ÷ 0.92 = 4.8913 produced plates, so the belt supports 227.92 expected guests per day before whole-guest rounding.
This is an economic flow calculation using the case’s chosen timing policy. It does not verify individual plate ages, temperature, or food-safety procedures. It also does not simulate queues or guarantee that a concentrated rush can be served at the same rate.
Which staffed stage becomes the actual limit?
The daily guest ceiling compares the belt with all other simultaneous workloads. At the saved baseline, belt circulation is the tightest stage, but service and dishwashing are close. The minimum expected limit rounds down to 227 whole guests before demand, calendar, and funded operating-day limits.
On a narrow screen, scroll within the table to read all columns.
| Resource | Guests/day | Work represented |
|---|---|---|
| Belt circulation | 227.92 | Produced plates, residence time, and effective positions |
| Sushi preparation | 239.20 | All produced belt plates after paid setup time |
| Belt handling | 309.04 | Produced-plate handling plus additional discard work |
| Hot kitchen | 436.80 | Complete hot orders, including their preparation loss |
| Service | 231.43 | Guest handling plus sold hot-order and drink tasks |
| Dishwashing | 234.46 | Every produced plate, hot-order bowls, and sold-drink glasses |
| Seats alone | 480.00 | 60 seats × 480 minutes ÷ 60-minute seat cycle |
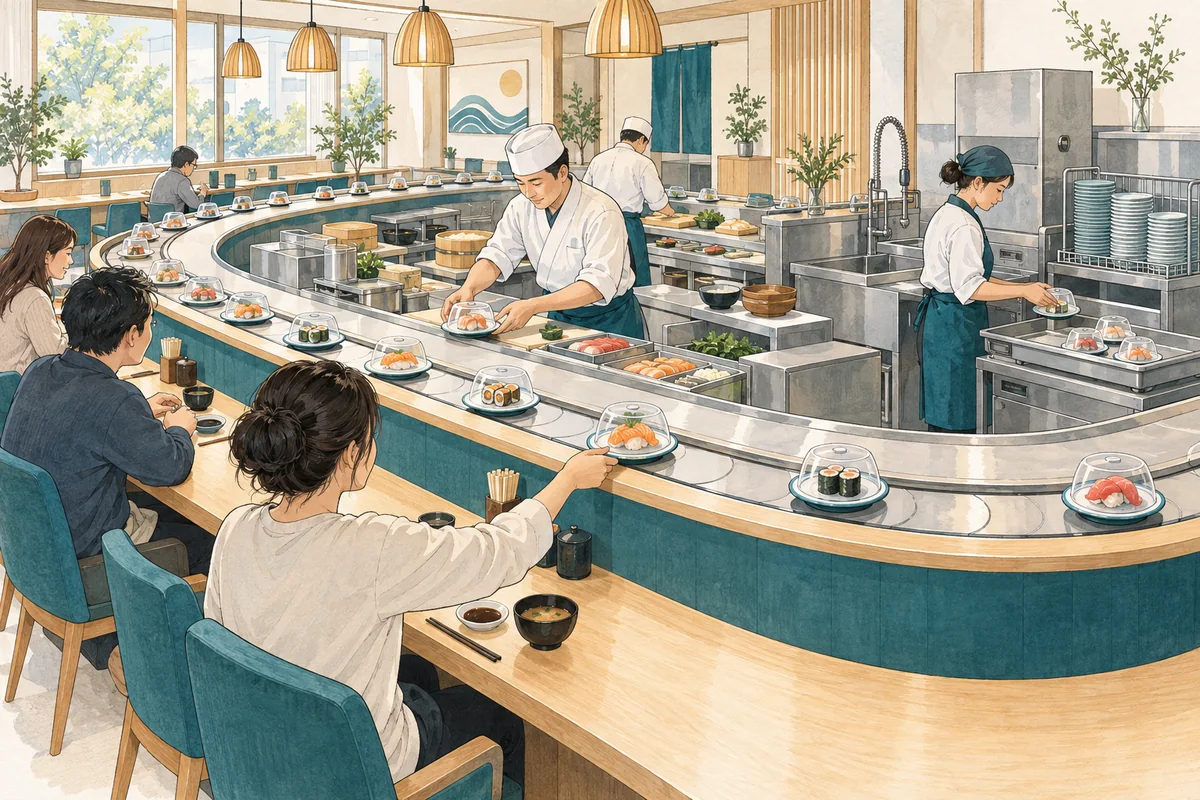
The 60 diner seats and 48 plate positions describe different assets. Adding seats would not relieve the baseline belt constraint. Faster circulation could expose service or dishwashing as the next limit, so a belt improvement cannot be translated directly into additional sales without checking the rest of the chain.
What should a replenishment test measure?
Measure sold mix, actual discard as a share of production, residence, and the staff minutes used by each stream. More waste raises production per paid plate and occupies positions longer under this model’s timing assumptions. A higher hot-order or drink attachment also changes shared service and washing work, even if belt plates per guest stay constant.
Use those observations to review the conveyor model, preserving the distinction between revenue units and production units. The assumptions guide provides a record for those changes. This case remains an expected-flow plan with paid resource constraints, not a transaction-level replenishment or queue simulator.