
Restaurant Financial Model: Conveyor-Belt Restaurant
Plan conveyor sushi plate sales, belt residence, unsold production, hot-menu attachments, paid labor and startup cash.
- Excel (.xlsx)
- Premises: 2,400 sq ft / 60 belt-accessible seats
- Belt: 48 nominal plate positions
- Opening: May 2027 / eight trading months in year one
Planning several types? Compare 17 restaurant formats
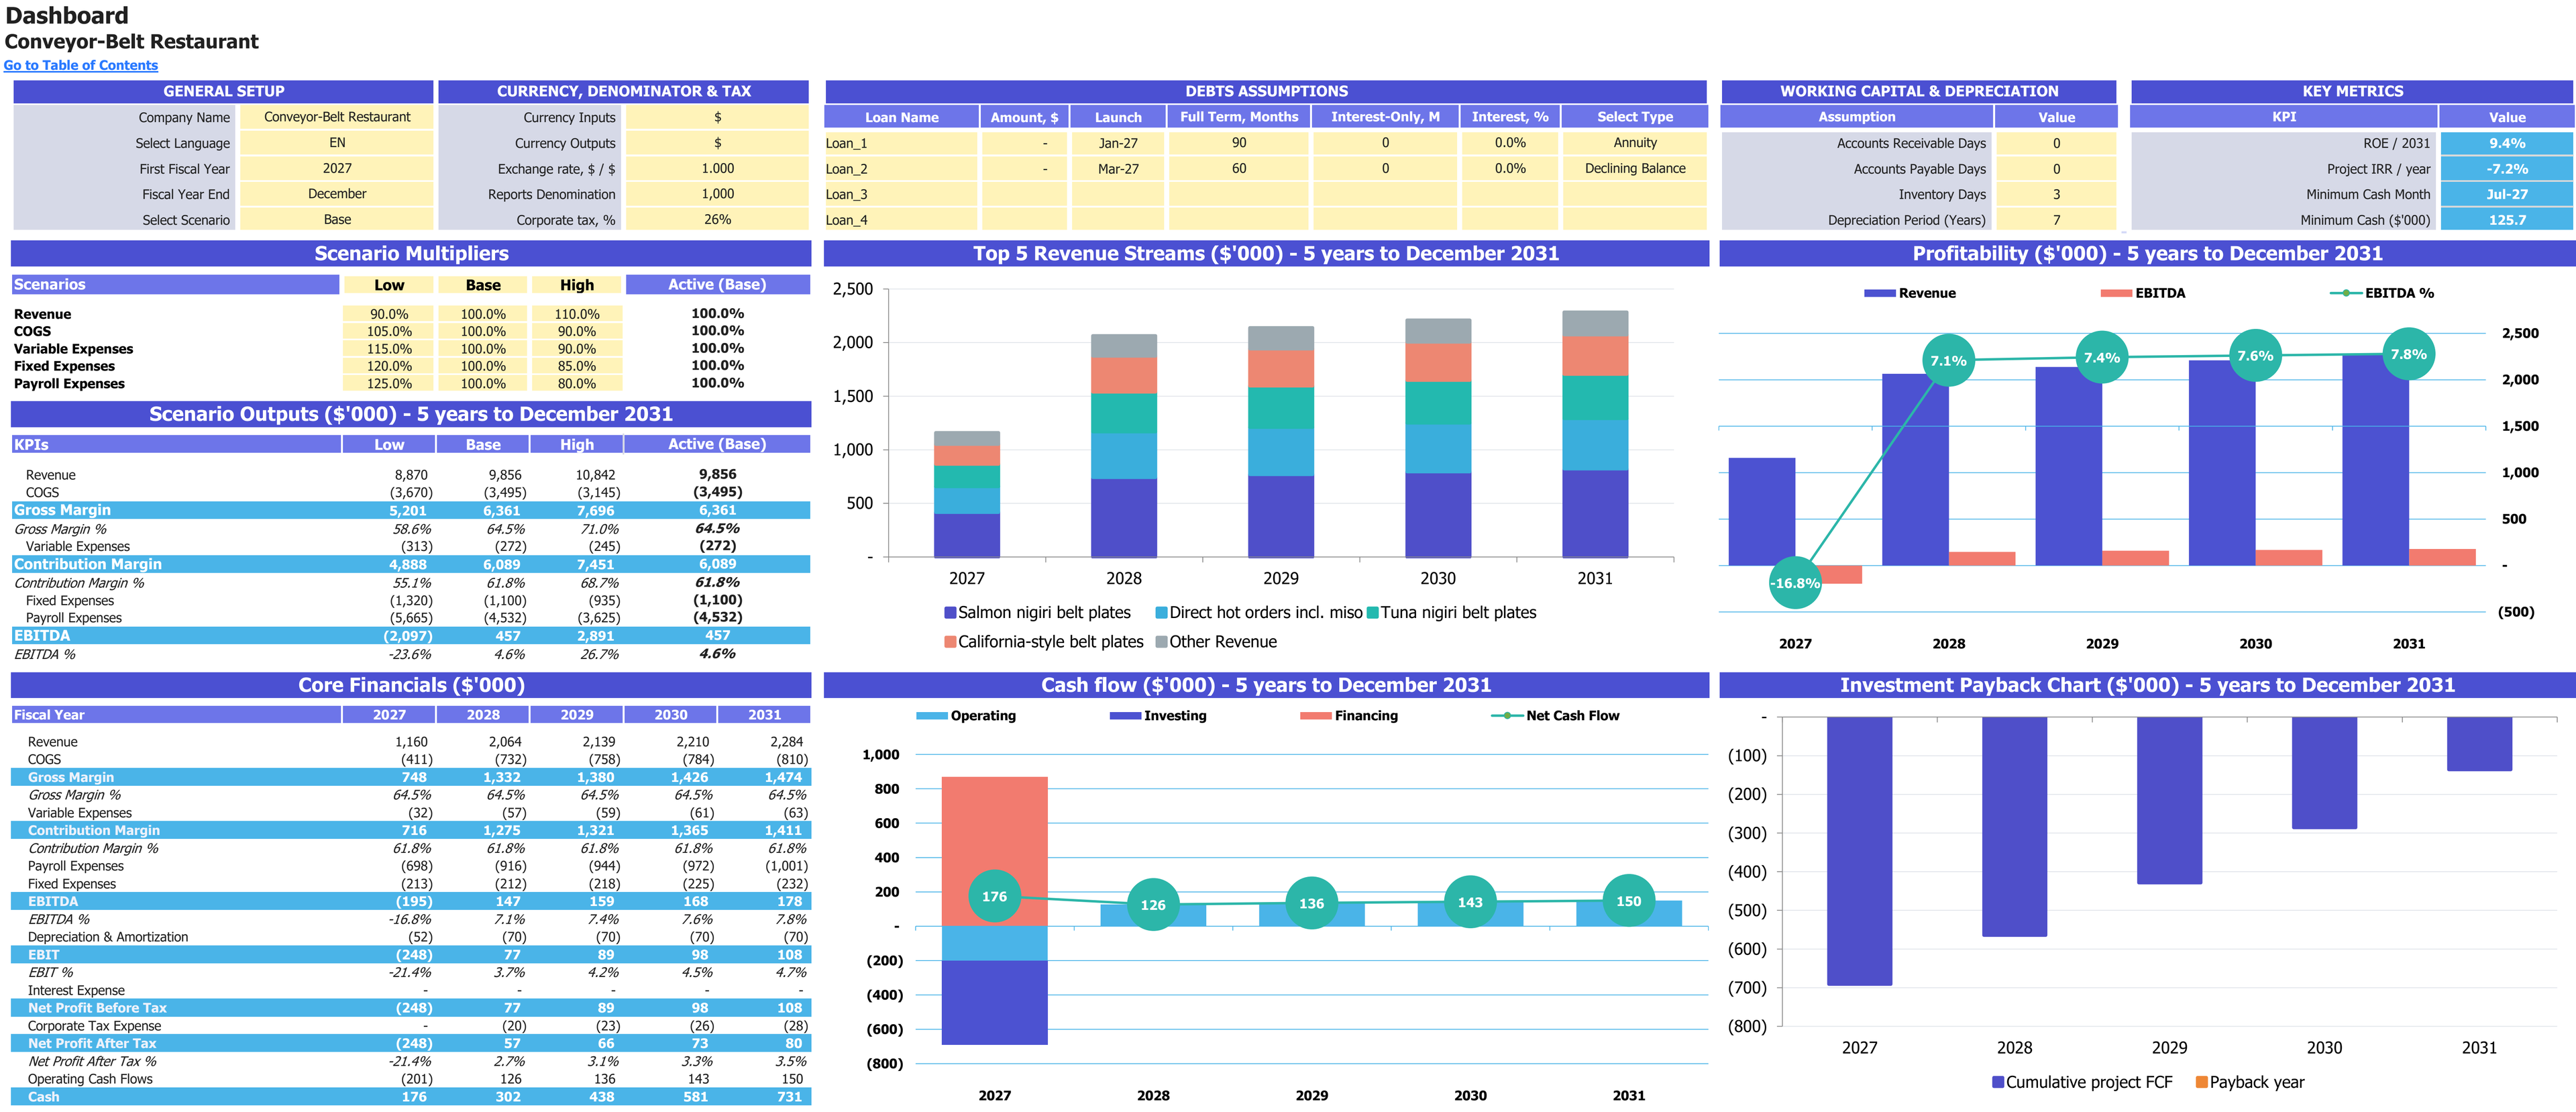
Base-case scenario controls, annual financial results and charts for 2027–2031. Financial report amounts are shown in thousands of USD; percentage measures retain their own units.
Enlarge image in a new tab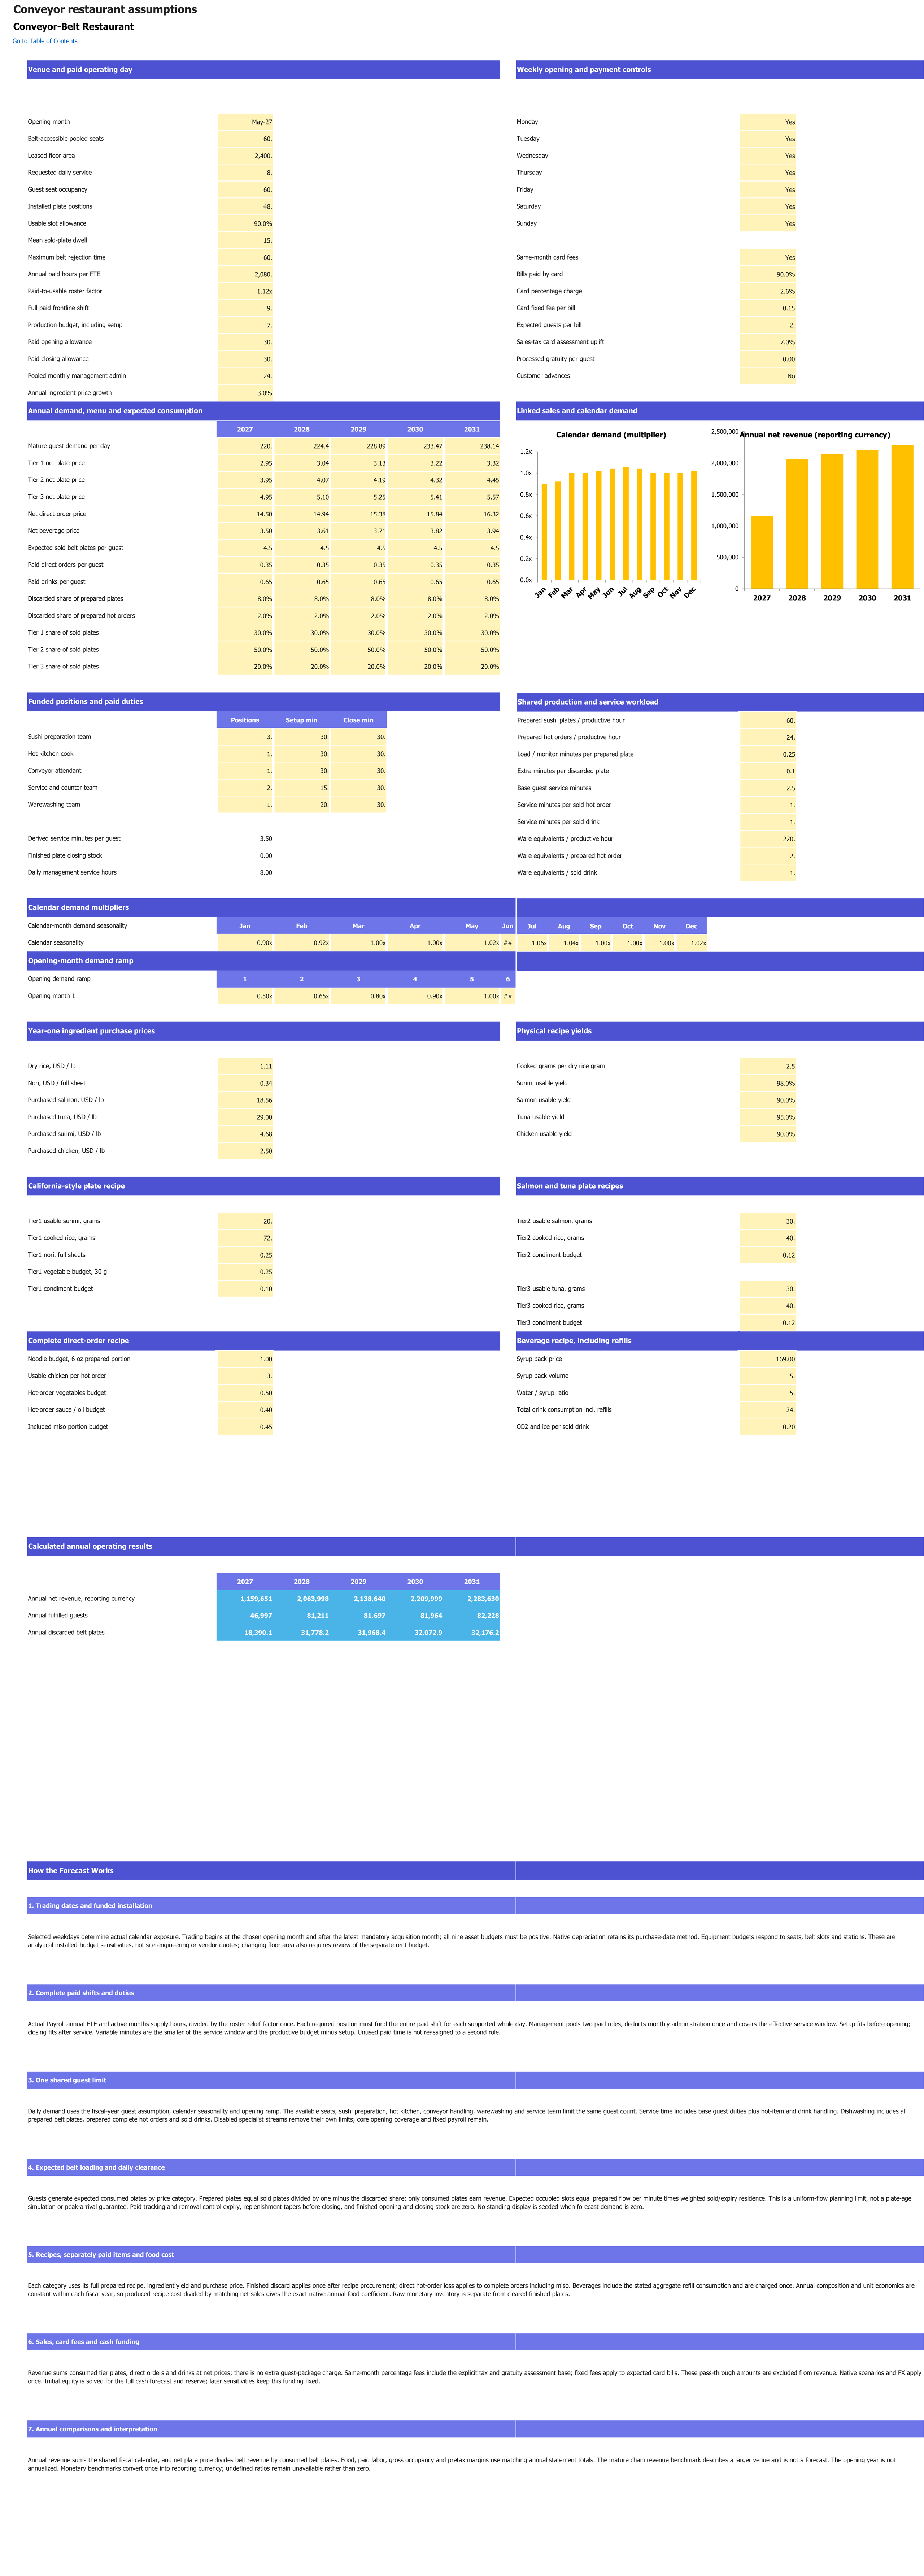
Plate categories, conveyor circulation, preparation and restaurant service assumptions. Monetary inputs and sales use USD; operating volumes retain their labelled units. Forecast years are 2027–2031.
Enlarge image in a new tab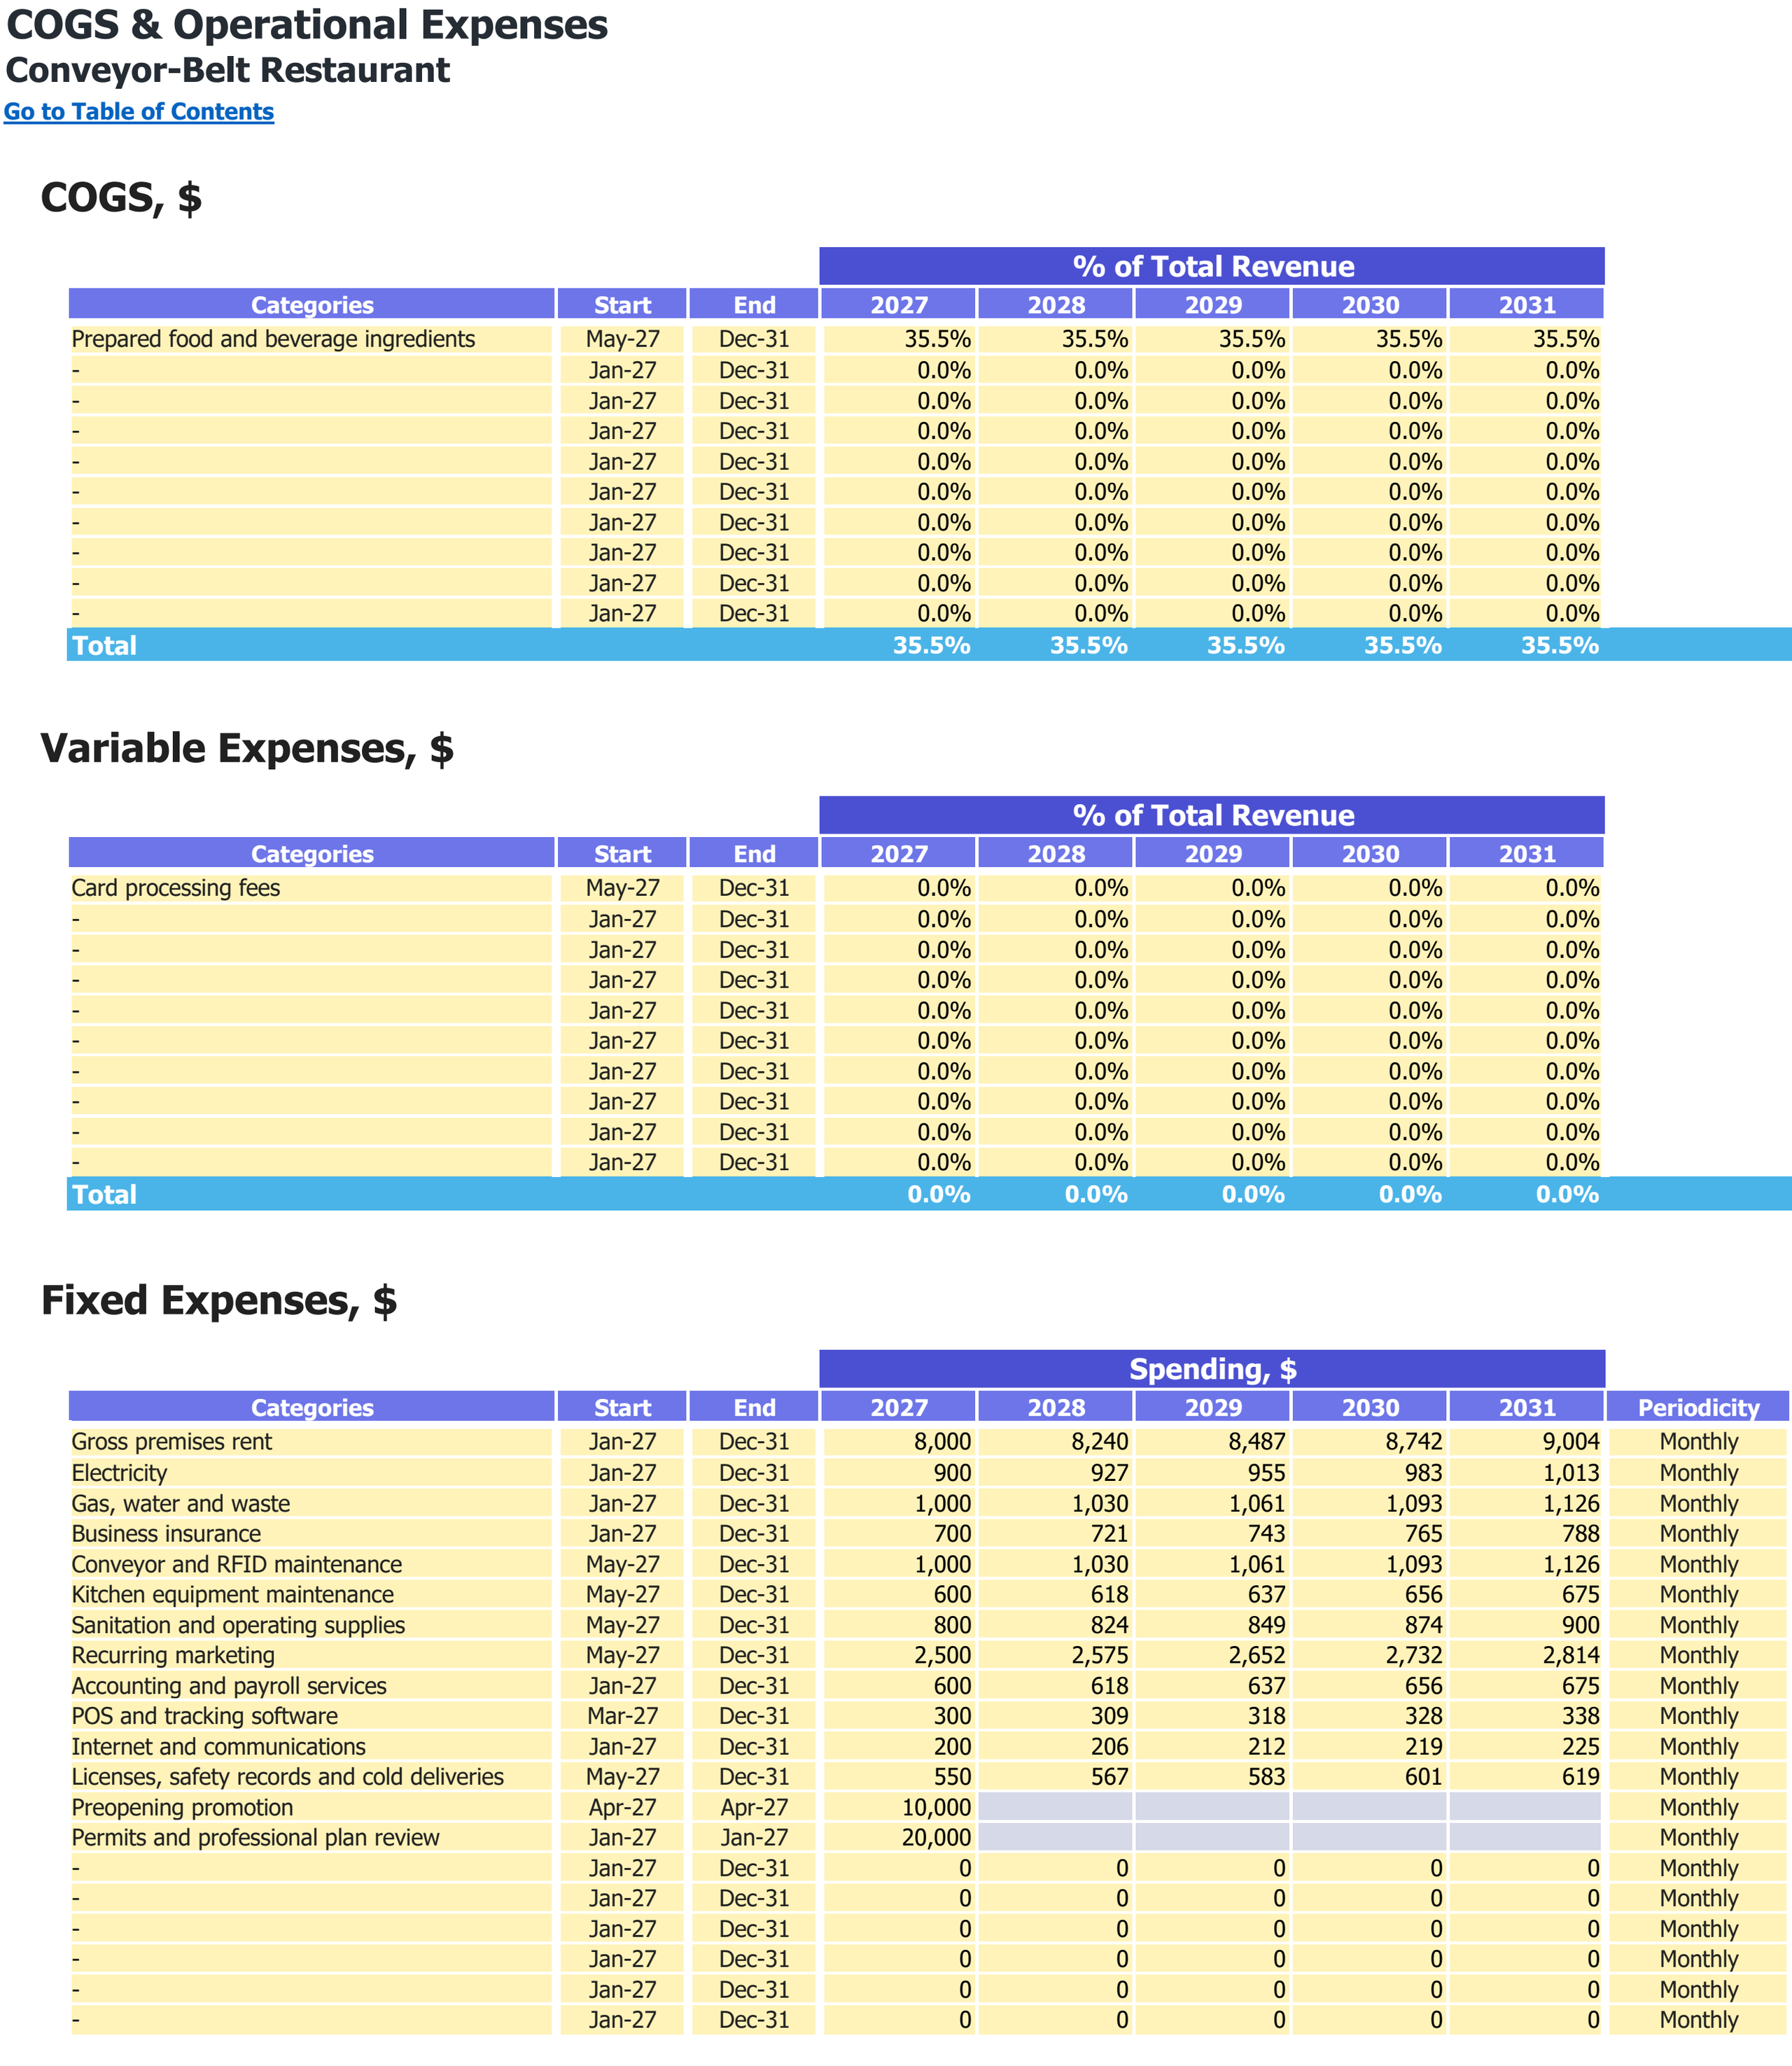
Food and other direct-cost categories, variable expense shares and fixed operating expenses. Monetary inputs are USD; the annual percentage columns are cost shares of revenue.
Enlarge image in a new tab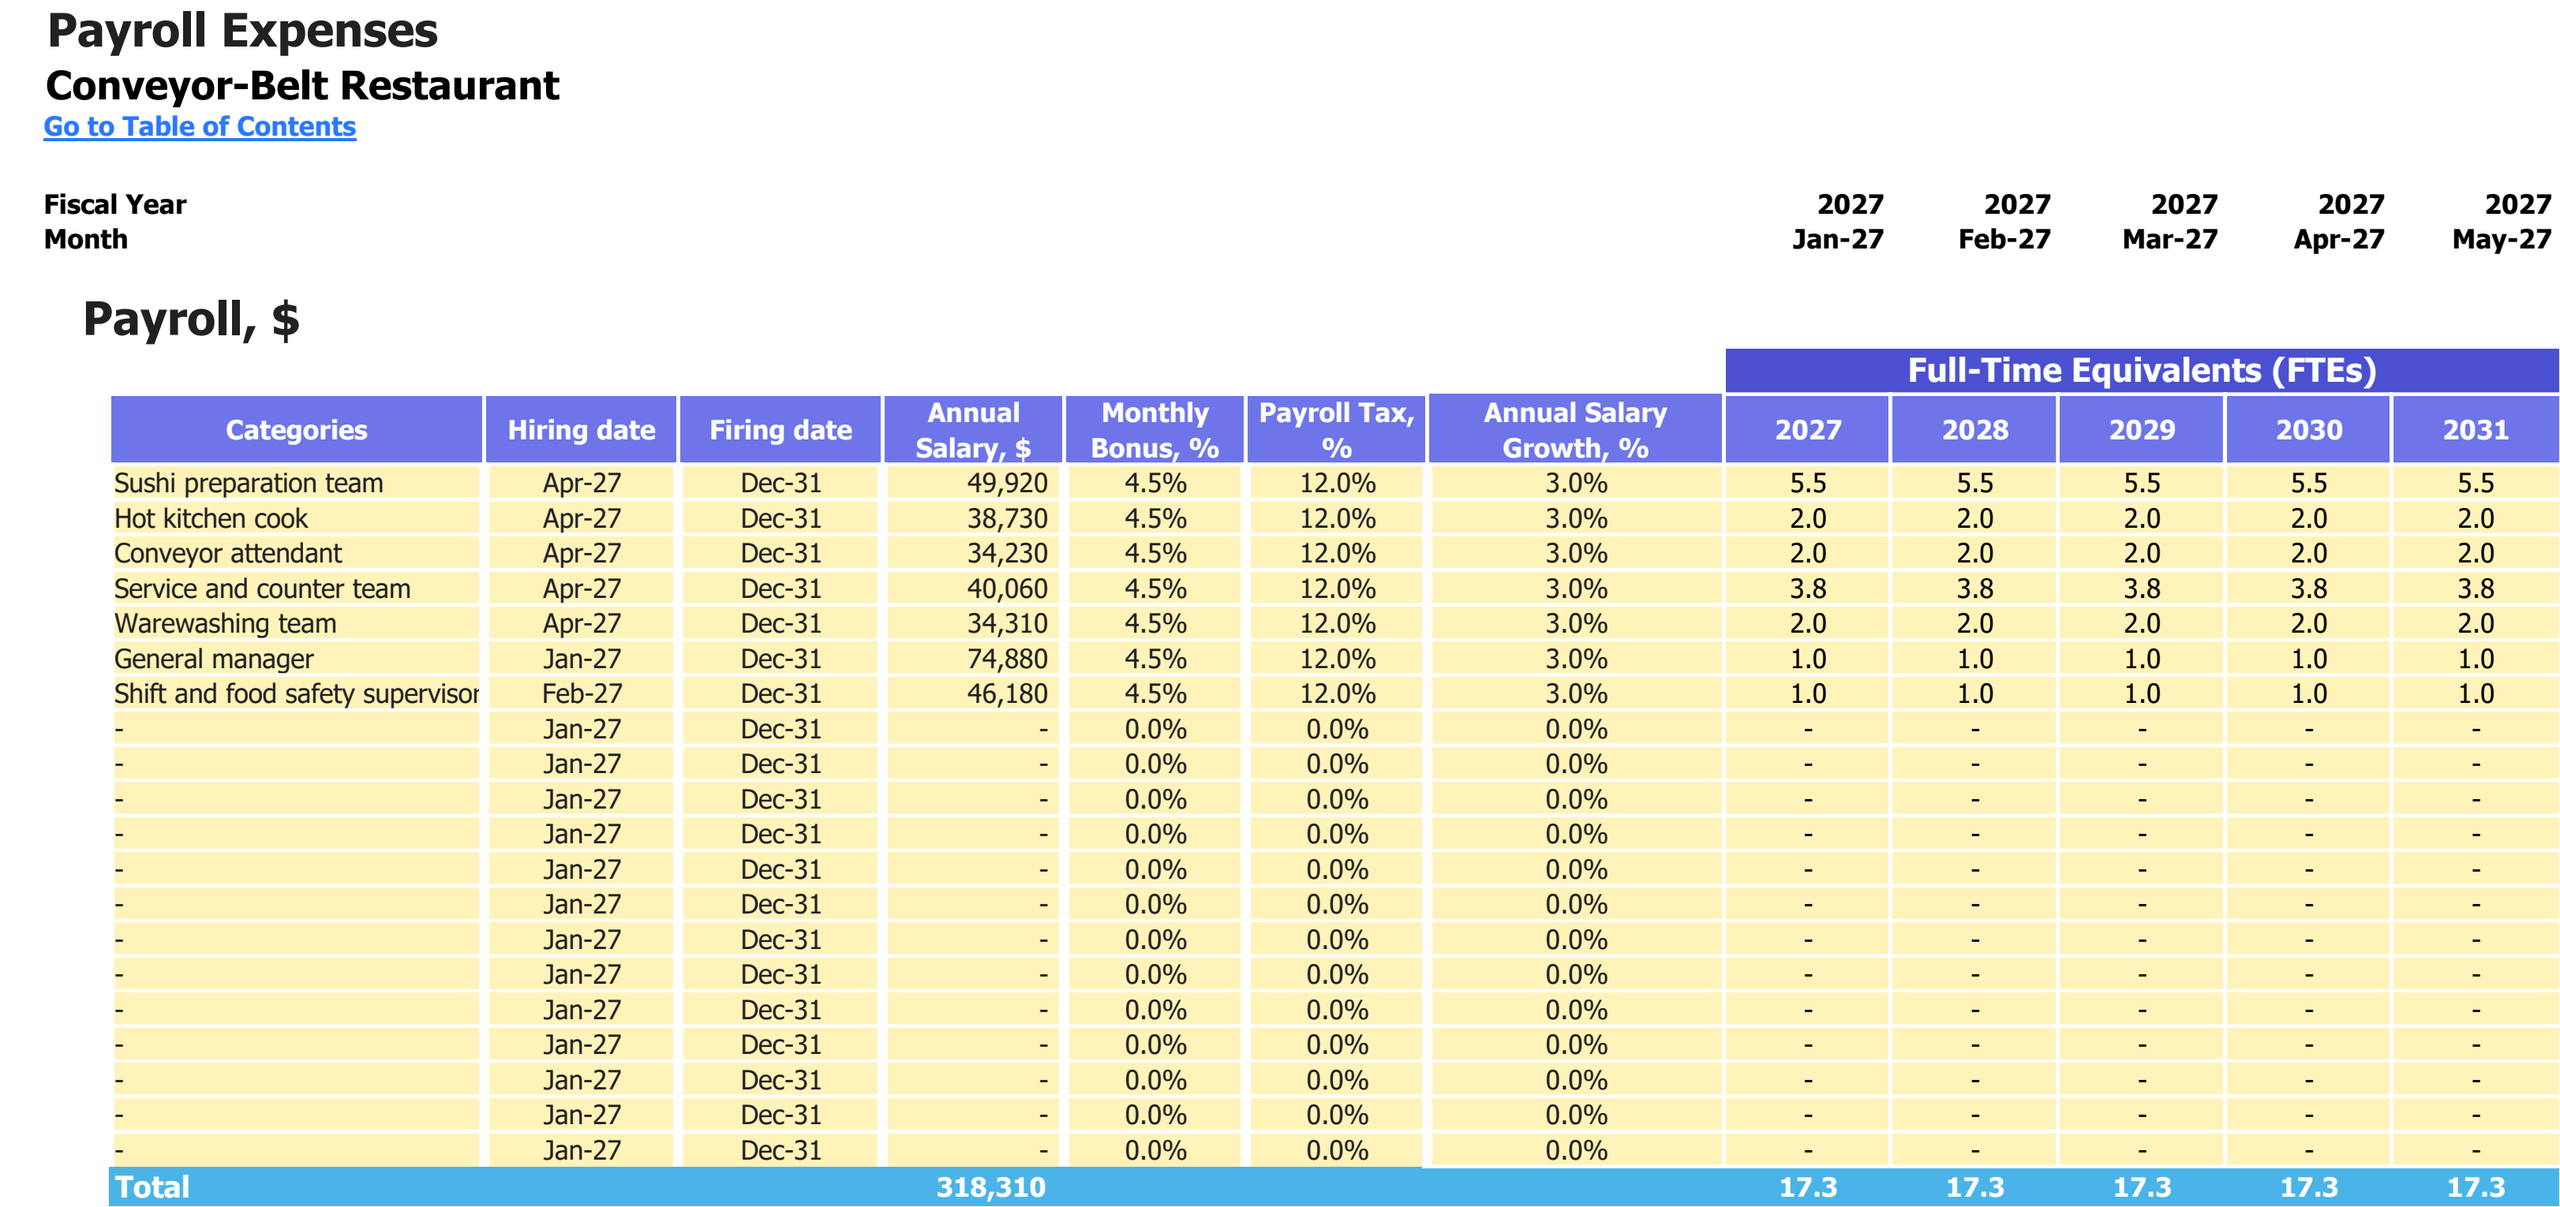
Paid roles, annual salary and employer-load assumptions, with staffing in full-time equivalents for 2027–2031. Salary amounts are USD; percentages and FTEs are labelled separately.
Enlarge image in a new tab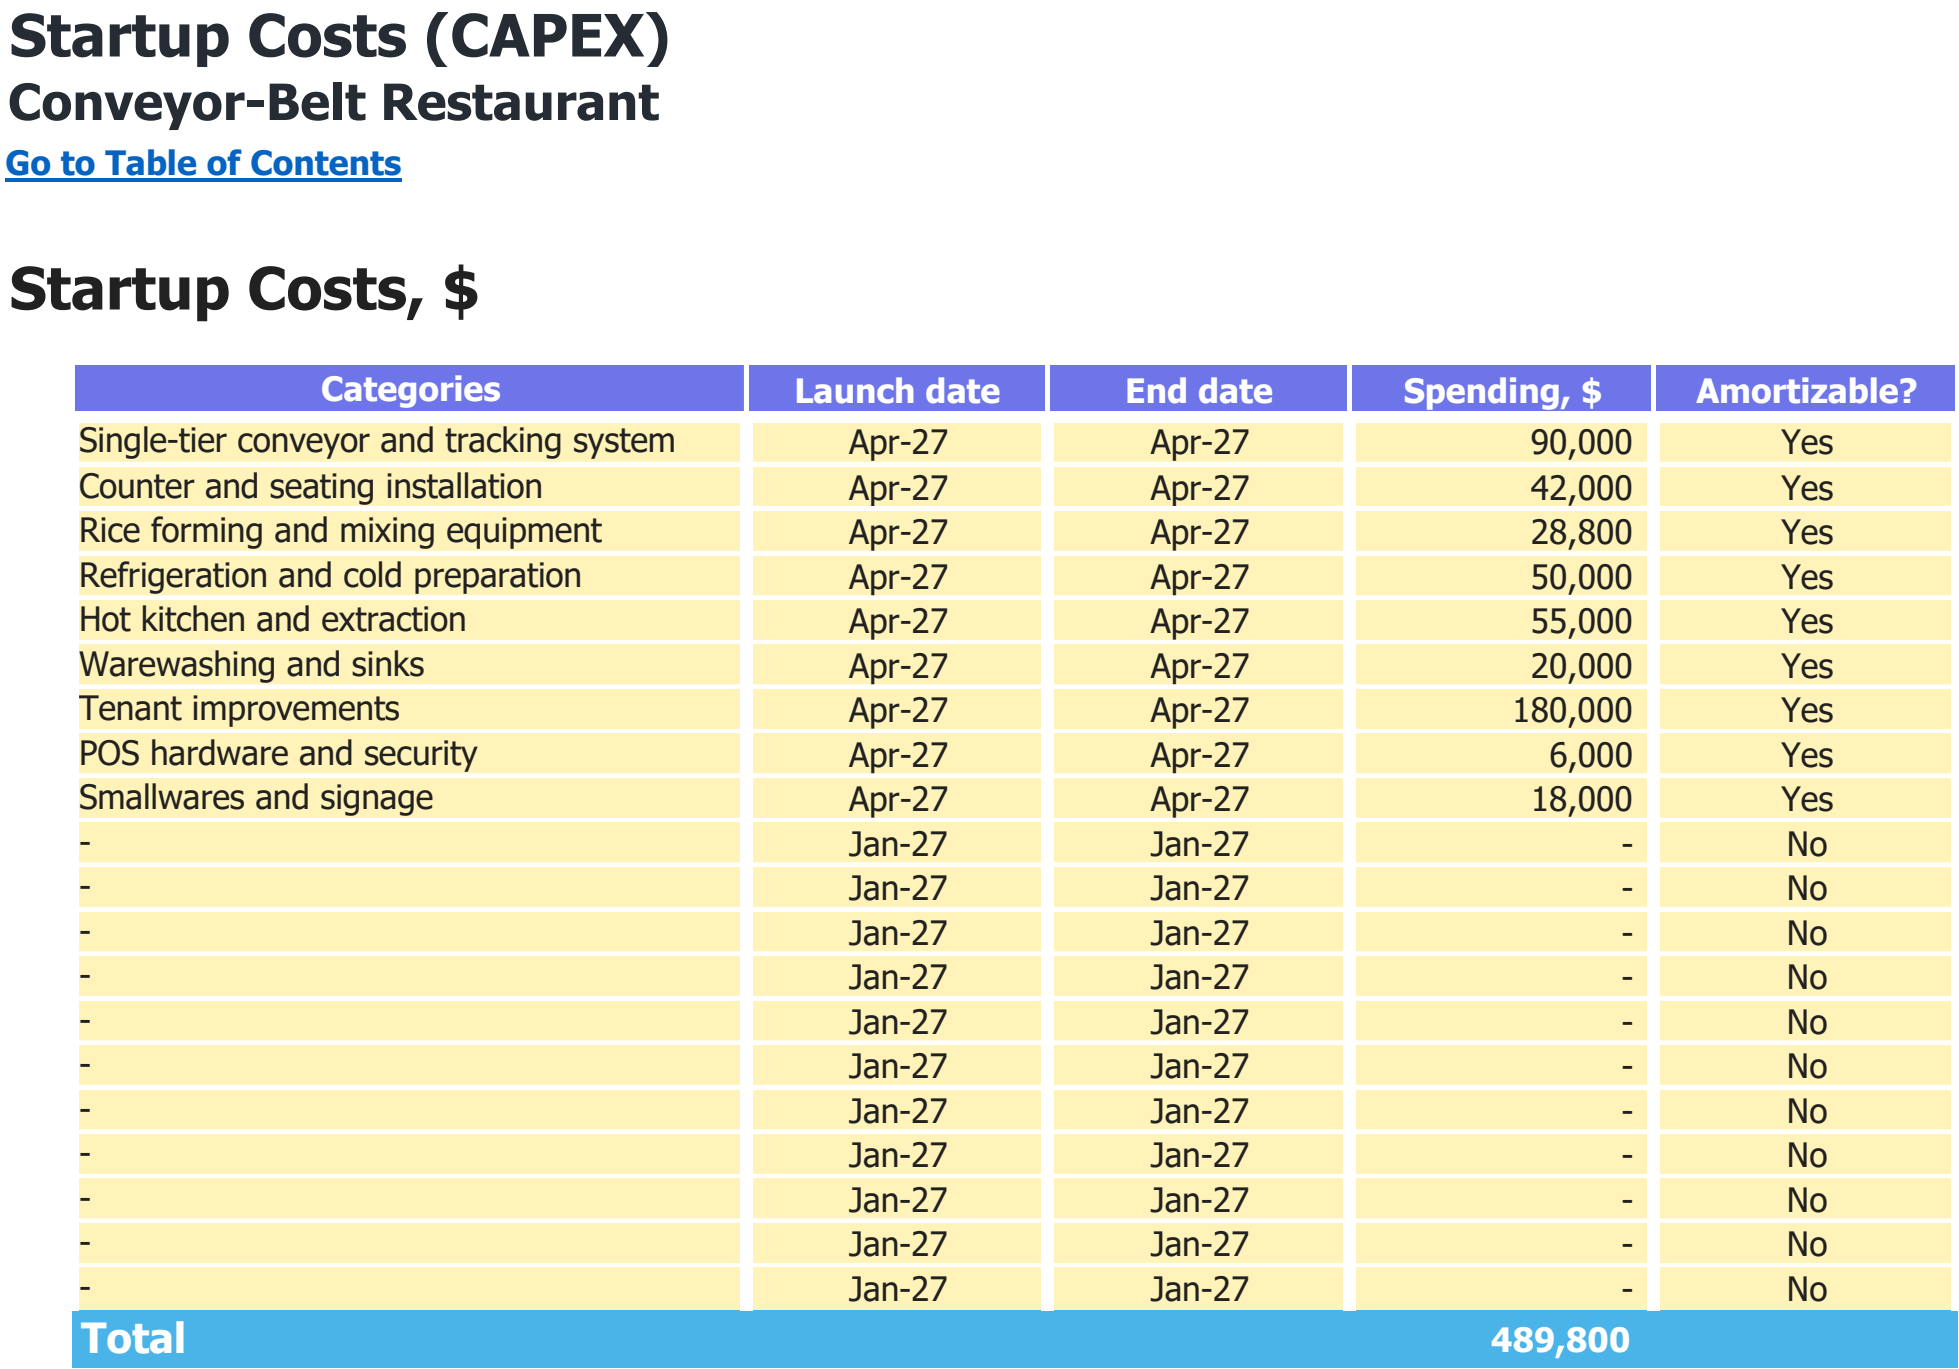
Asset categories, purchase dates and spending assumptions in USD. The total includes every scheduled purchase shown, including later replacements where present.
Enlarge image in a new tab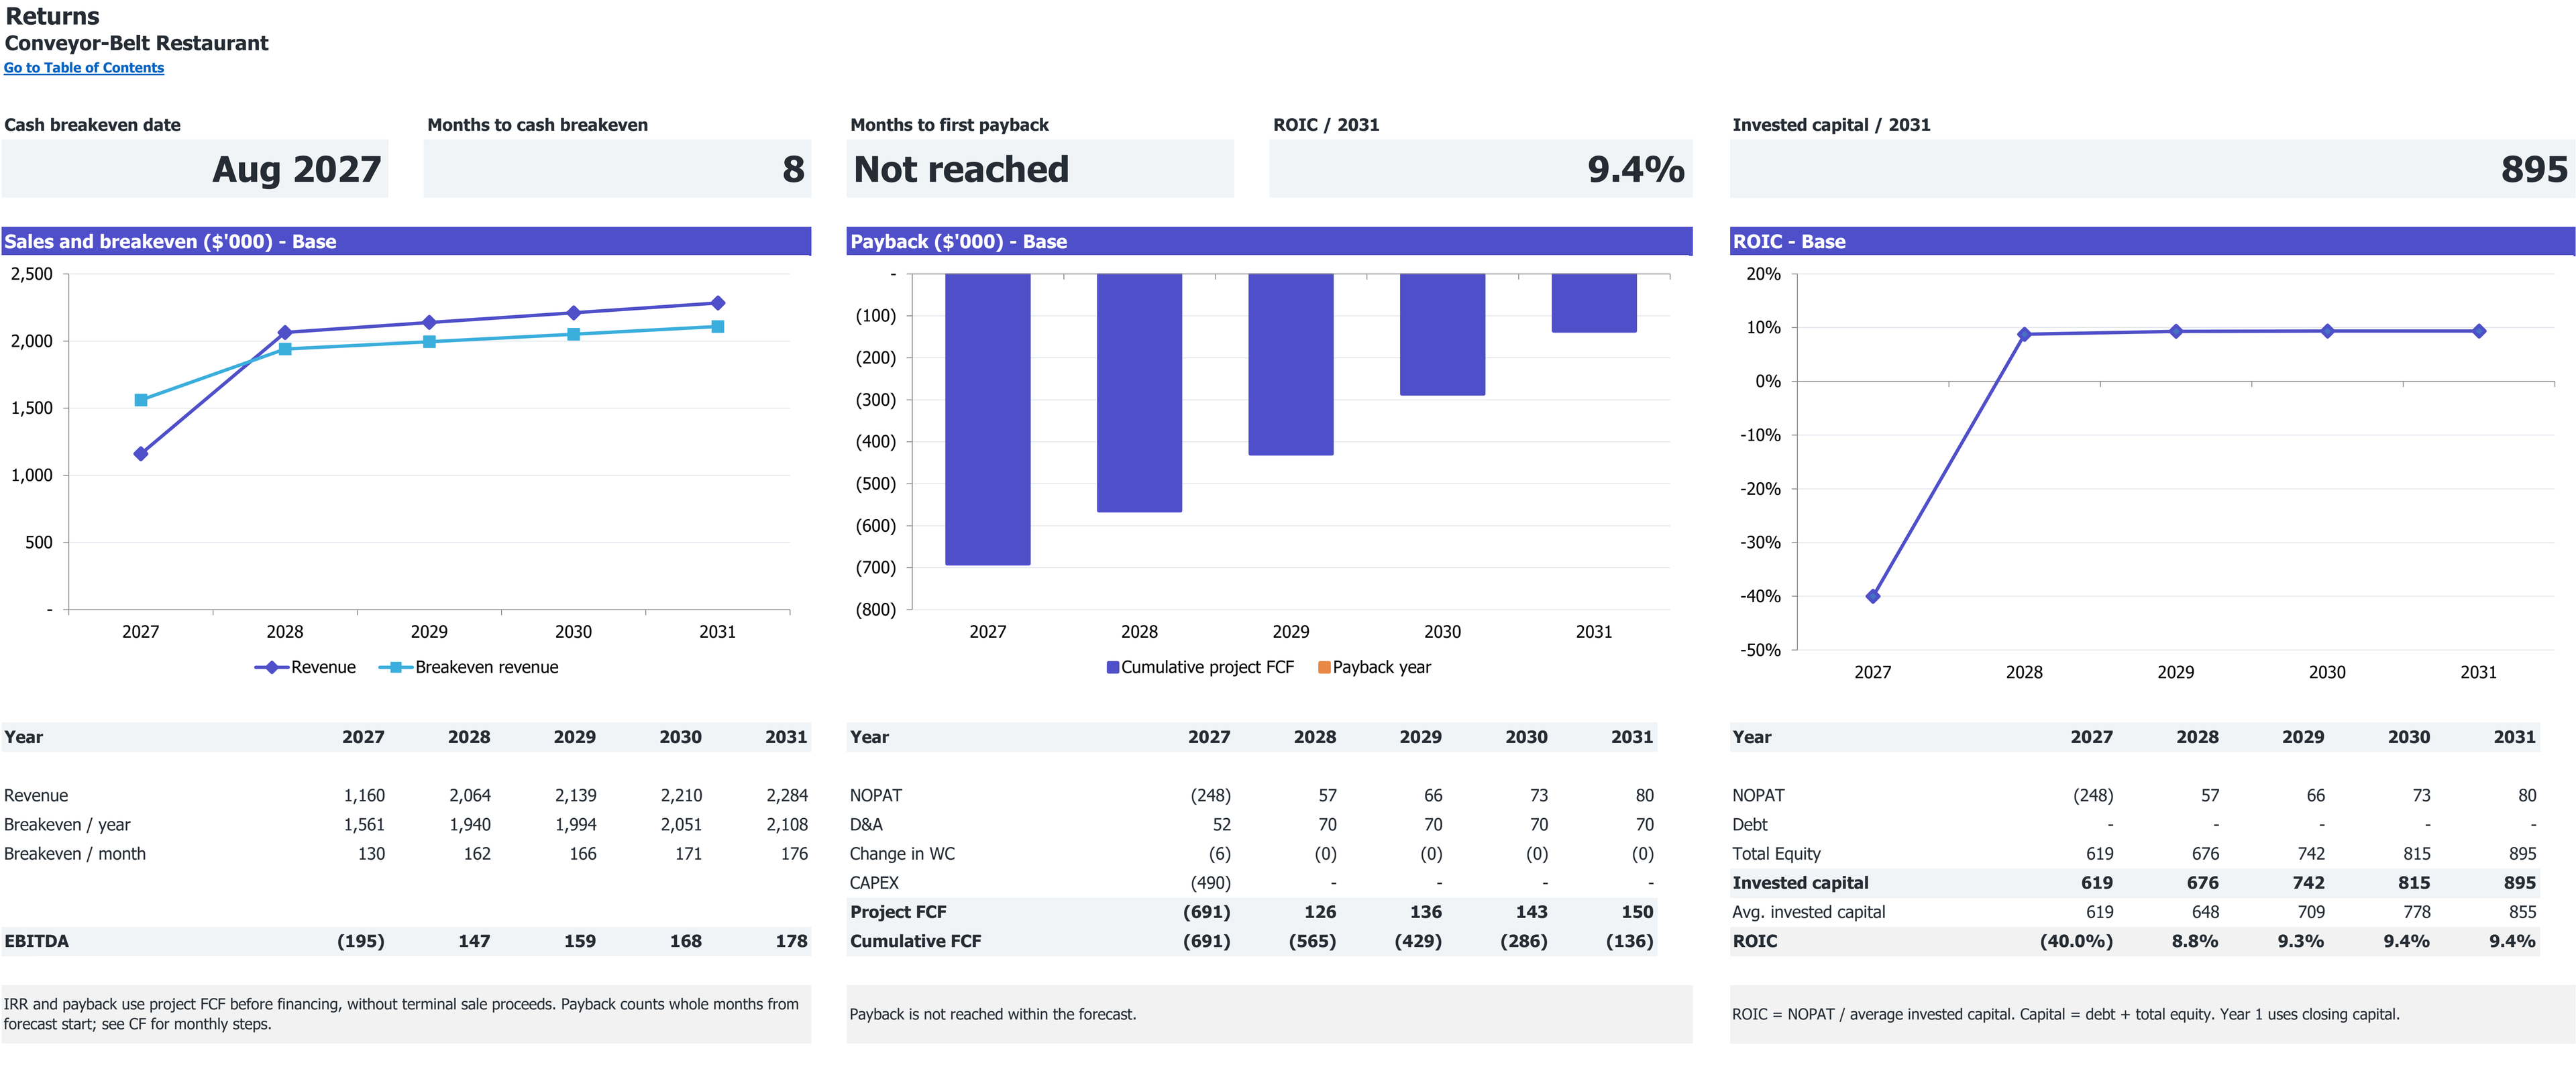
Excerpt from Returns: cumulative project free cash flow and first payback, if reached. 2027–2031 base case; dollar amounts in thousands.
Open full Returns view in a new tabExcerpt from Returns: revenue, annual and monthly break-even revenue, and EBITDA. 2027–2031 base case; dollar amounts in thousands.
Open full Returns view in a new tab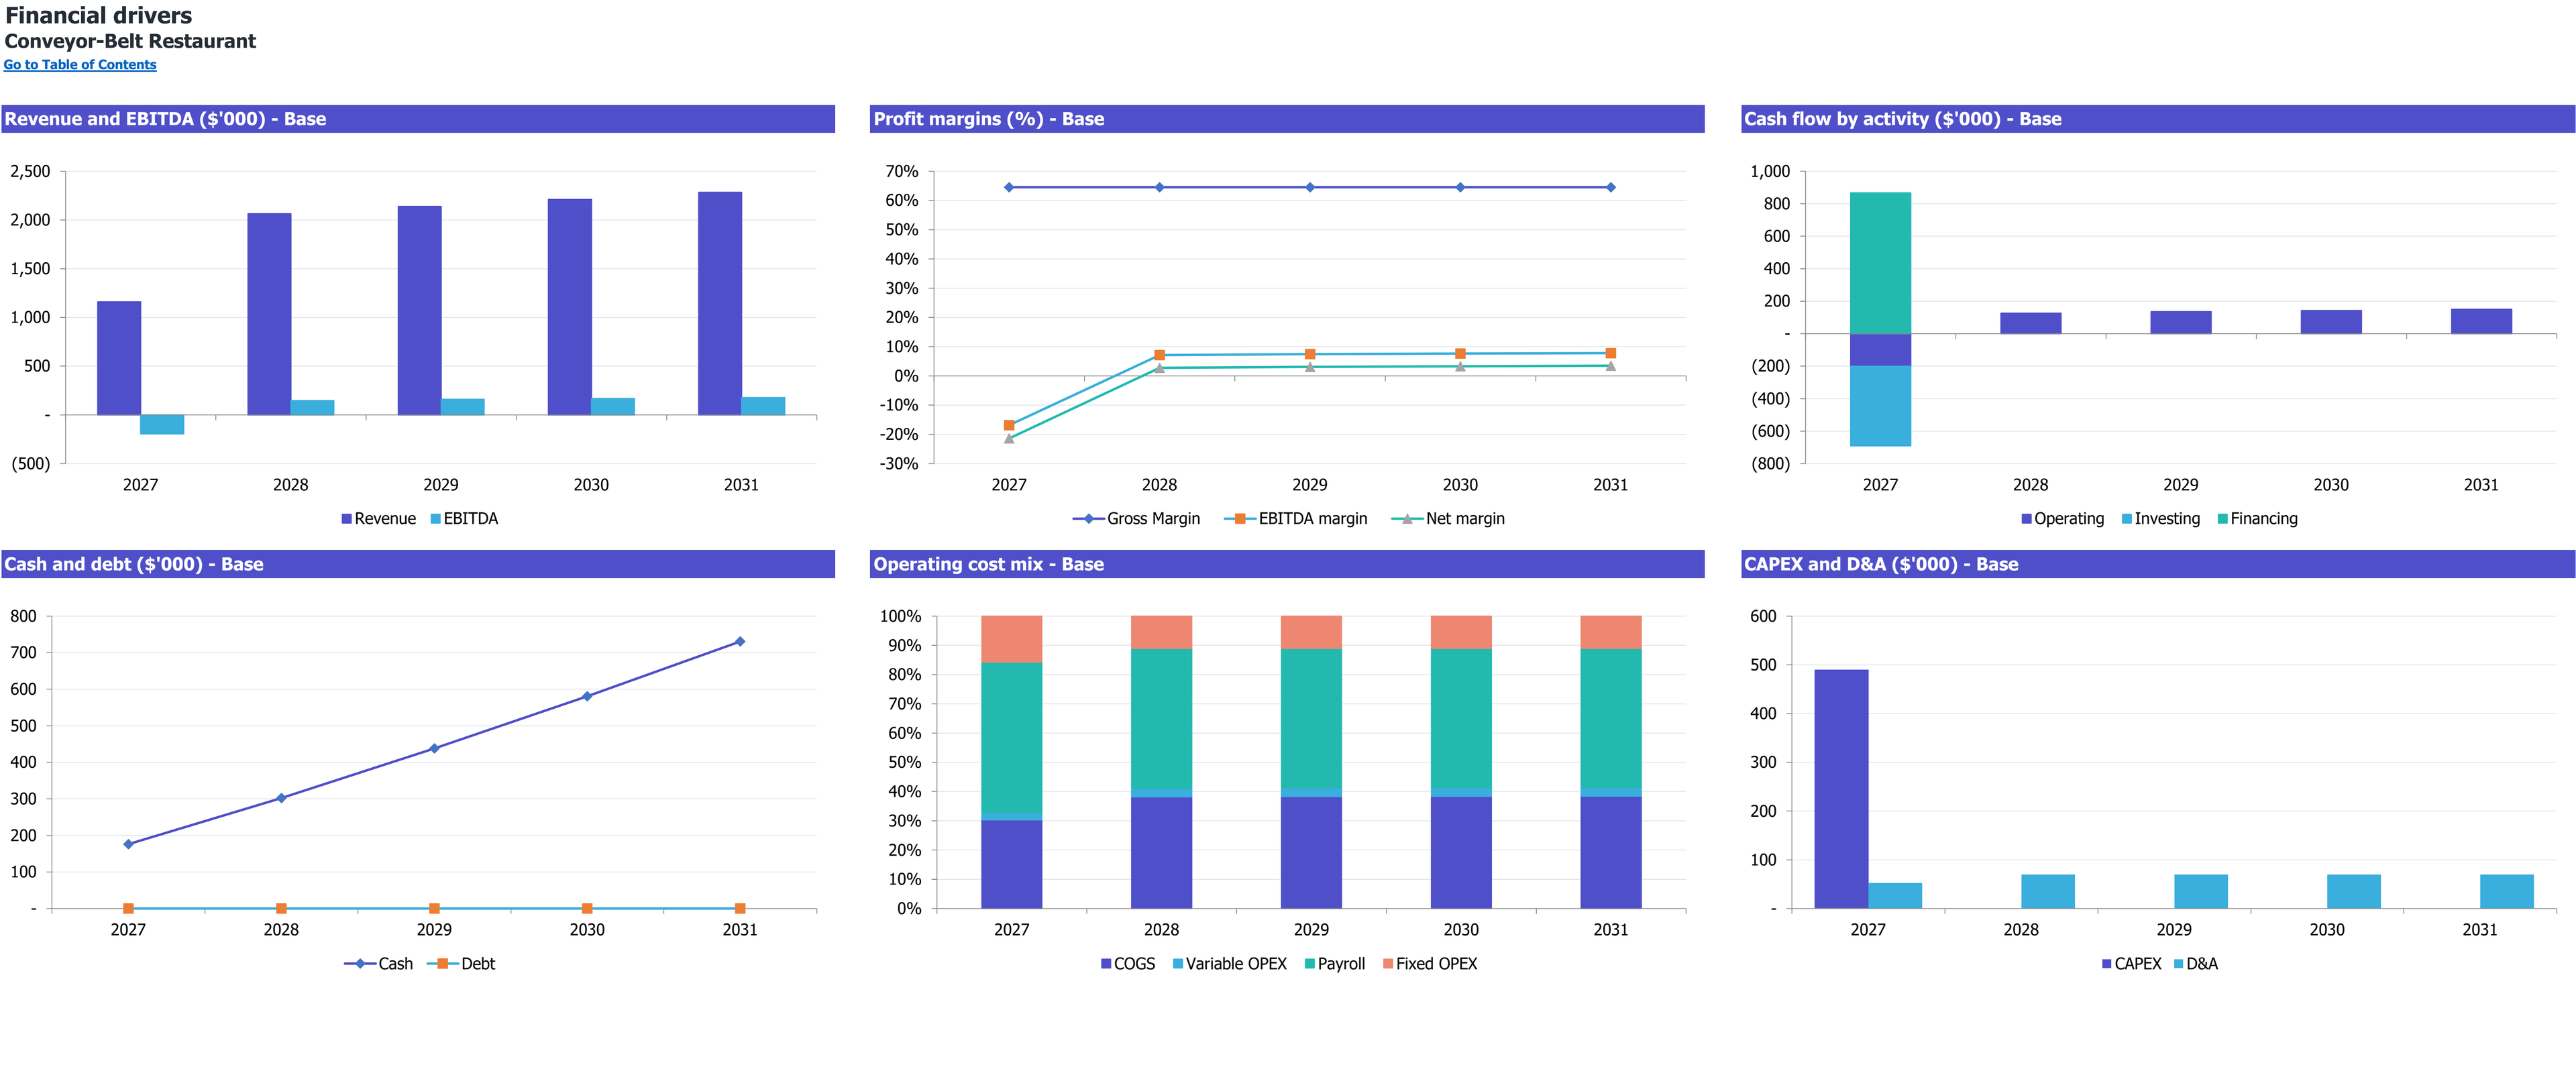
Six annual financial-driver charts for Conveyor-Belt Restaurant, 2027–2031 (Base scenario). Dollar amounts are in thousands; margins and cost mix are percentages.
Enlarge image in a new tab8 selected worksheet views. Figures show this workbook’s starting case.
Workbook overview
What is inside the Excel model
Follow consumed plates from production through the belt, service team and dish station. Connect discarded food and optional hot orders to costs while keeping funded cash separate from project recovery.
Selected worksheets from the documented workbook. Forecast period: January 2027–December 2031. Model reference: PHY001-16.
Inputs you control. Results you can inspect.
On a small screen, scroll within the table to read every column.
| Planning area | Inputs you review | How they connect | Results to inspect |
|---|---|---|---|
| Guest basket | 4.5 belt plates, 0.35 hot orders and 0.65 drinks per guest. | Apply tier prices and attachments once to served guests. | Initial expected net revenue of $24.675/guest. |
| Production loss | 8% belt discard and 2% hot-order discard, each measured against production. | Gross sold quantities up by survival rates. | Prepared, sold and discarded quantities. |
| Flow limits | 15-minute sold dwell; 60-minute selected expiry; 48 positions. | Combine expected residence with staffed production, service and washing. | 227 whole-guest baseline daily ceiling before demand. |
| Staffing | 17.25 FTE with one paid April training month for frontline roles. | Fund actual calendar days and task minutes after relief. | Payroll and feasible service coverage. |
| Startup | $489,800 installed CAPEX; $867,000 equity; no debt. | Cover all monthly project uses and a $125,000 cash reserve. | Liquidity and cumulative project cash shortfall. |
Is this the right model for your business?
Check the starting case before changing the assumptions.
The starting operation
- An independent venue billing consumed conveyor plates.
- An operator combining plate sales with hot orders and drinks.
- A founder testing waste and shared workloads against installed capital.
Check the boundary
The case excludes all-you-can-eat admission, a second complete-guest charge, finished-stock carryover, debt and customer advances.
Compare the other restaurant typesHow this business makes money
Connect the unit sold to the resources required by this operating case.
Revenue logic
Consumed belt plates by price tier, plus separately purchased hot orders and drinks.
Prepared or discarded plates earn no sales; included soup and refills are not additional paid units.
Why can a restaurant with spare seats still hit its conveyor capacity?
Plates occupy belt positions while they circulate, and every produced plate also uses preparation, handling and dishwashing resources. Optional hot food and drinks add shared work. Spare seats therefore do not establish spare production capacity.
- Belt stock
- 48 positions with expected weighted residence
- Production loss
- 8% of prepared belt plates
- Shared work
- Service and washing include attached products
What to establish for your own operation
- Measure plate consumption, residence and discard together.
- Check service and washing when changing product attachment.
- Reassess payroll downside and fixed-equity reserve coverage.
Follow the plan from demand to cash
Open each section for the assumptions, calculations, and limits of this workbook’s starting case.
Keep sold plates separate from belt inventoryRevenue
The starting basket contains 4.5 plates at a fixed 30%/50%/20% price-tier mix, plus optional hot food and drinks. Initial plate prices are $2.95, $3.95 and $4.95. The separately billed hot order includes miso; no additional soup sale is counted.
Forty-eight belt positions are different from sixty diner seats. Expected plate residence, sushi output, hot preparation, belt handling, service and dish work all constrain guests. The saved belt ceiling is tighter than the seat-only capacity.
- Only consumed plates and sold attachments earn revenue.
- No minimum display stock is produced on a zero-demand day.
- Expected-flow limits do not simulate individual plate ages or customer queues.
Cost discarded production oncePayroll
An 8% discard rate of production means prepared plates equal sold plates divided by 0.92. Complete hot orders use a separate 2% prepared-order discard allowance. Ingredient usable yields precede those finished-item losses.
The 17.25-FTE roster includes paid management, sushi specialists, hot cooking, belt handling, service and washing. Opening setup is included in productive budgets. Hot orders and drinks also consume service and warewashing capacity.
- Initial food and beverage cost is $8.749513 per guest.
- Finished opening and closing stock is zero under the selected daily policy.
- Recipe and discard economics are planning assumptions, not food-safety approval.
Fund the conveyor system and all required assetsCAPEX
April installed CAPEX totals $489,800 across nine mandatory bundles. Conveyor tracking, seating, rice equipment, refrigeration, hot kitchen, warewashing, fitout, POS and smallwares have explicit scale sensitivities. These are budget formulas rather than engineered quotations.
January equity is $867,000. It funds investment, preopening costs, operating losses and working capital while retaining a $125,000 reserve. Minimum cash is $125,665.22 in July 2027. No debt or later financing is assumed.
- All mandatory assets must be ready before service begins.
- Three inventory days are a raw-ingredient monetary proxy.
- Floor-area changes do not automatically scale the fixed rent input.
Assess the thin surplus against unrecovered capitalCF
Base 2027 revenue is $1,159,651 and EBITDA is −$195,303. Monthly EBITDA and operating cash first become nonnegative in August 2027, but later February losses recur.
Project payback is not reached within 60 months: cumulative undiscounted unlevered project cash ends at −$136,267. The positive closing cash balance contains retained initial equity and is not a measure of investment gain.
- A payroll-only 20% increase produces −$80,100 minimum cash with equity unchanged.
- The Low monetary case produces −$1,698,494 minimum cash.
- The higher-payroll test also has a disclosed native IRR convergence limitation.
Selected results from the starting case
Modeled results in USD unless stated otherwise. These describe the selected inputs, not an estimate for your location or a guaranteed outcome.
- 2027 revenue
- $1,159,651USD, Base; eight sales months after May opening.
- 2027 EBITDA
- −$195,303USD, Base; includes four preopening months.
- Initial CAPEX
- $489,800USD; installed April 2027 asset budgets.
- Minimum cash
- $125,665.22USD, funded Base balance in July 2027.
- Project payback
- Not reached within 60 monthsCumulative undiscounted project FCF ends at −$136,267 with no terminal sale.
Make the case your own
Work from the operating plan toward the cash requirement.
Enter plate tiers, basket mix and expected guest demand.
Validate residence, preparation and shared task assumptions.
Replace installed equipment, labor and premises allowances.
Review discarded production, recurring loss months and cumulative investment shortfall.
Interpretation and scope
- The US case does not establish local demand or construction feasibility.
- Expected flow does not validate plate ages, cold-chain controls or food-safety practices.
- Fixed annual mixes and recipes support the native food-cost relationship.
- The 26% tax allowance has no chosen jurisdiction or interyear loss carryforward.
- Native IRR can display n.a. in a valid higher-payroll stress despite a mathematical root; use its disclosed cash results.
The workbook is an Excel file for local planning. Learn how to interpret assumptions and evidence.
Other restaurant types
Each operating type calls for its own financial structure.
Questions
Are belt positions diner seats?
No. They are physical locations for circulating plates.
Is discard 8% of sales?
No. It is 8% of production; prepared quantities equal sold plates divided by 0.92.
Does included miso earn another sale?
No. It is part of the complete hot order.
Does the first positive cash month establish sustained break-even?
No. Later February operating cash losses occur.
Does n.a. IRR mean no economic loss?
No. The disclosed higher-payroll case has a native numerical limitation and a negative cash balance.
What if a purchased file is damaged or cannot be downloaded?
See the refund and replacement policy for file correction, replacement and download assistance. Keep the product name and your order reference when requesting help.
Which software does the workbook use?
The documented file is an Excel workbook (.xlsx). Compatibility with other spreadsheet applications is not established by the file extension.
Read the planning guides
Explore the relevant operating questions and how to interpret a workbook’s assumptions.
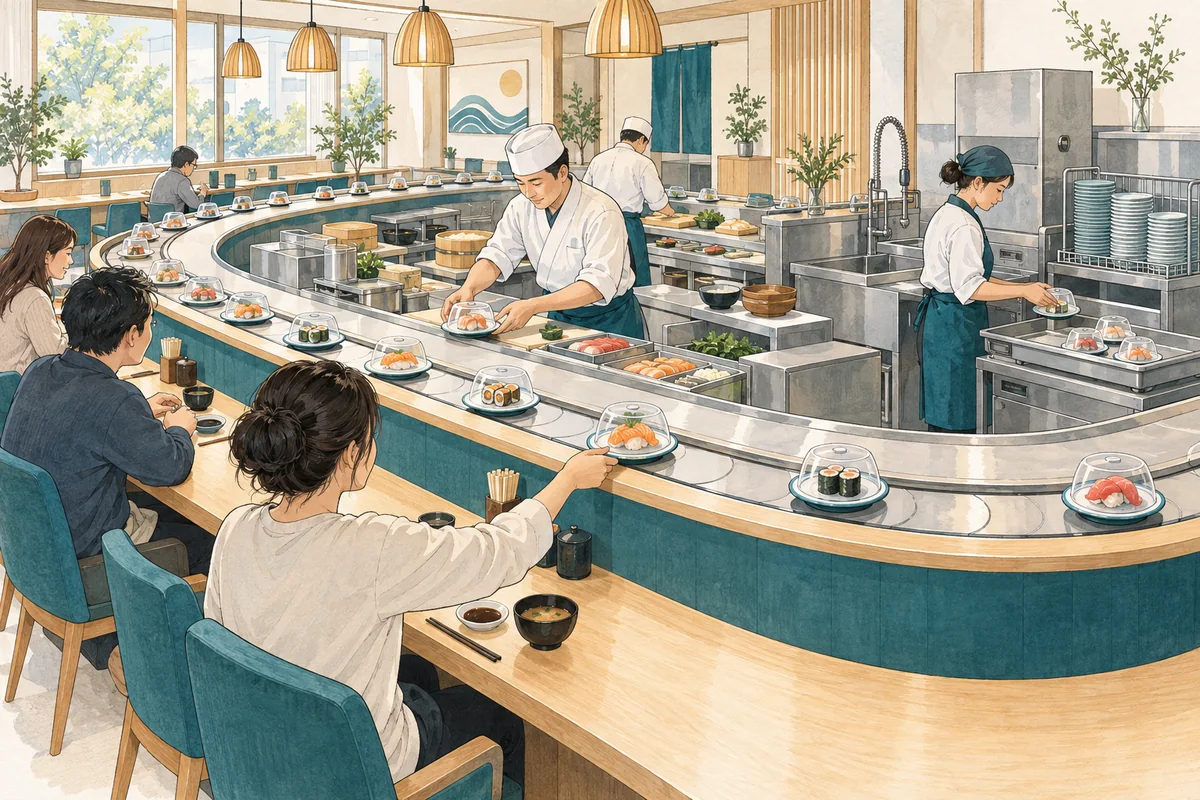
How do belt plate sales, discard and circulation limit a conveyor restaurant?
Separate sold plates from production and discard, then compare belt residence, staffed preparation, service, and dishwashing limits in a conveyor restaurant.
Read the guide
How to read financial assumptions before editing an Excel model
Follow the chain from operating assumptions to calculated results, check units and timing, and keep a useful record of changes to a financial workbook.
Read the guideEvidence and scope
Primary operator examples support only the operating features described in the source registry. This full configuration, all formulas, local feasibility and numerical economics remain analyst-authored and unverified.
The links below provide operating-format context; they do not verify the workbook’s selected inputs or calculated returns.
The workbook guide and figures describe model PHY001-16, revision r02, for January 2027–December 2031. These are a documented planning case, not observed results for a particular business.