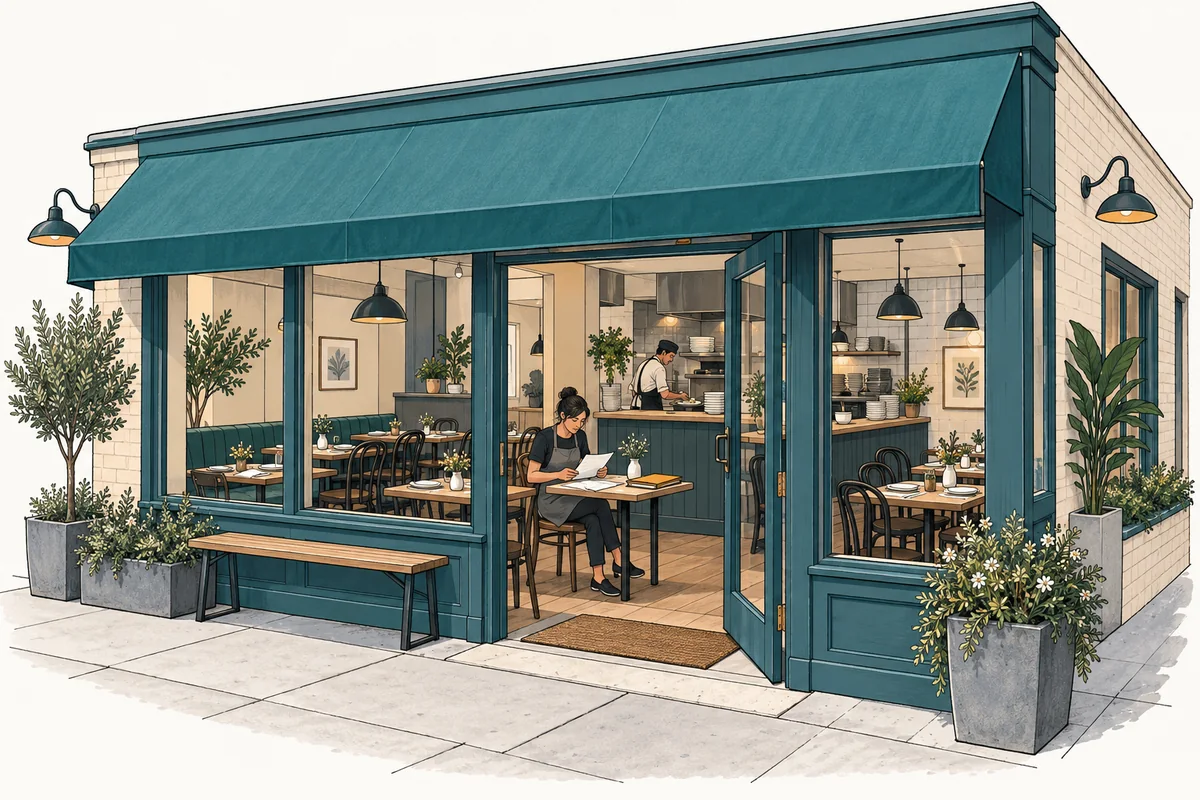
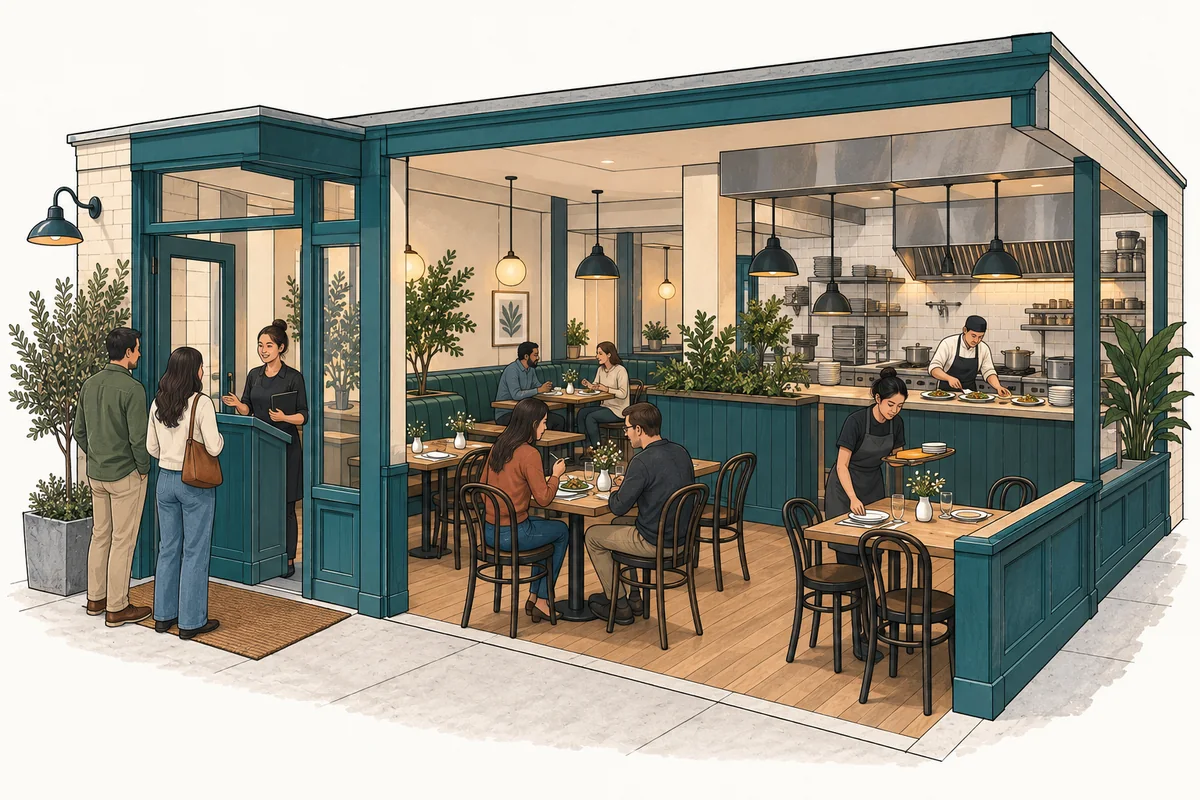
The selected U.S. case uses 2027 Base inputs for a 24-seat self-service restaurant with two weighing and checkout endpoints. Dine-in and takeaway customers share production and checkout resources. Its weights, yields, prices, and staffing are planning assumptions, not measured national averages.
Which kilograms create sales revenue?
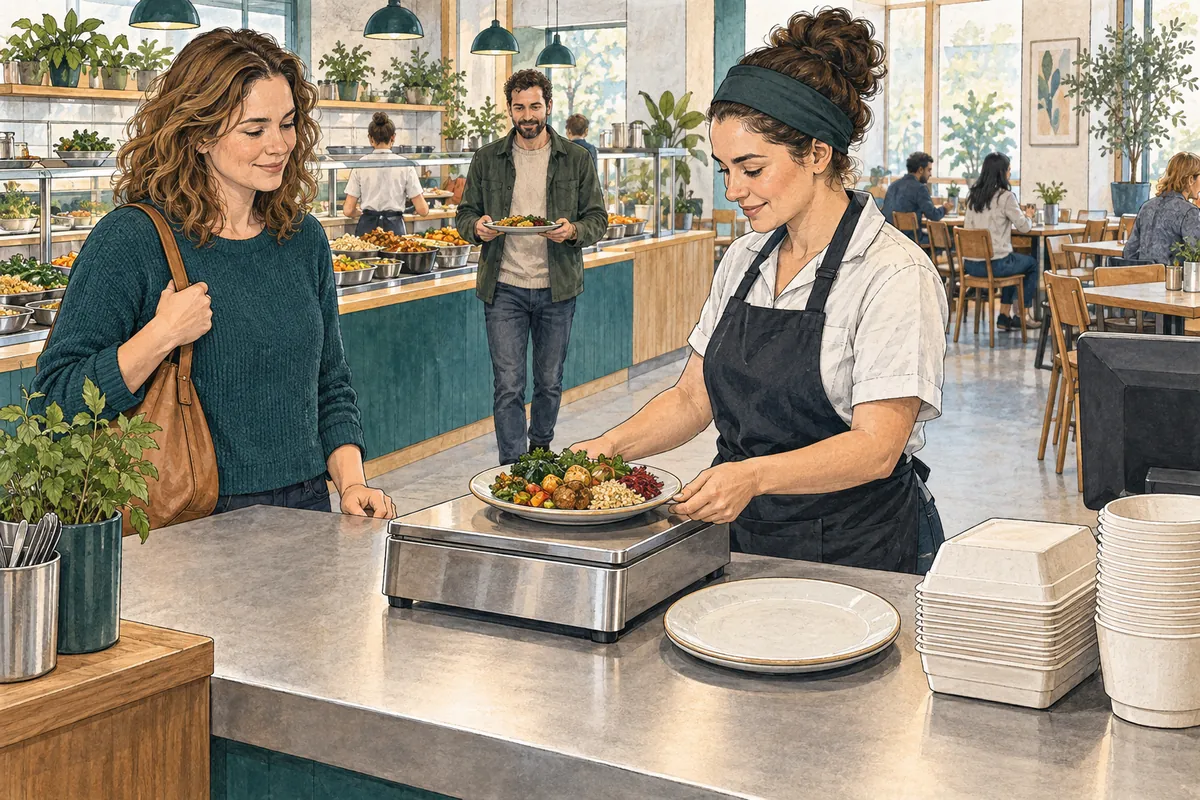
The dine-in example starts with 0.75 kg of gross weight and deducts a 0.25 kg plate, leaving 0.50 kg of food. Takeaway starts with 0.68 kg gross and deducts a 0.03 kg container, leaving 0.65 kg. At the selected net price of $24 per kilogram, those transactions earn $12.00 and $15.60 respectively.
The transaction count is a workload and packaging driver; it does not earn an additional meal or admission charge. Likewise, tare does not become food revenue. These are average modeled portions, so the case does not simulate individual scale increments or every customer’s selection.
Before replacing the selected weights, keep the measurement basis consistent. A change in gross weight could reflect more food, heavier packaging, or both. Separate the two inputs before interpreting a higher apparent basket weight as additional demand.
How do production buffers and losses change food cost?
Planned prepared output equals eligible net food demand divided by 92% holding survival, then multiplied by a 1.05 production buffer. Actual production is still limited by kitchen and replenishment capacity. Raw ingredient withdrawal equals that actual prepared output divided by the 90% preparation yield.
An isolated example makes the stages visible. Suppose eligible demand is 100 net kilograms, production and checkout are unconstrained, and all 100 kilograms are sold. Applying the case’s selected inputs prepares approximately 114.130 kg. After 8% holding loss, 105 kg remains saleable, leaving 5 kg unsold. This is input arithmetic, not a recalculated month of the workbook.
On a narrow screen, scroll within the table to follow the kilograms from raw withdrawal to final use.
| Stage or destination | Calculation | Quantity | Revenue or cost treatment |
|---|---|---|---|
| Raw ingredient withdrawal | 100 ÷ 0.92 × 1.05 ÷ 0.90 | 126.812 kg | Ingredient cost recognized once |
| Preparation loss | Raw withdrawal − prepared output | 12.681 kg | Part of the withdrawal cost |
| Prepared output | 100 ÷ 0.92 × 1.05 | 114.130 kg | Intermediate quantity, not another purchase |
| Holding loss | Prepared output × 8% | 9.130 kg | No food sales revenue |
| Net food sold | Eligible demand fully served | 100.000 kg | Revenue at $24 per net kg |
| Unsold prepared food | Saleable output − net food sold | 5.000 kg | No sales or usable prepared carryover |
At full precision, raw withdrawal equals food sold plus holding loss, unsold prepared food, and preparation loss. Rounded table entries may not sum exactly. With the selected $6.20 raw-equivalent purchase cost per kilogram, this example uses $786.23 of ingredients. Adding a second expense for the same discarded food would count its purchase cost twice.
The 5% production buffer is separate from both yield losses. It is not 5% of all ingredients purchased. This case assumes zero usable prepared-food carryover at service close, while raw ingredient stock remains separate; that assumption describes the forecast’s economics, not a food storage instruction.
When can checkout capacity create unsold food?
Production depends on demand and the funded kitchen and replenishment resources before checkout limits are applied. The two physical checkout endpoints also need paid productive staff minutes. With a selected 1.25 minutes per transaction, the smaller of physical and staffed capacity limits how many transactions can finish.
A checkout constraint can therefore leave already-prepared food unsold. The common fulfillment fraction applies to both eligible channels, followed by whole-transaction rounding. Dine-in seating limits are applied earlier, and rejected dine-in customers do not automatically switch to takeaway. The model represents monthly resource allocation, not a simulation of lunchtime queues.
Use observations of scale handling, payment time, replenishment, and end-of-service waste to test those inputs together. Increasing production alone may enlarge unsold output when checkout is the limiting stage.
What does the food margin leave out?
Packaging, payment fees, paid labor, premises costs, capital spending, and financing still matter after food cost. The pay-by-weight restaurant model retains those expenses. In its selected January 2027–December 2031 case, later operating profits do not recover the investment: reported simple 60-month project cash ROI is −14.2%, and project payback is not reached.
That return uses cumulative undiscounted unlevered project cash flow divided by the absolute sum of negative monthly project cash flows. It is not an annualized investor return. Its adverse result demonstrates why a positive price-to-ingredient spread should not be presented as sufficient evidence of an attractive business.
Annual physical food costs reconcile with the financial expense schedules, but monthly allocations can differ because the retained schedules use annual revenue shares. Investigate food quantities in the operating calculation, then assess payroll, cash needs, and investment recovery across the full forecast before interpreting the margin.