
Restaurant Financial Model: Pay-by-Weight Self-Service Restaurant
Model net food weight after tare, batch production, unsold food, checkout labor and cash needs for a pay-by-weight restaurant.
- Excel (.xlsx)
- Starting footprint: 2,000 sq ft / 24 seats
- Checkout: Two weighing endpoints
- Schedule: Eight hours Tuesday–Sunday / March 2027 opening
- Base recovery: Project payback not reached within 60 months
Planning several types? Compare 17 restaurant formats
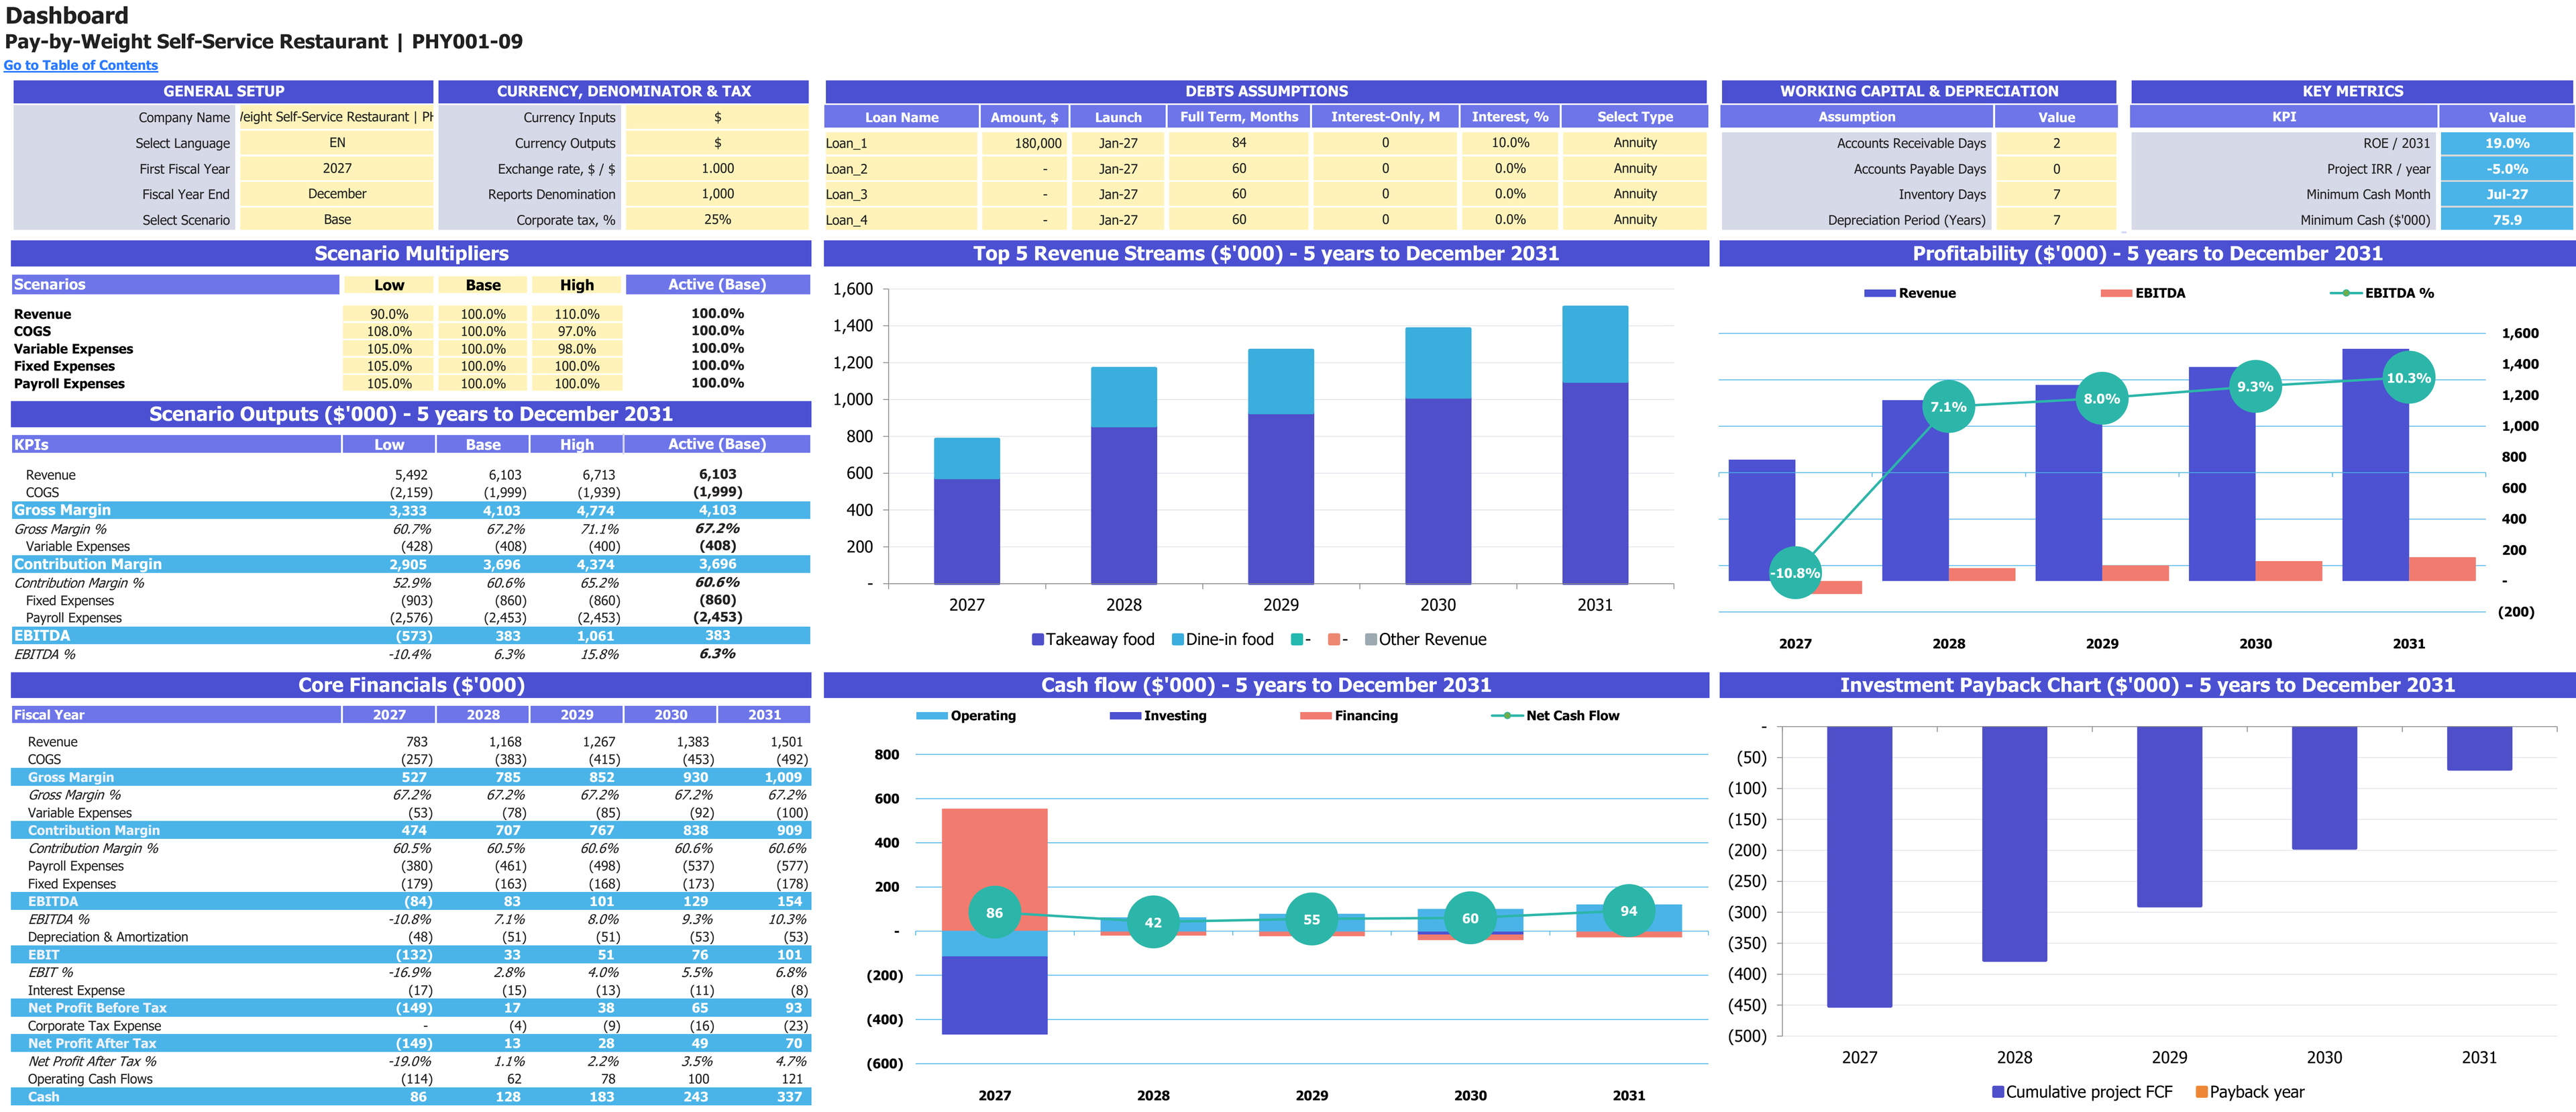
Base-case scenario controls, annual financial results and charts for 2027–2031. Financial report amounts are shown in thousands of USD; percentage measures retain their own units.
Enlarge image in a new tab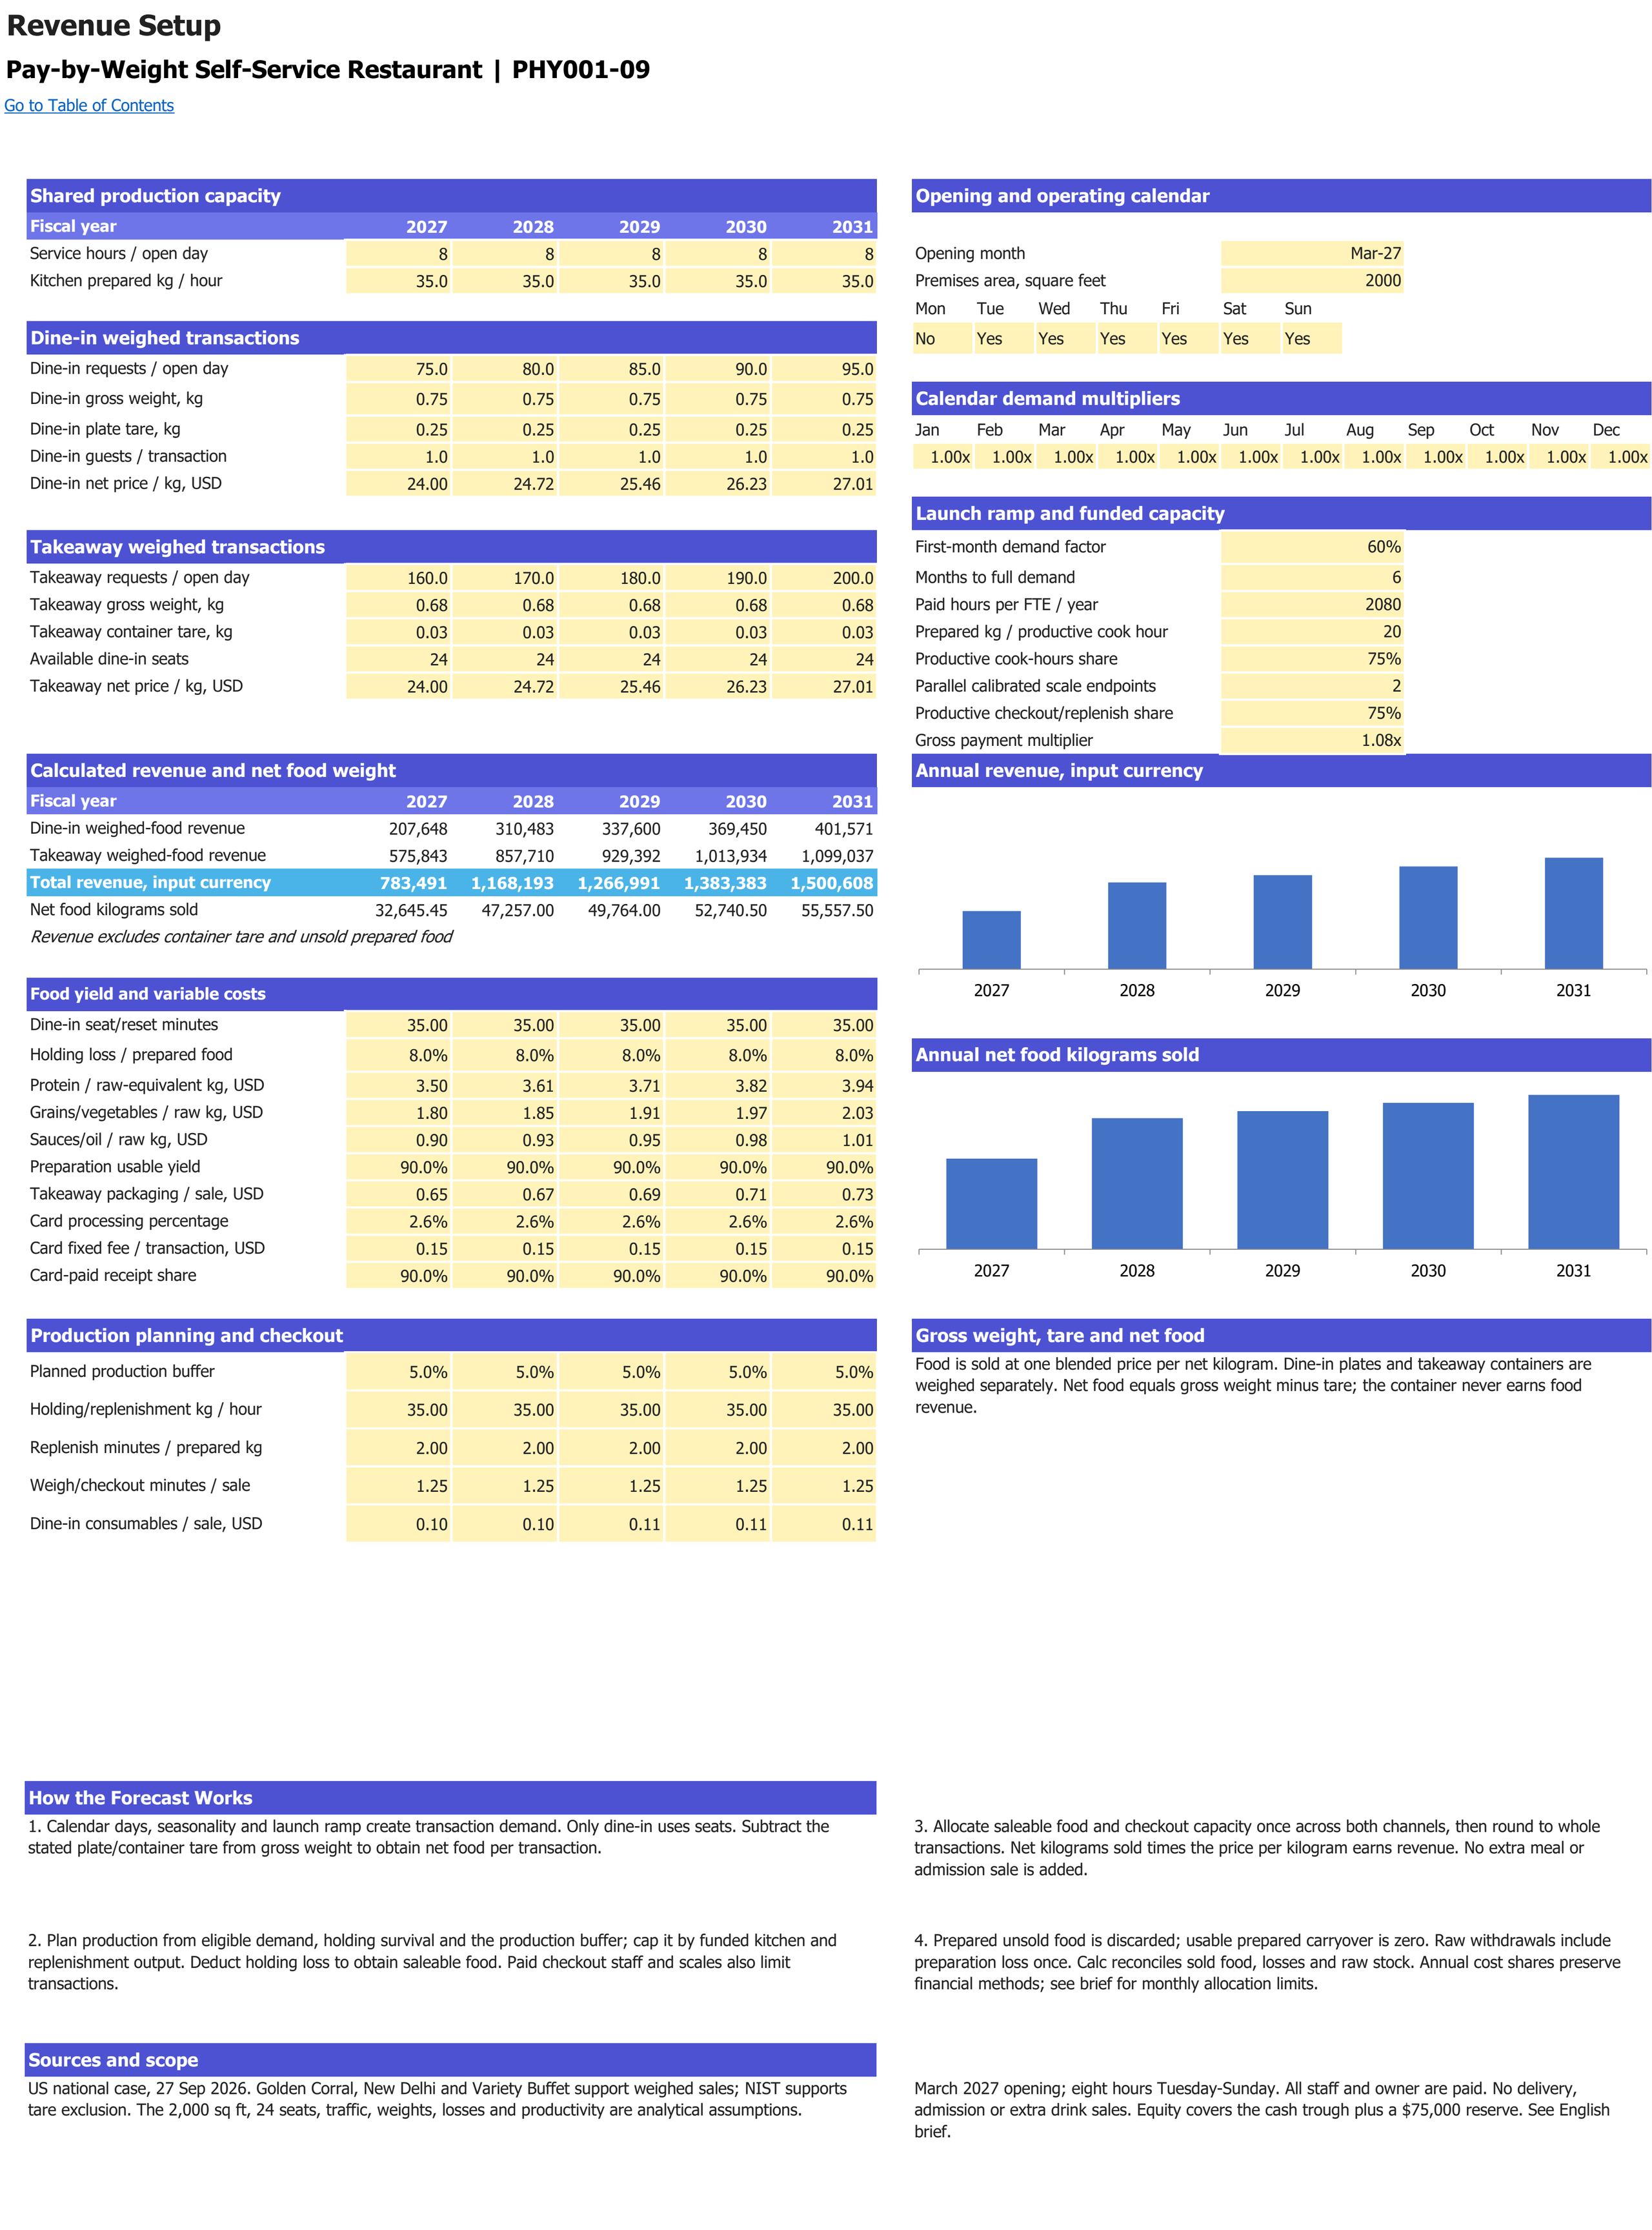
Dine-in and takeaway food demand, net food weight, yield and weighing-checkout capacity. Monetary inputs and sales use USD; operating volumes retain their labelled units. Forecast years are 2027–2031.
Enlarge image in a new tab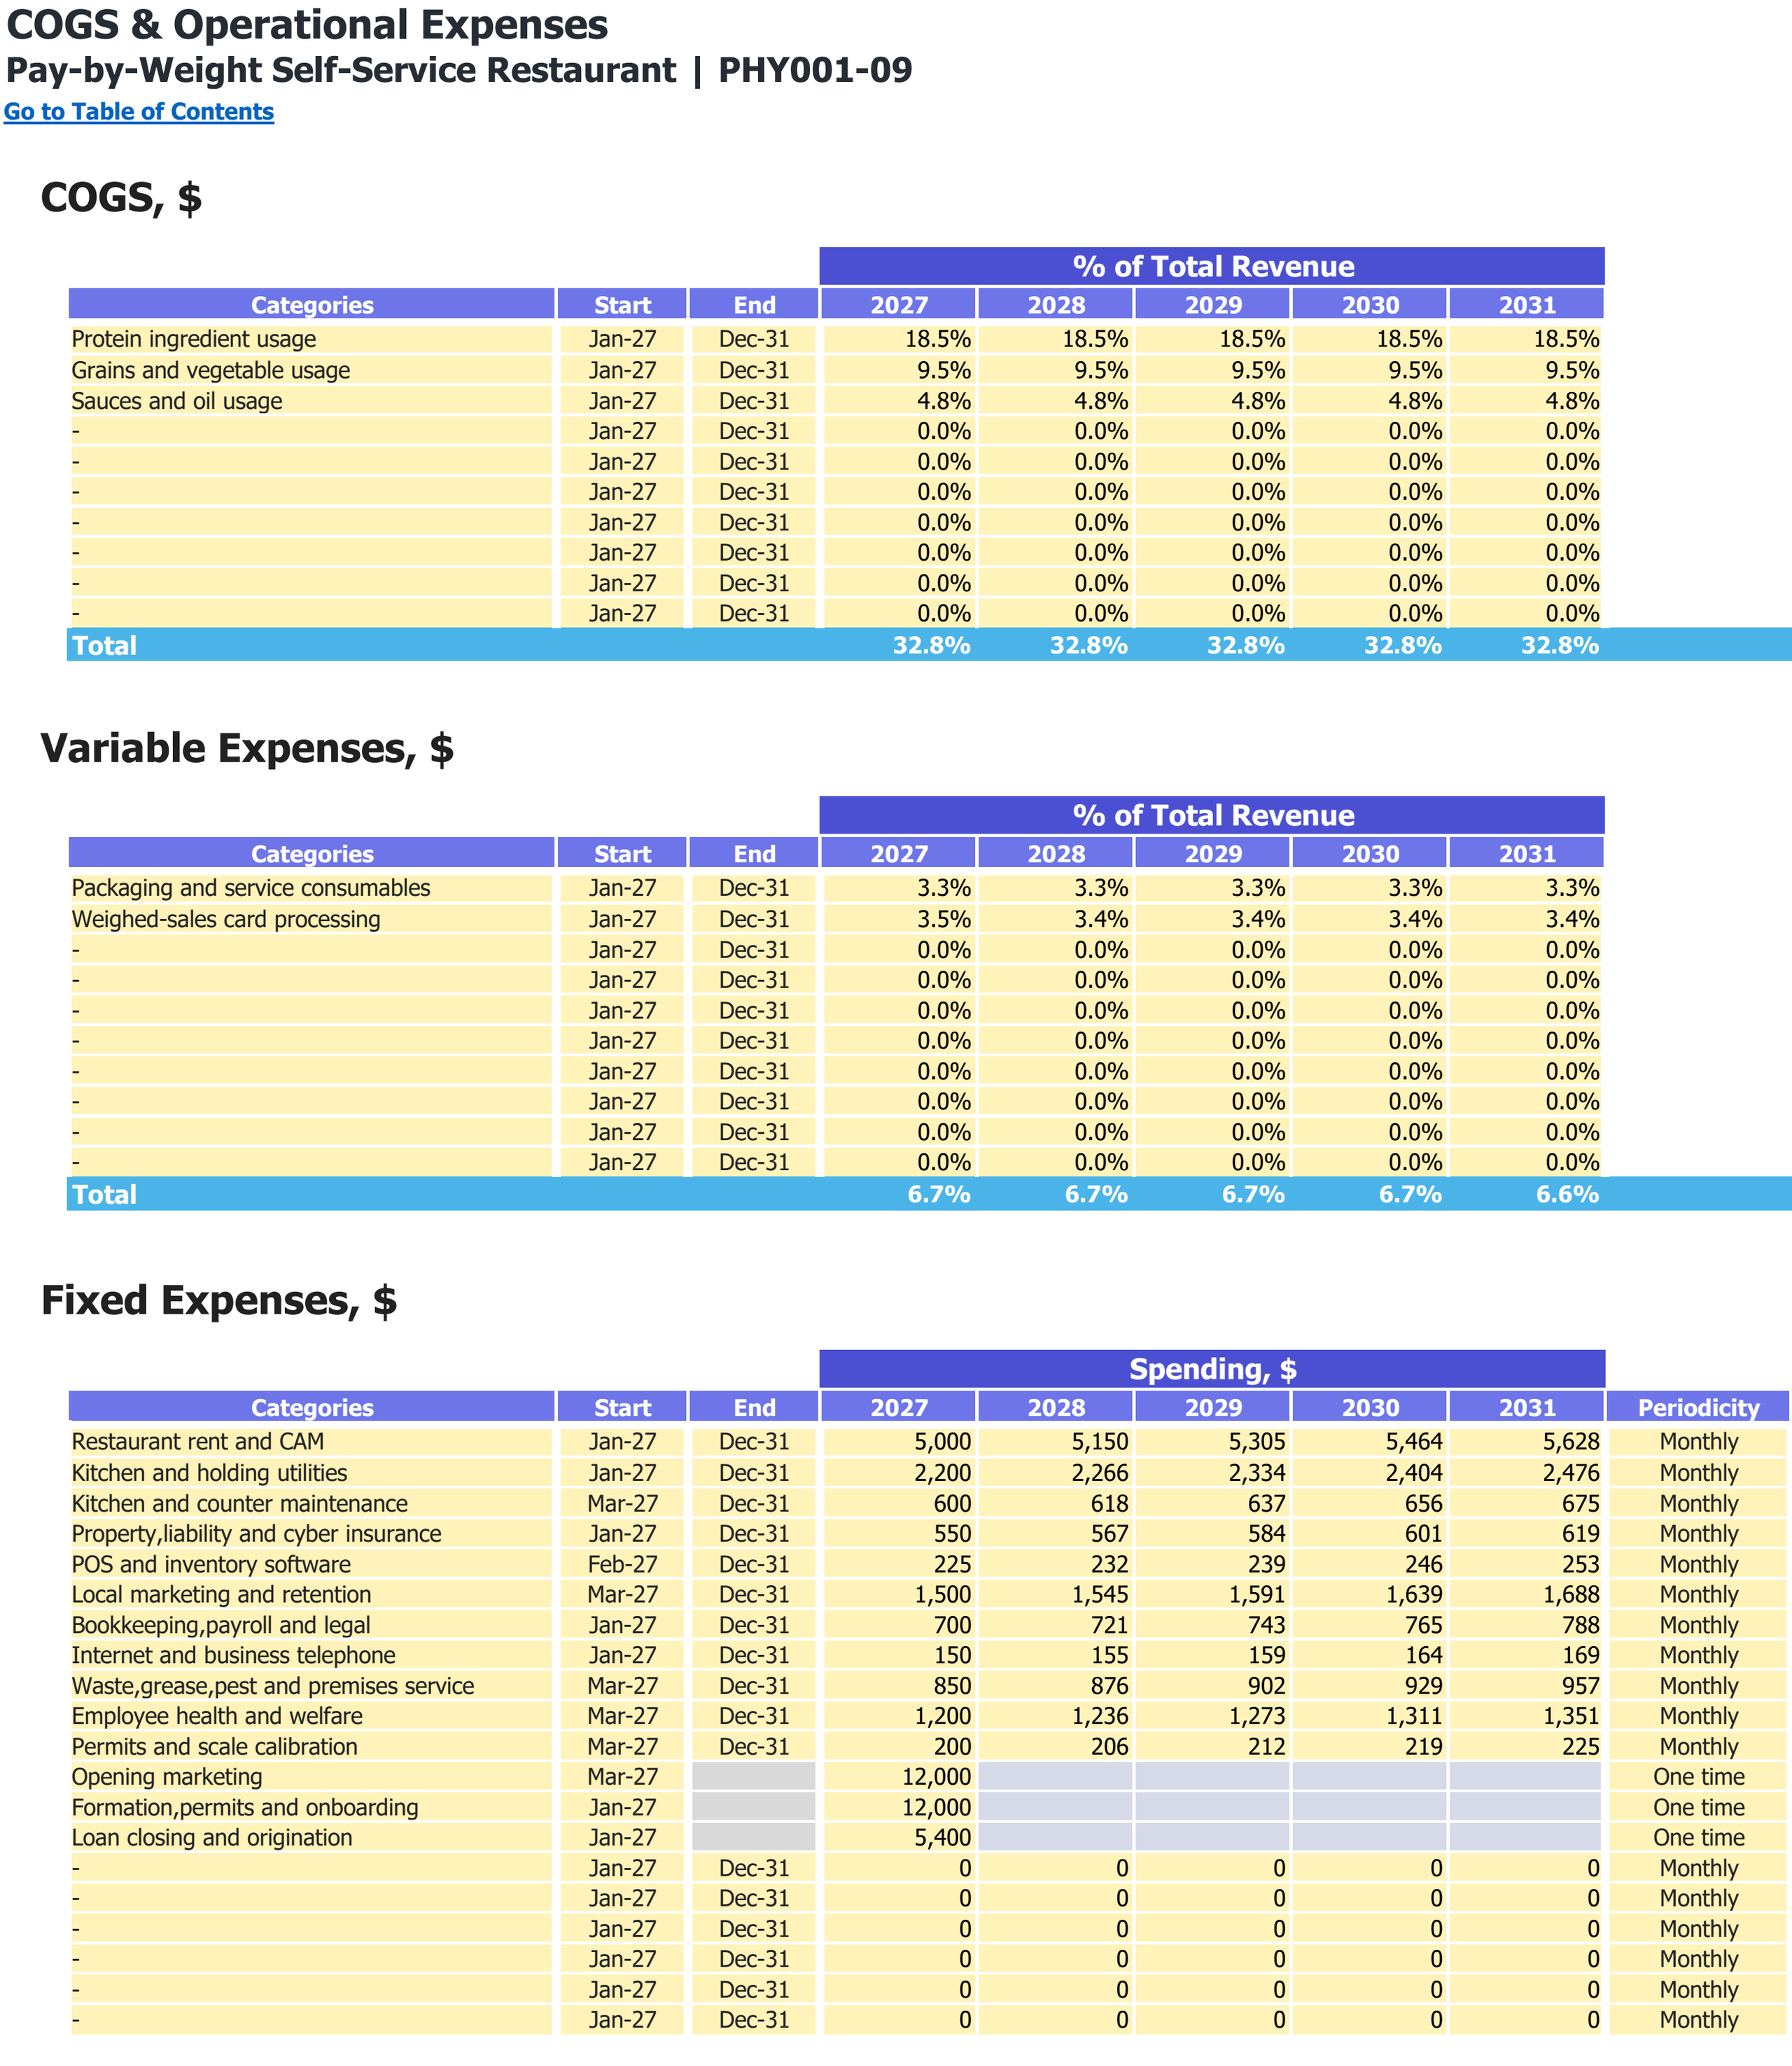
Food and other direct-cost categories, variable expense shares and fixed operating expenses. Monetary inputs are USD; the annual percentage columns are cost shares of revenue.
Enlarge image in a new tab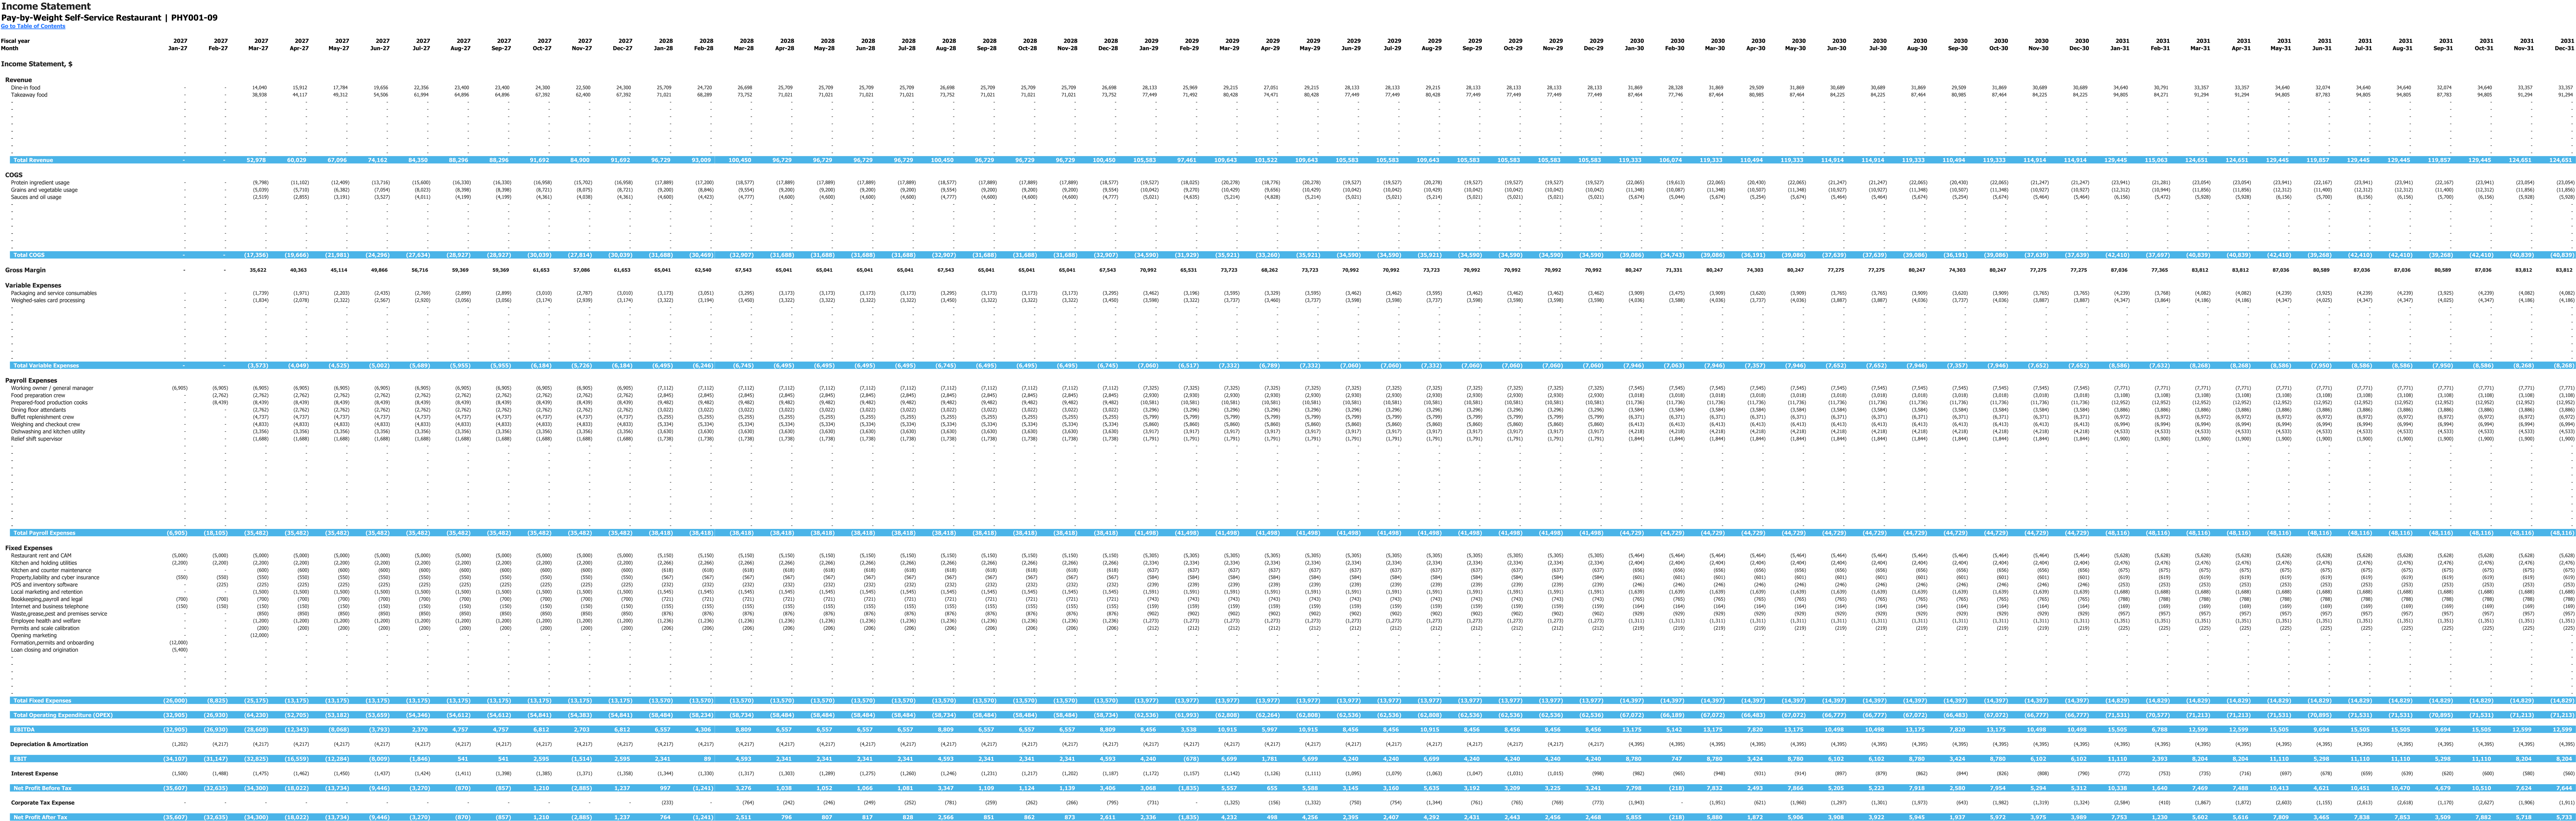
Monthly income statement for 2027–2031, in USD. This is an income statement view; it does not show payroll setup inputs. Enlarge to inspect the wide monthly table.
Enlarge image in a new tab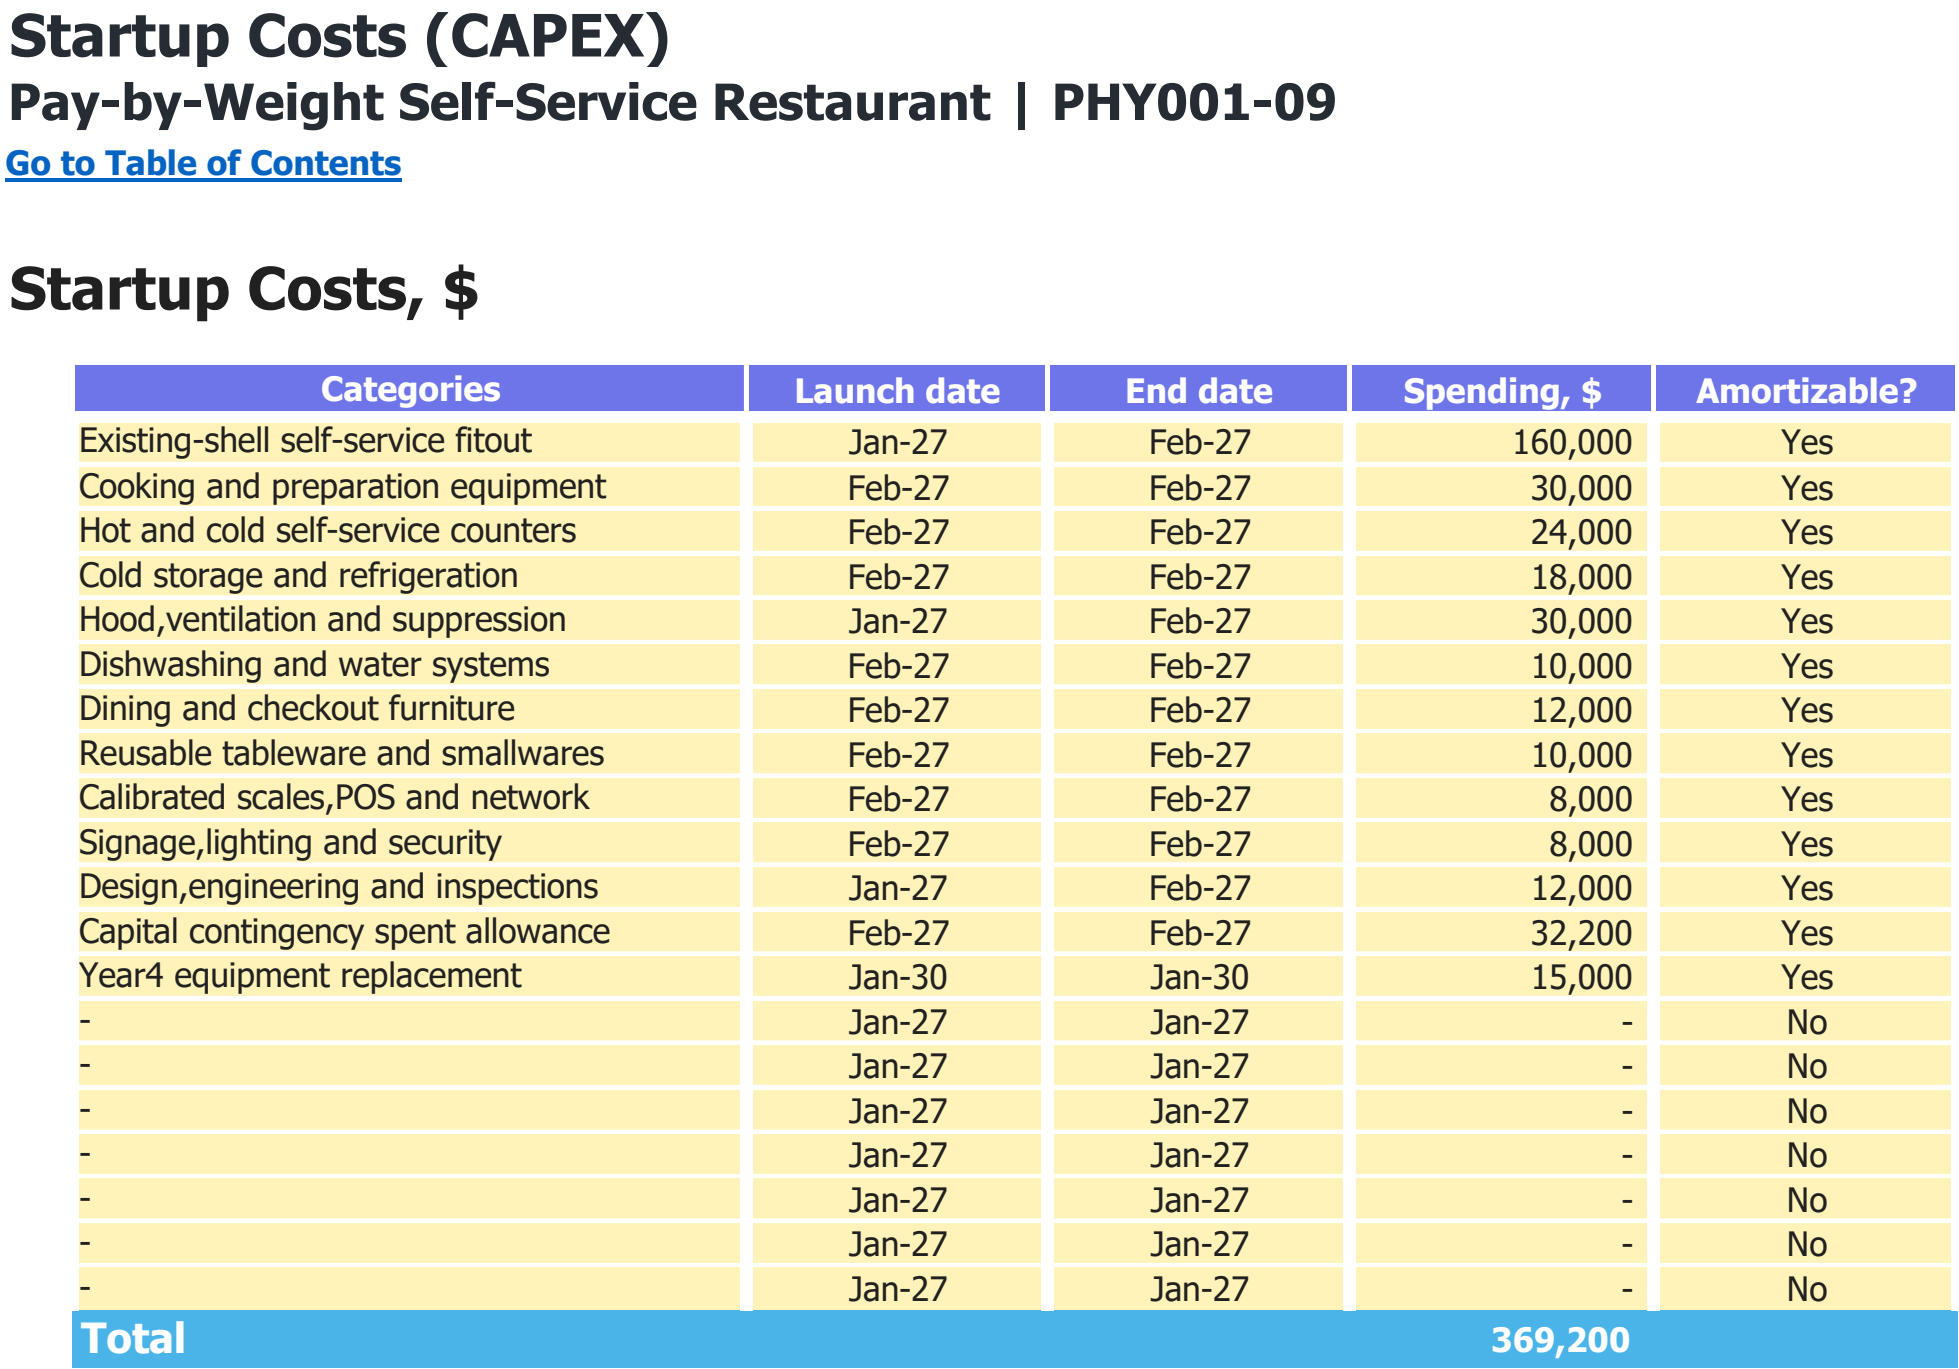
Asset categories, purchase dates and spending assumptions in USD. The total includes every scheduled purchase shown, including later replacements where present.
Enlarge image in a new tab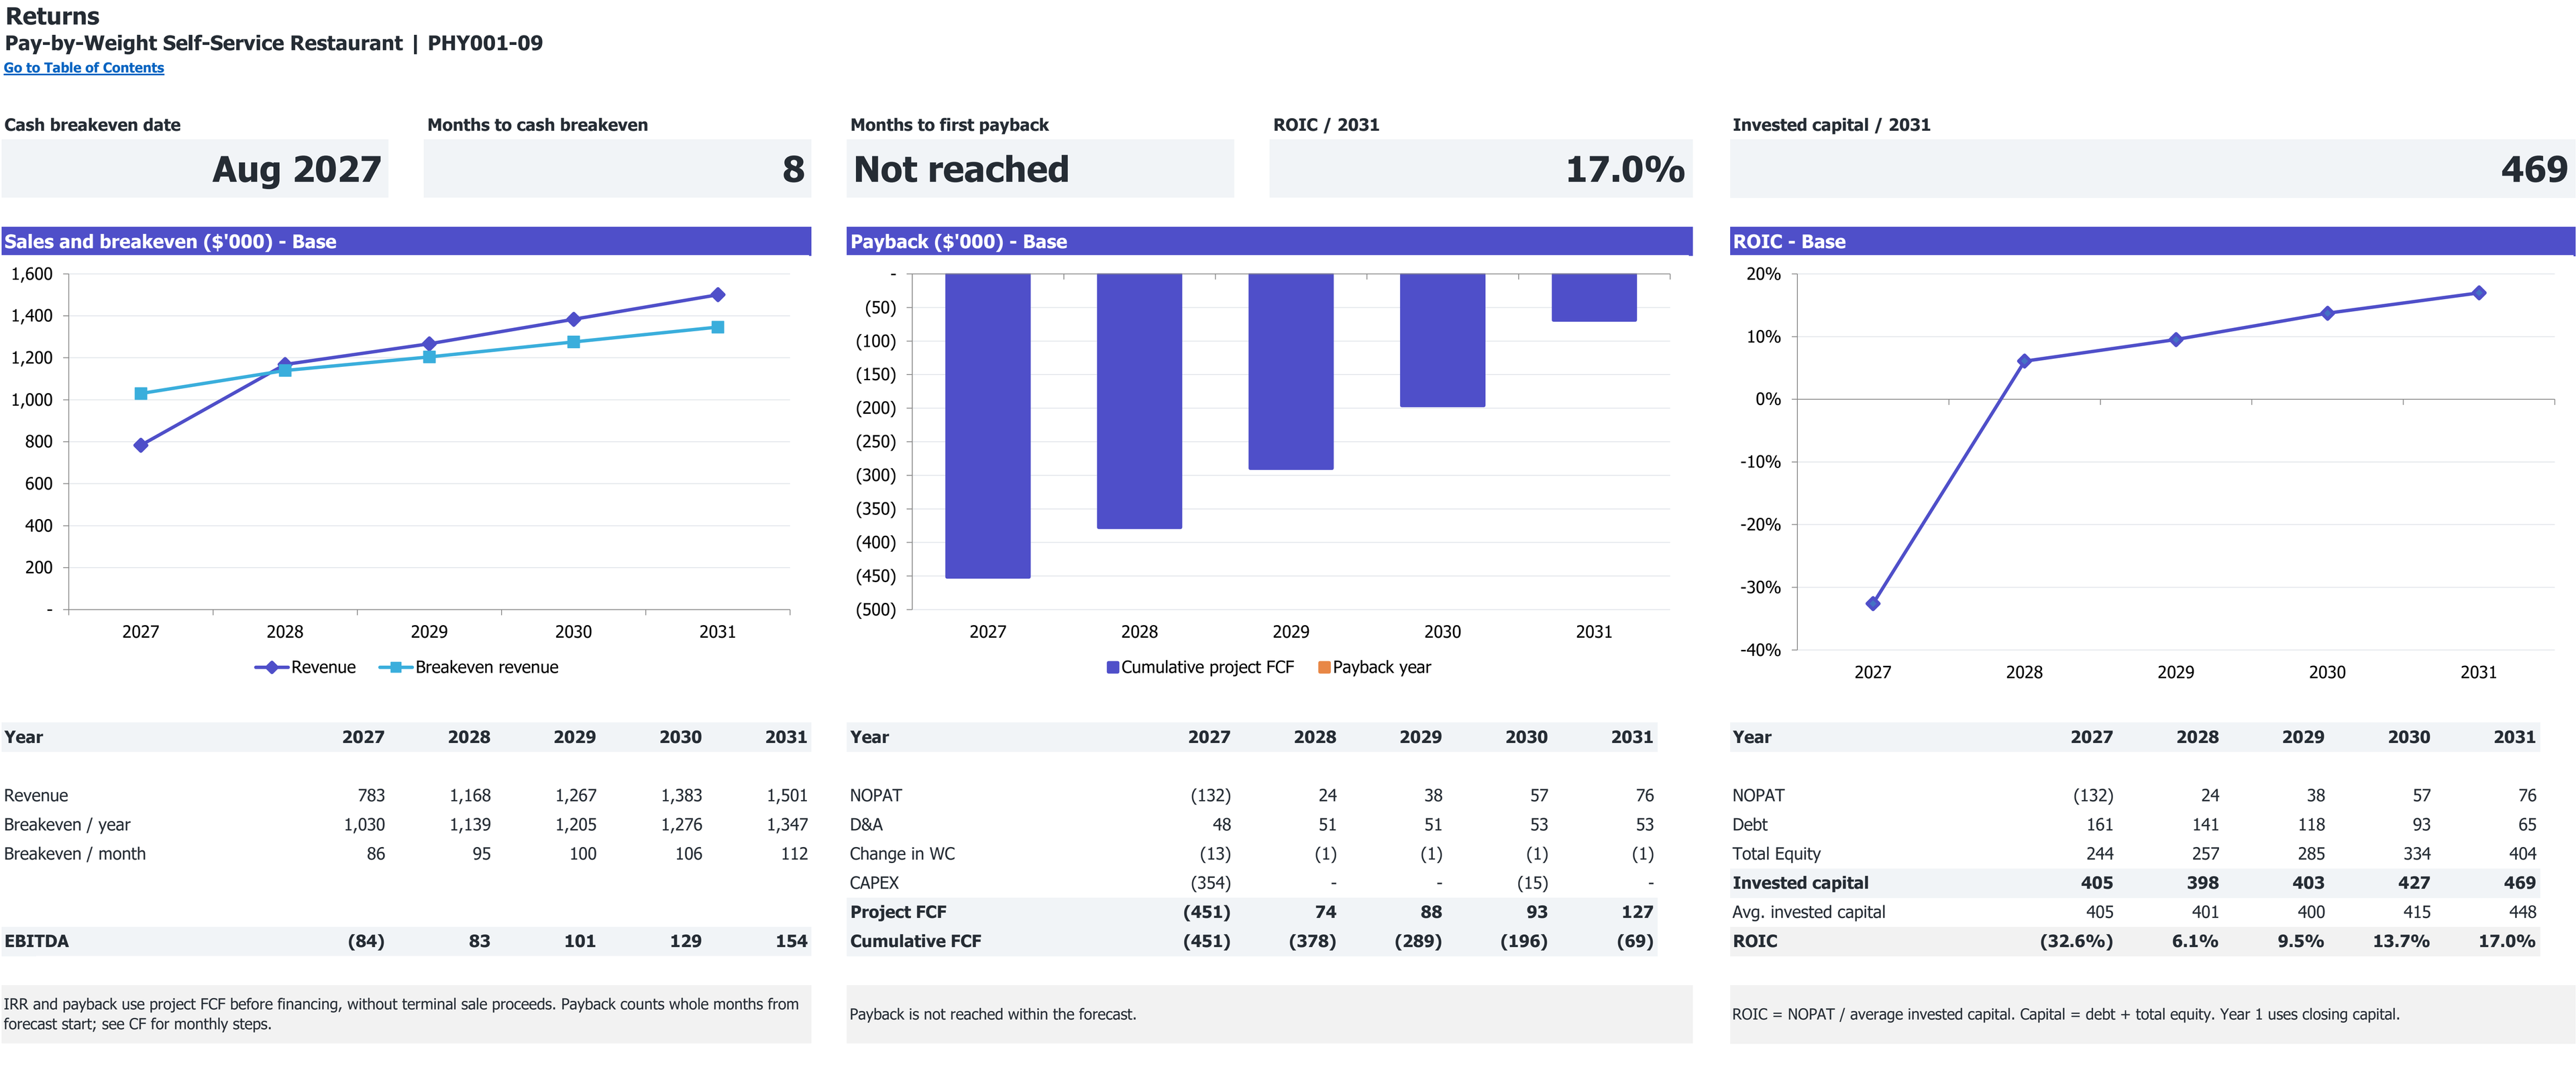
Excerpt from Returns: cumulative project free cash flow and first payback, if reached. 2027–2031 base case; dollar amounts in thousands.
Open full Returns view in a new tabExcerpt from Returns: revenue, annual and monthly break-even revenue, and EBITDA. 2027–2031 base case; dollar amounts in thousands.
Open full Returns view in a new tab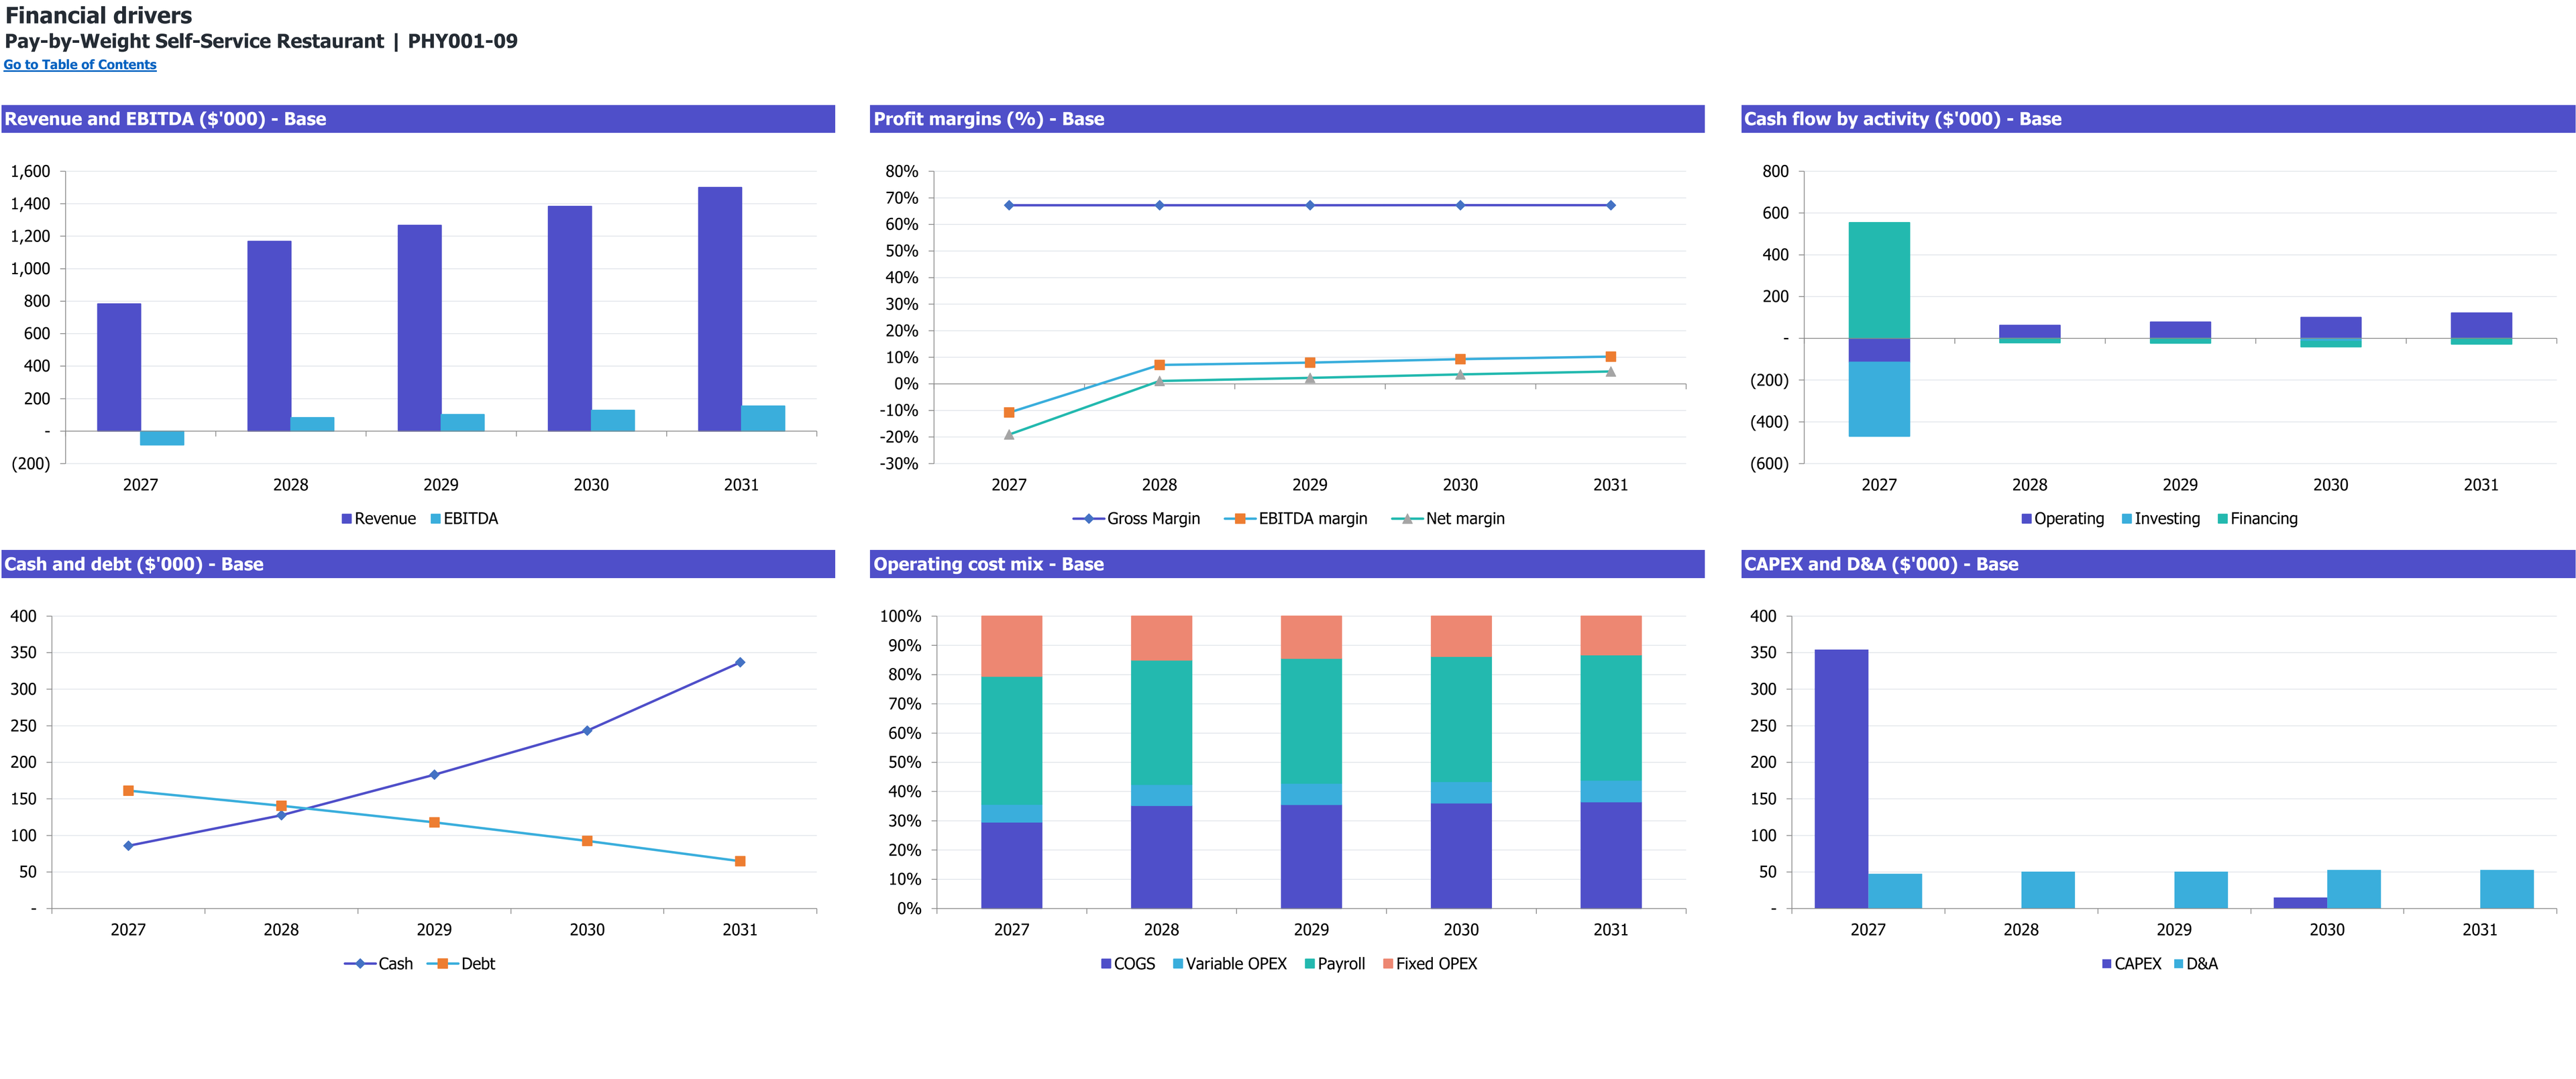
Six annual financial-driver charts for Pay-by-Weight Self-Service Restaurant, 2027–2031 (Base scenario). Dollar amounts are in thousands; margins and cost mix are percentages.
Enlarge image in a new tab8 selected worksheet views. Figures show this workbook’s starting case.
Workbook availability
What is inside the Excel model
Trace net food weight after tare through batch production, unsold food and checkout capacity. The saved Base case remains short of project payback at the end of its five-year forecast.
Selected worksheets from the documented workbook. Forecast period: January 2027–December 2031. Model reference: PHY001-09.
Inputs you control. Results you can inspect.
On a small screen, scroll within the table to read every column.
| Planning area | Inputs you review | How they connect | Results to inspect |
|---|---|---|---|
| Weighed portions | Dine-in gross 0.75 kg less 0.25 kg tare; takeaway 0.68 kg less 0.03 kg tare. | Only net food weight receives the selected $24/kg starting tariff. | 0.50 kg and 0.65 kg net food per transaction. |
| Channel demand | 75 dine-in and 160 takeaway mature daily requests. | Calendar days, 60% launch demand and a six-month ramp create requests. | Eligible transactions, with seats applied only to dine-in. |
| Production policy | 5% production buffer; 8% holding loss; 90% preparation yield. | Prepared output is constrained before saleable and unsold food are determined. | Food sold, discarded food and raw withdrawal. |
| Checkout and staffing | Two scales; 1.25 checkout minutes; 8.9 initial paid FTE. | Funded cooking, replenishment and checkout each cap activity. | Fulfilled transactions and paid resource requirements. |
| Recipe and supplies | $6.20/raw-equivalent kg; $0.65 takeaway and $0.10 dine-in consumables. | Raw withdrawal drives food expense; each sale uses its own channel supplies. | Ingredient cost including unsold production, without duplication. |
| Investment and cash | $354,200 initial CAPEX; $393,000 equity; $180,000 loan. | Investment, losses, working capital and loan service determine liquidity. | Funding cushion, downside gap and project recovery. |
Is this the right model for your business?
Check the starting case before changing the assumptions.
The starting operation
- A prepared-food restaurant where dine-in and takeaway customers pay for net food weight.
- An operator testing gross portions, container tare, batch surplus and ingredient losses.
- A founder comparing the cost of cooking, replenishment and weighing staff with achievable food volume.
Check the boundary
The model excludes all-you-can-eat admission, grocery retail, full-meal billing, separately priced drinks, alcohol and delivery commissions.
Compare the other restaurant typesHow this business makes money
Connect the unit sold to the resources required by this operating case.
Revenue logic
Net food kilograms sold after plate or container tare, multiplied by price per kilogram.
Only sold food earns revenue. Preparation, holding loss and unsold batches remain separate physical quantities.
Can a pay-by-weight restaurant have enough cash to operate but still fail to recover its investment?
Yes. Owner equity and borrowing can keep cash positive while the underlying project's cumulative cash return remains negative. This case illustrates that distinction: the Base funded balance stays above its reserve objective, but project free cash flow has not recovered startup investment by December 2031. Net kilograms per paid labor hour and discarded production are central operating checks.
- Revenue unit
- Net kilograms after plate/container tare
- Food cost
- All raw withdrawal, including unsold production
- Resource burden
- Separately paid cooking, replenishment and checkout
What to establish for your own operation
- Measure net portions and tare on the actual plates and containers.
- Test production buffer and unsold food without counting their cost twice.
- Check downside cash separately from long-run profit and investment recovery.
Follow the plan from demand to cash
Open each section for the assumptions, calculations, and limits of this workbook’s starting case.
Sell net food weight after the tare deductionRevenue
Dine-in starts with 0.75 kg gross weight and a 0.25 kg plate: 0.50 kg of billable food. Takeaway uses 0.68 kg gross less 0.03 kg container tare: 0.65 kg net. Both channels initially pay $24/net kg. A transaction does not also generate a meal or admission charge; unsold food earns nothing.
Eligible demand sets planned preparation after an 8% holding-loss allowance and a 5% production buffer. Cooking and replenishment constrain output. Saleable food and staffed weighing/checkout then limit transactions. Only dine-in uses the 24 seats and 35-minute visit allowance. Whole-transaction allocation does not reproduce a queue or individual scale increments.
- Installed cooking and holding/replenishment each start at 35 prepared kg/hour.
- Checkout requires 1.25 minutes per sale and funded staff as well as two physical scales.
- A closed checkout can leave prepared food unsold; it does not erase the production cost.
Include discarded batches in food cost oncePayroll
The $6.20/raw-equivalent kg basket contains $3.50 protein, $1.80 grains/vegetables and $0.90 sauces/oil. Raw withdrawal equals prepared output divided by 90% preparation yield. Prepared food then incurs 8% holding loss. Remaining saleable food not sold is discarded under the selected closing policy, with zero prepared carryover.
The food-mass identity separates sold food, holding loss, unsold prepared food and preparation loss. It does not charge the whole batch twice. Paid staffing starts at 8.9 FTE and reaches 10.9, with distinct cooking, replenishment and checkout crews. The owner is paid $74,880 annually from January. Employer load is 10.65%, plus a separate $1,200 monthly welfare pool.
- Initial rent/CAM is $5,000/month; utilities are $2,200/month.
- Raw stock targets seven calendar days of withdrawal, distinct from prepared-food carryover.
- Annual cost shares preserve yearly totals but can approximate monthly physical costs and stock values.
Fund specialized checkout and a cautious cash cushionCAPEX
Initial CAPEX is $354,200, including $32,200 spent contingency on $322,000 base capital. The $160,000 reused-shell fitout is separate from cooking, self-service counters, ventilation, refrigeration and warewashing. The $8,000 scales/POS/network budget includes two scales and installation allowances; it does not certify a site's legal-for-trade setup. January 2030 adds $15,000 replacement capital.
January financing is $573,000: $393,000 equity and $180,000 debt. The assumed loan is 10% fixed, amortized over 84 months without grace, with a $5,400 expensed fee. The −$317,076 trough without equity already includes the loan, debt service, startup losses and investment. Equity adds a $75,000 reserve and rounds upward to $1,000.
- Minimum Base funded cash is $75,924 in July 2027.
- Receivables use two revenue days, financial food stock seven cost days and payables zero.
- Having sufficient financing does not establish that the investment earns an attractive return.
Keep the absence of payback visibleCF
Base 2027 revenue is $783,491 from 32,645.45 net kg sold through 54,217 transactions. EBITDA is −$84,435. Across 60 months, revenue is $6,102,667 and EBITDA $382,978, but cumulative unlevered project free cash flow still ends at −$68,667. Project payback is not reached by December 2031; no later date is extrapolated.
Monthly EBITDA becomes sustainably nonnegative in July 2027. EBIT first crosses zero in August 2027 but is only sustainably nonnegative from March 2029. Operating cash becomes and stays nonnegative in August 2027. The 60-month simple project cash ROI is −14.2%, an undiscounted, nonannualized measure using all negative monthly project FCF as its denominator.
- Low monetary stress creates a −$565,939 minimum cash balance with Base funding unchanged.
- The cash-flow pattern has three sign changes; a unique conventional IRR is not asserted.
- Project cash recovery excludes financing and terminal proceeds. No owner distributions are scheduled.
Selected results from the starting case
Modeled results in USD unless stated otherwise. These describe the selected inputs, not an estimate for your location or a guaranteed outcome.
- 2027 revenue
- $783,491USD, Base; net food kilograms sold after tare, with March opening.
- 2027 net food sold
- 32,645.45 kgFood weight only; 54,217 fulfilled dine-in and takeaway transactions.
- Minimum Base cash
- $75,924Funded monthly balance in July 2027; liquidity does not imply investment recovery.
- Project payback
- Not reached in 60 monthsCumulative undiscounted unlevered project FCF is −$68,667 at December 2031.
- Simple project cash ROI
- −14.2%60-month net project FCF divided by $483,382 absolute negative monthly FCF; not annualized IRR.
- Low-case minimum cash
- −$565,939Cash deficit under monetary sales/cost stress with original financing fixed.
Make the case your own
Work from the operating plan toward the cash requirement.
Enter measured gross portions, tare, tariffs and expected channel demand.
Validate production, replenishment and checkout time budgets against paid schedules.
Replace installed capital and lease allowances, then recalculate required funding.
Review physical food losses, sustained operating milestones and the unrecovered project cash balance.
Interpretation and scope
- This is a selected national scenario, not a national outcome or a local feasibility study.
- Discarding unsold prepared food is an economic policy assumption, not food-safety advice.
- A full year of production without sales cannot be represented faithfully by the retained annual cost-share method and is flagged invalid.
- The 25% tax planning rate has no jurisdiction or loss carryforward; no salvage or terminal sale offsets the unrecovered investment.
The workbook is an Excel file for local planning. Learn how to interpret assumptions and evidence.
Other restaurant types
Each operating type calls for its own financial structure.
Questions
Is the plate or takeaway container sold as food?
No. Its tare is deducted from gross weight before applying the net price per kilogram.
What earns revenue in this format?
Fulfilled transactions times their net food weight times price/kg. No additional admission or full-meal charge is added.
Why prepare more food than expected sales?
The saved policy adds a 5% buffer after holding loss. Unsold saleable output is discarded and retains its ingredient cost.
Does adding scales guarantee more transactions?
No. Funded checkout minutes can still bind, and cooking or replenishment may cap saleable food first.
Why is the cash balance positive without payback?
Cash includes contributed equity and debt. Project recovery excludes financing and remains −$68,667 cumulatively at the forecast end.
Is August 2027 the sustained EBIT break-even date?
No. It is the first nonnegative month. Later reversals occur; sustained nonnegative EBIT begins in March 2029.
Does the Low case remain funded?
No. With Base financing unchanged, its minimum cash is −$565,939, showing an additional funding need or a need to change the operating plan.
Can I buy this model now?
No. Purchasing and workbook downloads are not available on this site.
Which software does the workbook use?
The documented file is an Excel workbook (.xlsx). Compatibility with other spreadsheet applications is not established by the file extension.
Read the planning guides
Explore the relevant operating questions and how to interpret a workbook’s assumptions.
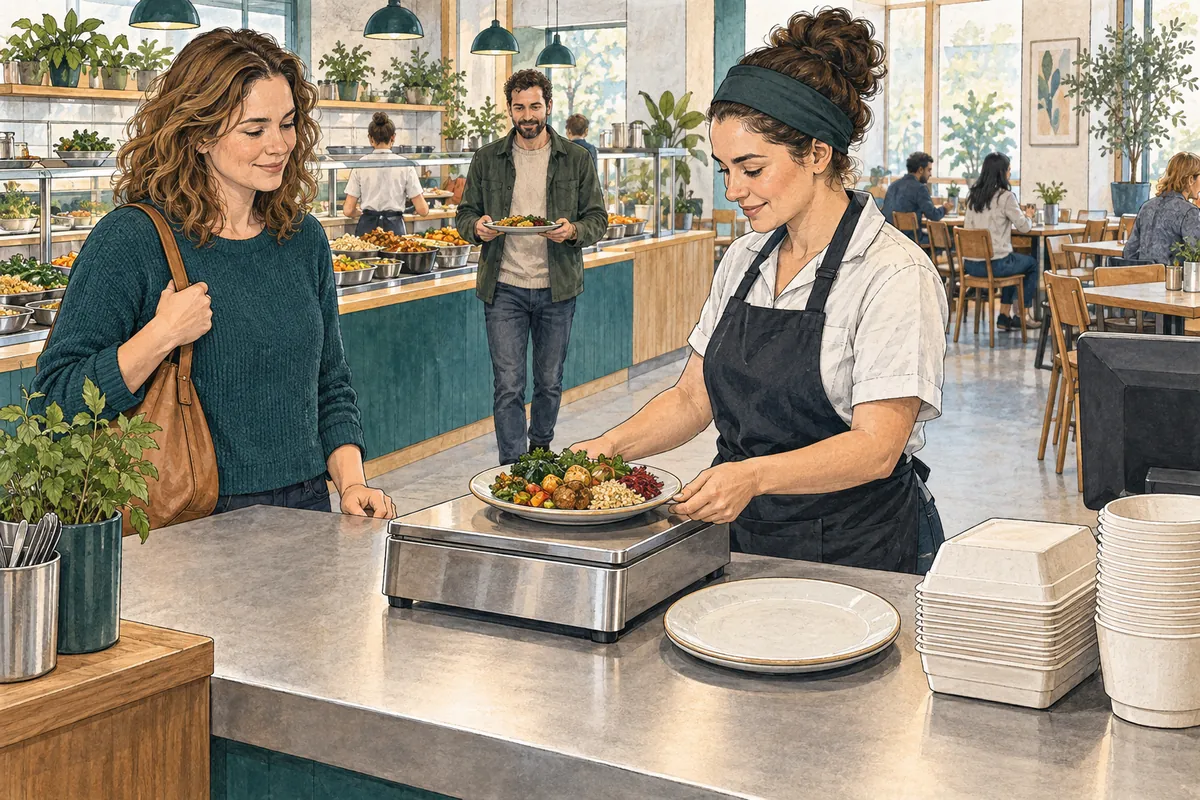
How do tare and food losses affect pay-by-weight restaurant margins?
Follow net food weight from checkout revenue back to prepared output, holding loss, unsold food, and raw ingredient withdrawals in one planning case.
Read the guide
How to read financial assumptions before editing an Excel model
Follow the chain from operating assumptions to calculated results, check units and timing, and keep a useful record of changes to a financial workbook.
Read the guideEvidence and scope
Primary operator examples support only the operating features described in the source registry. This full configuration, all formulas, local feasibility and numerical economics remain analyst-authored and unverified.
The links below provide operating-format context; they do not verify the workbook’s selected inputs or calculated returns.
The workbook guide and figures describe model PHY001-09, revision r01, for January 2027–December 2031. These are a documented planning case, not observed results for a particular business.