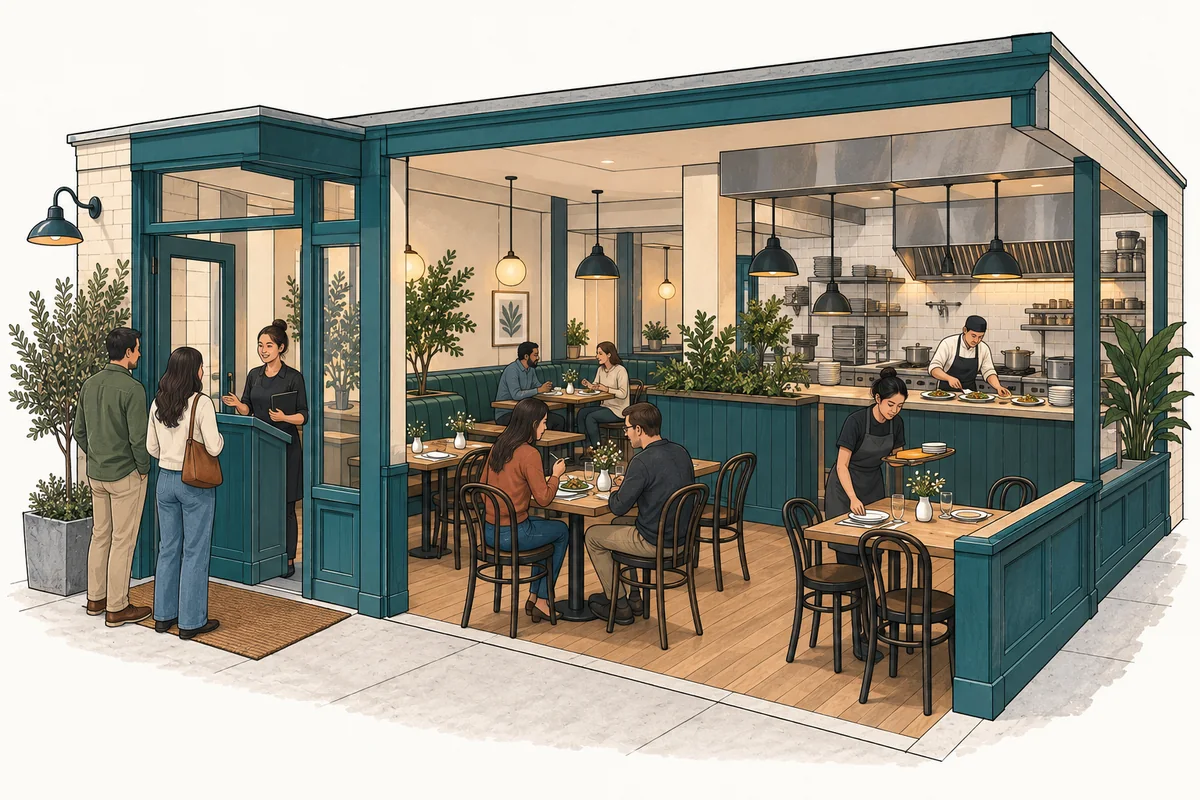
The chef-at-table teppanyaki case models eight communal cooking tables in a 3,200-square-foot U.S. restaurant. Its Base forecast runs January 2027–December 2031, with March 2027 opening. The selected 2027 time budgets, target fill, staffing, and capacities below are analytical assumptions, not measured throughput guarantees.
Why is target fill different from physical seating?
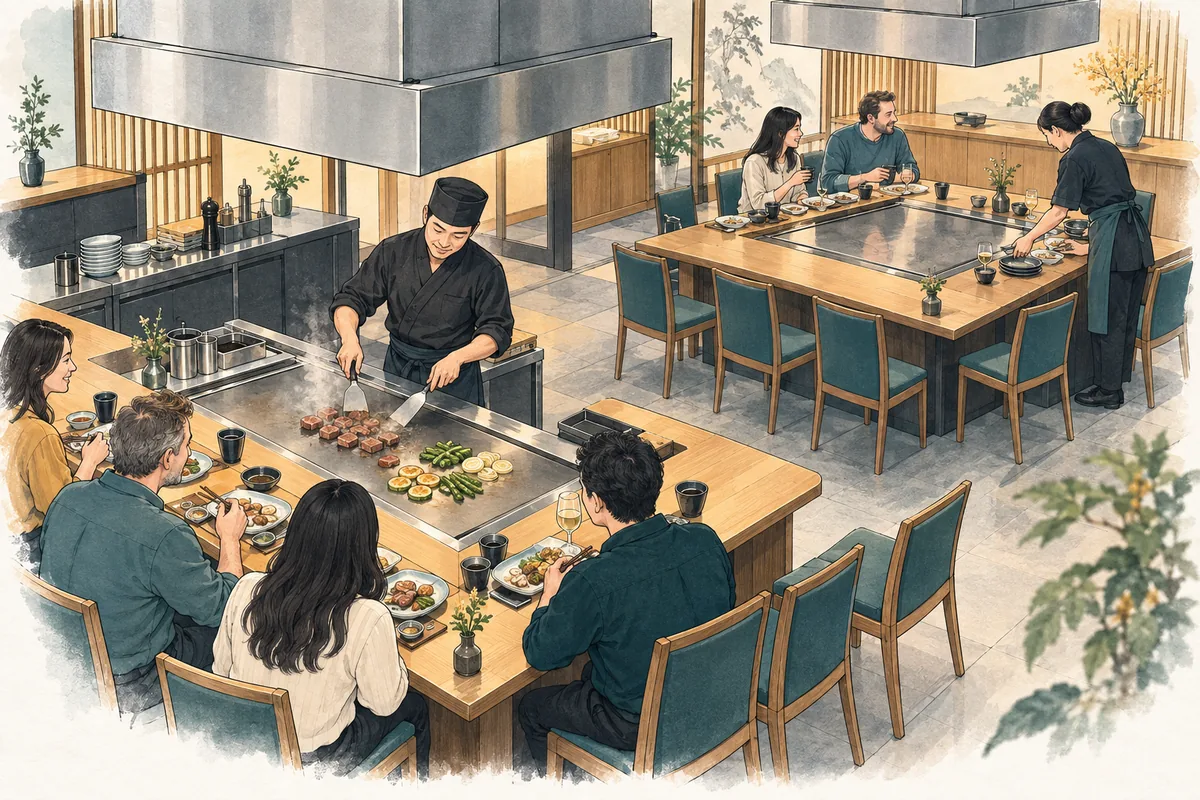
Eight tables with eight seats each provide 64 physical seats. The case uses a target shared fill of six guests per delivered session, allowing for unused seats. It therefore does not assume that each party or every session fills a complete eight-seat table.
A session still occupies its table and requires a chef when fewer guests attend. The model calculates delivered sessions by rounding served guests divided by six upward. For an isolated 13-guest day, that means three sessions: two at target fill and a final session with one guest. The 18 target-fill places across those sessions do not become 18 sold meals.
Guests, meal units, and payment bills also differ. A served guest buys one included-side entree, and an optional drink is another sold menu unit for the same guest. The selected 2.5 guests per payment bill estimates transactions; it is separate from the six-guest shared-table target.
How do chef time and table occupancy overlap?
Each table cycle lasts 90 minutes: 50 minutes with the chef, 30 further minutes for dining and payment, and 10 minutes for clearing and reset. Once the chef’s 50-minute engagement finishes, that chef can move to an available table while the first group finishes its meal.
Four concurrent chefs each have five productive hours, or 300 minutes, within the six-hour service window. Each can perform six 50-minute engagements. With eight tables available to alternate, starts occur at minutes 0, 50, 100, 150, 200, and 250. Returning to a table after 100 minutes respects its 90-minute cycle; the final tables clear at minute 340, within the 360-minute window.
This schedule uses 24 sessions: four chefs × six engagements. At six guests per session it supports 144 guests per day. The arithmetic describes the saved baseline schedule. It does not establish how customers will arrive, how parties will combine, or whether actual chefs achieve the assumed timing.
Which resource sets the selected daily ceiling?
The chef/table schedule is tighter than the isolated table and back-kitchen limits in this case. Comparing the ceilings is useful only when each is expressed in the same guest unit and includes its relevant time allowance.
On a narrow screen, scroll within the table to read all columns.
| Resource calculation | Working | Capacity and limitation |
|---|---|---|
| Physical seats | 8 tables × 8 seats | 64 seats at one time; not a daily sales count |
| Tables alone at target fill | 8 × floor(360 ÷ 90) × 6 | 192 guests/day before chef and preparation constraints |
| Feasible chef/table schedule | 4 chefs × 6 engagements × 6 target guests | 144 guests/day; last tables clear at minute 340 |
| Back-kitchen preparation | 2 cooks × 6 productive hours × 14 portions/hour | 168 complete guest portions/day |
| Support coverage | Funded server, host, dish, and management hours | Can reduce the number of whole operating days delivered |
The 192-guest table-only ceiling cannot be sold simply because it exceeds the chef schedule. Likewise, a kitchen able to prepare 168 portions cannot put a chef at a table earlier. These are shared parts of one service system, so their capacities are compared rather than added.
Does increasing demand create another table turn?
Only when the schedule and funded staff can deliver it. The selected mature demand is 144 guests per day; the March opening ramp is 62.5%, giving 90 requested guests per day. The 90 is already the ramped result and must not be multiplied by the launch percentage again.
At 144 served guests, the baseline schedule is full at the six-guest target. Extra requests alone do not create another 50-minute chef engagement or another clearing window. Reducing the table count also changes the schedule: the source’s tested six-table case delivers 20 sessions with unchanged staffing, rather than the baseline 24.
Lower attendance has a different effect from cutting funded payroll. In the source’s sustained 90-guest-per-day downside, paid staff and occupancy remain largely fixed and the forecast loses money. The purpose of the capacity calculation is to identify deliverable sales, not to assume that any reachable utilization level will cover the team’s cost.
Which changes need more than a schedule edit?
More equipped tables increase selected griddle, surround/seating, and extraction budgets in the workbook. They do not establish that those tables fit the unchanged premises or that the remaining kitchen, utilities, and construction allowances can support them. Capacity expansion needs a matching physical and cost plan.
Review chef engagement, actual shared fill, clearing time, back-kitchen output, and the paid roster together. The teppanyaki model links those assumptions to delivered sessions and full operating days. The broader restaurant demand and capacity guide explains why an increase in requests can leave served volume unchanged.