
Restaurant Financial Model: Chef-at-Table Teppanyaki Restaurant
Model shared teppanyaki tables, integer chef schedules, meal and drink sales, paid support roles and reserve-based startup funding.
- Excel (.xlsx)
- Premises: 3,200 sq ft / eight tables / 64 physical seats
- Target fill: Six guests per table session
- Service: Six hours Tuesday–Sunday / March 2027 opening
Planning several types? Compare 17 restaurant formats
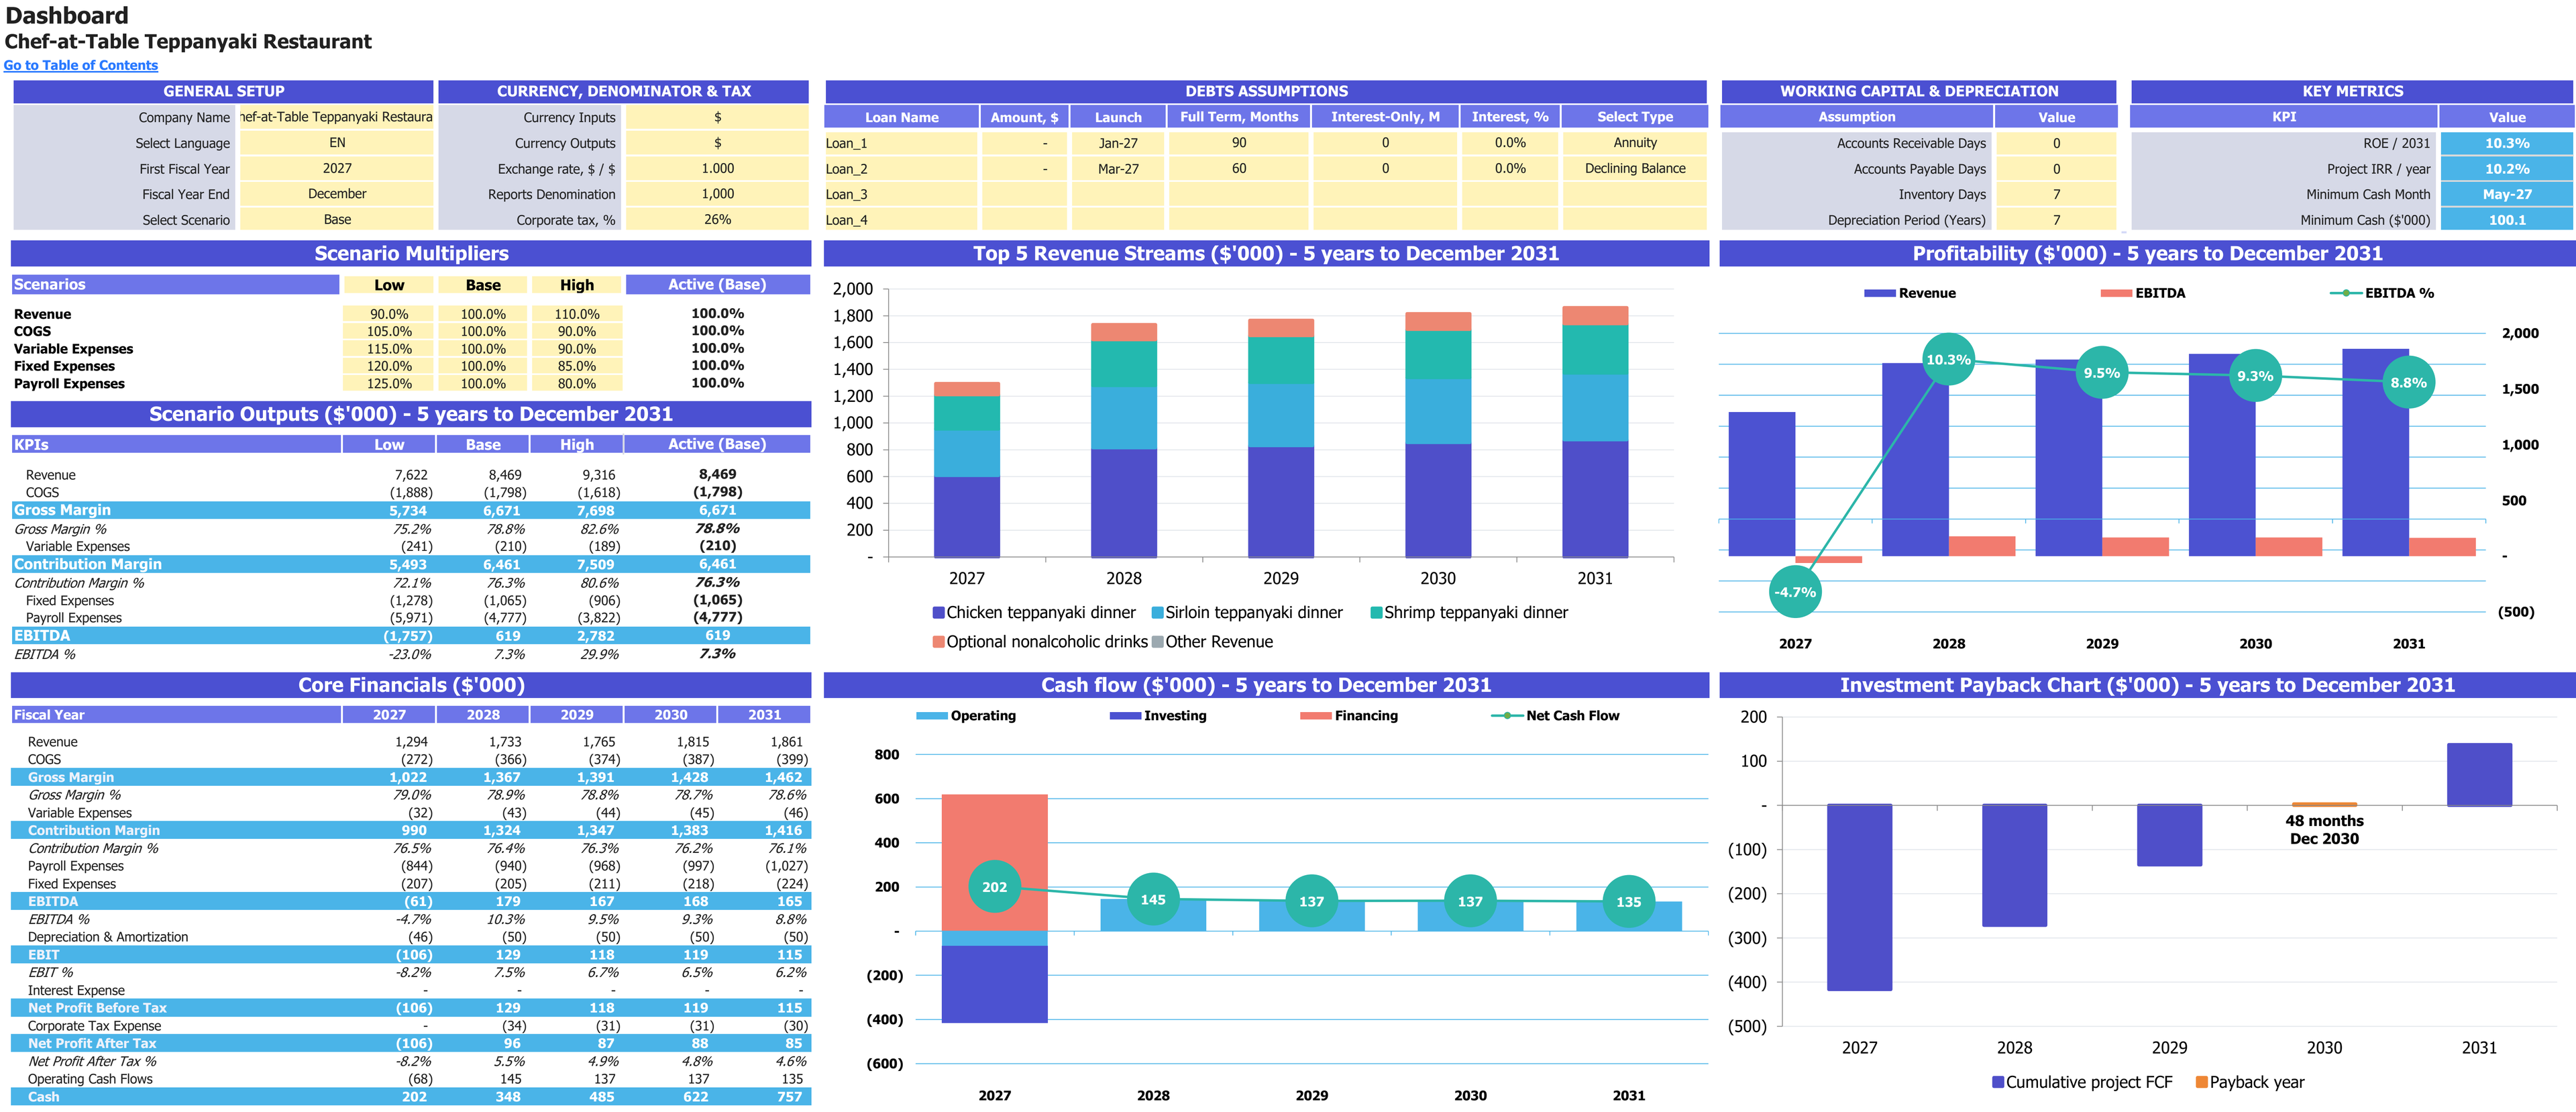
Base-case scenario controls, annual financial results and charts for 2027–2031. Financial report amounts are shown in thousands of USD; percentage measures retain their own units.
Enlarge image in a new tab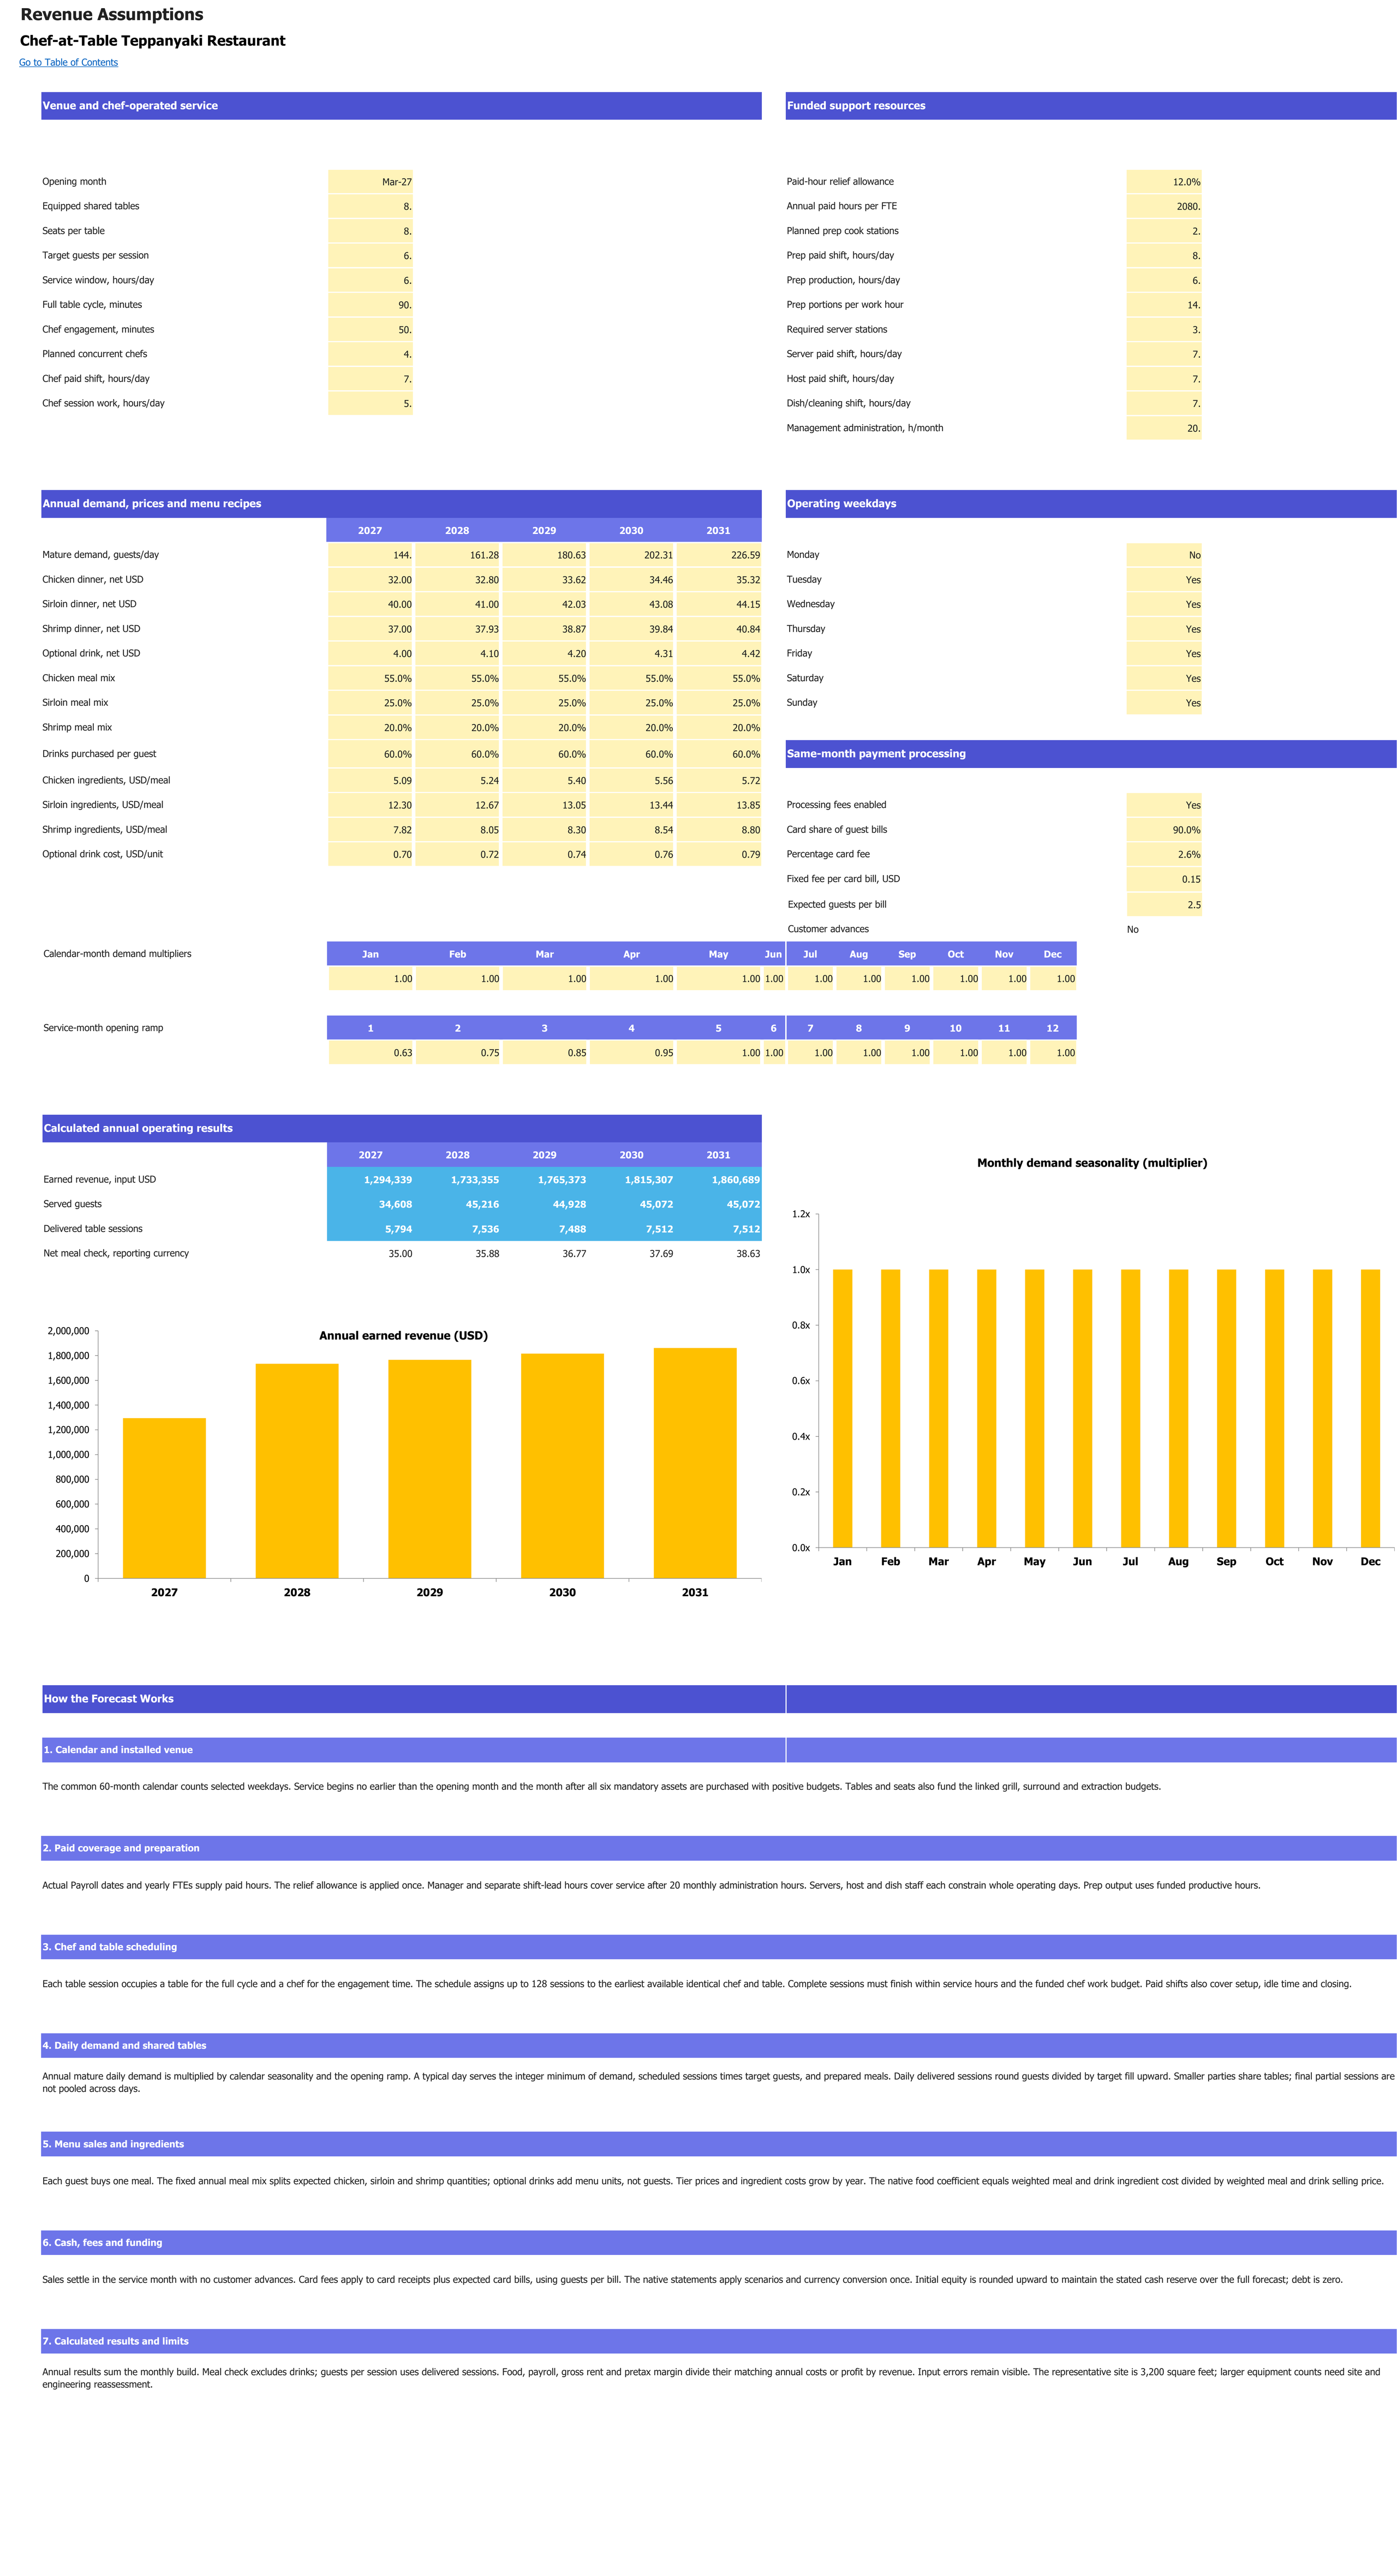
Communal cooking tables, guest demand, service cycles and paid chef capacity. Monetary inputs and sales use USD; operating volumes retain their labelled units. Forecast years are 2027–2031.
Enlarge image in a new tab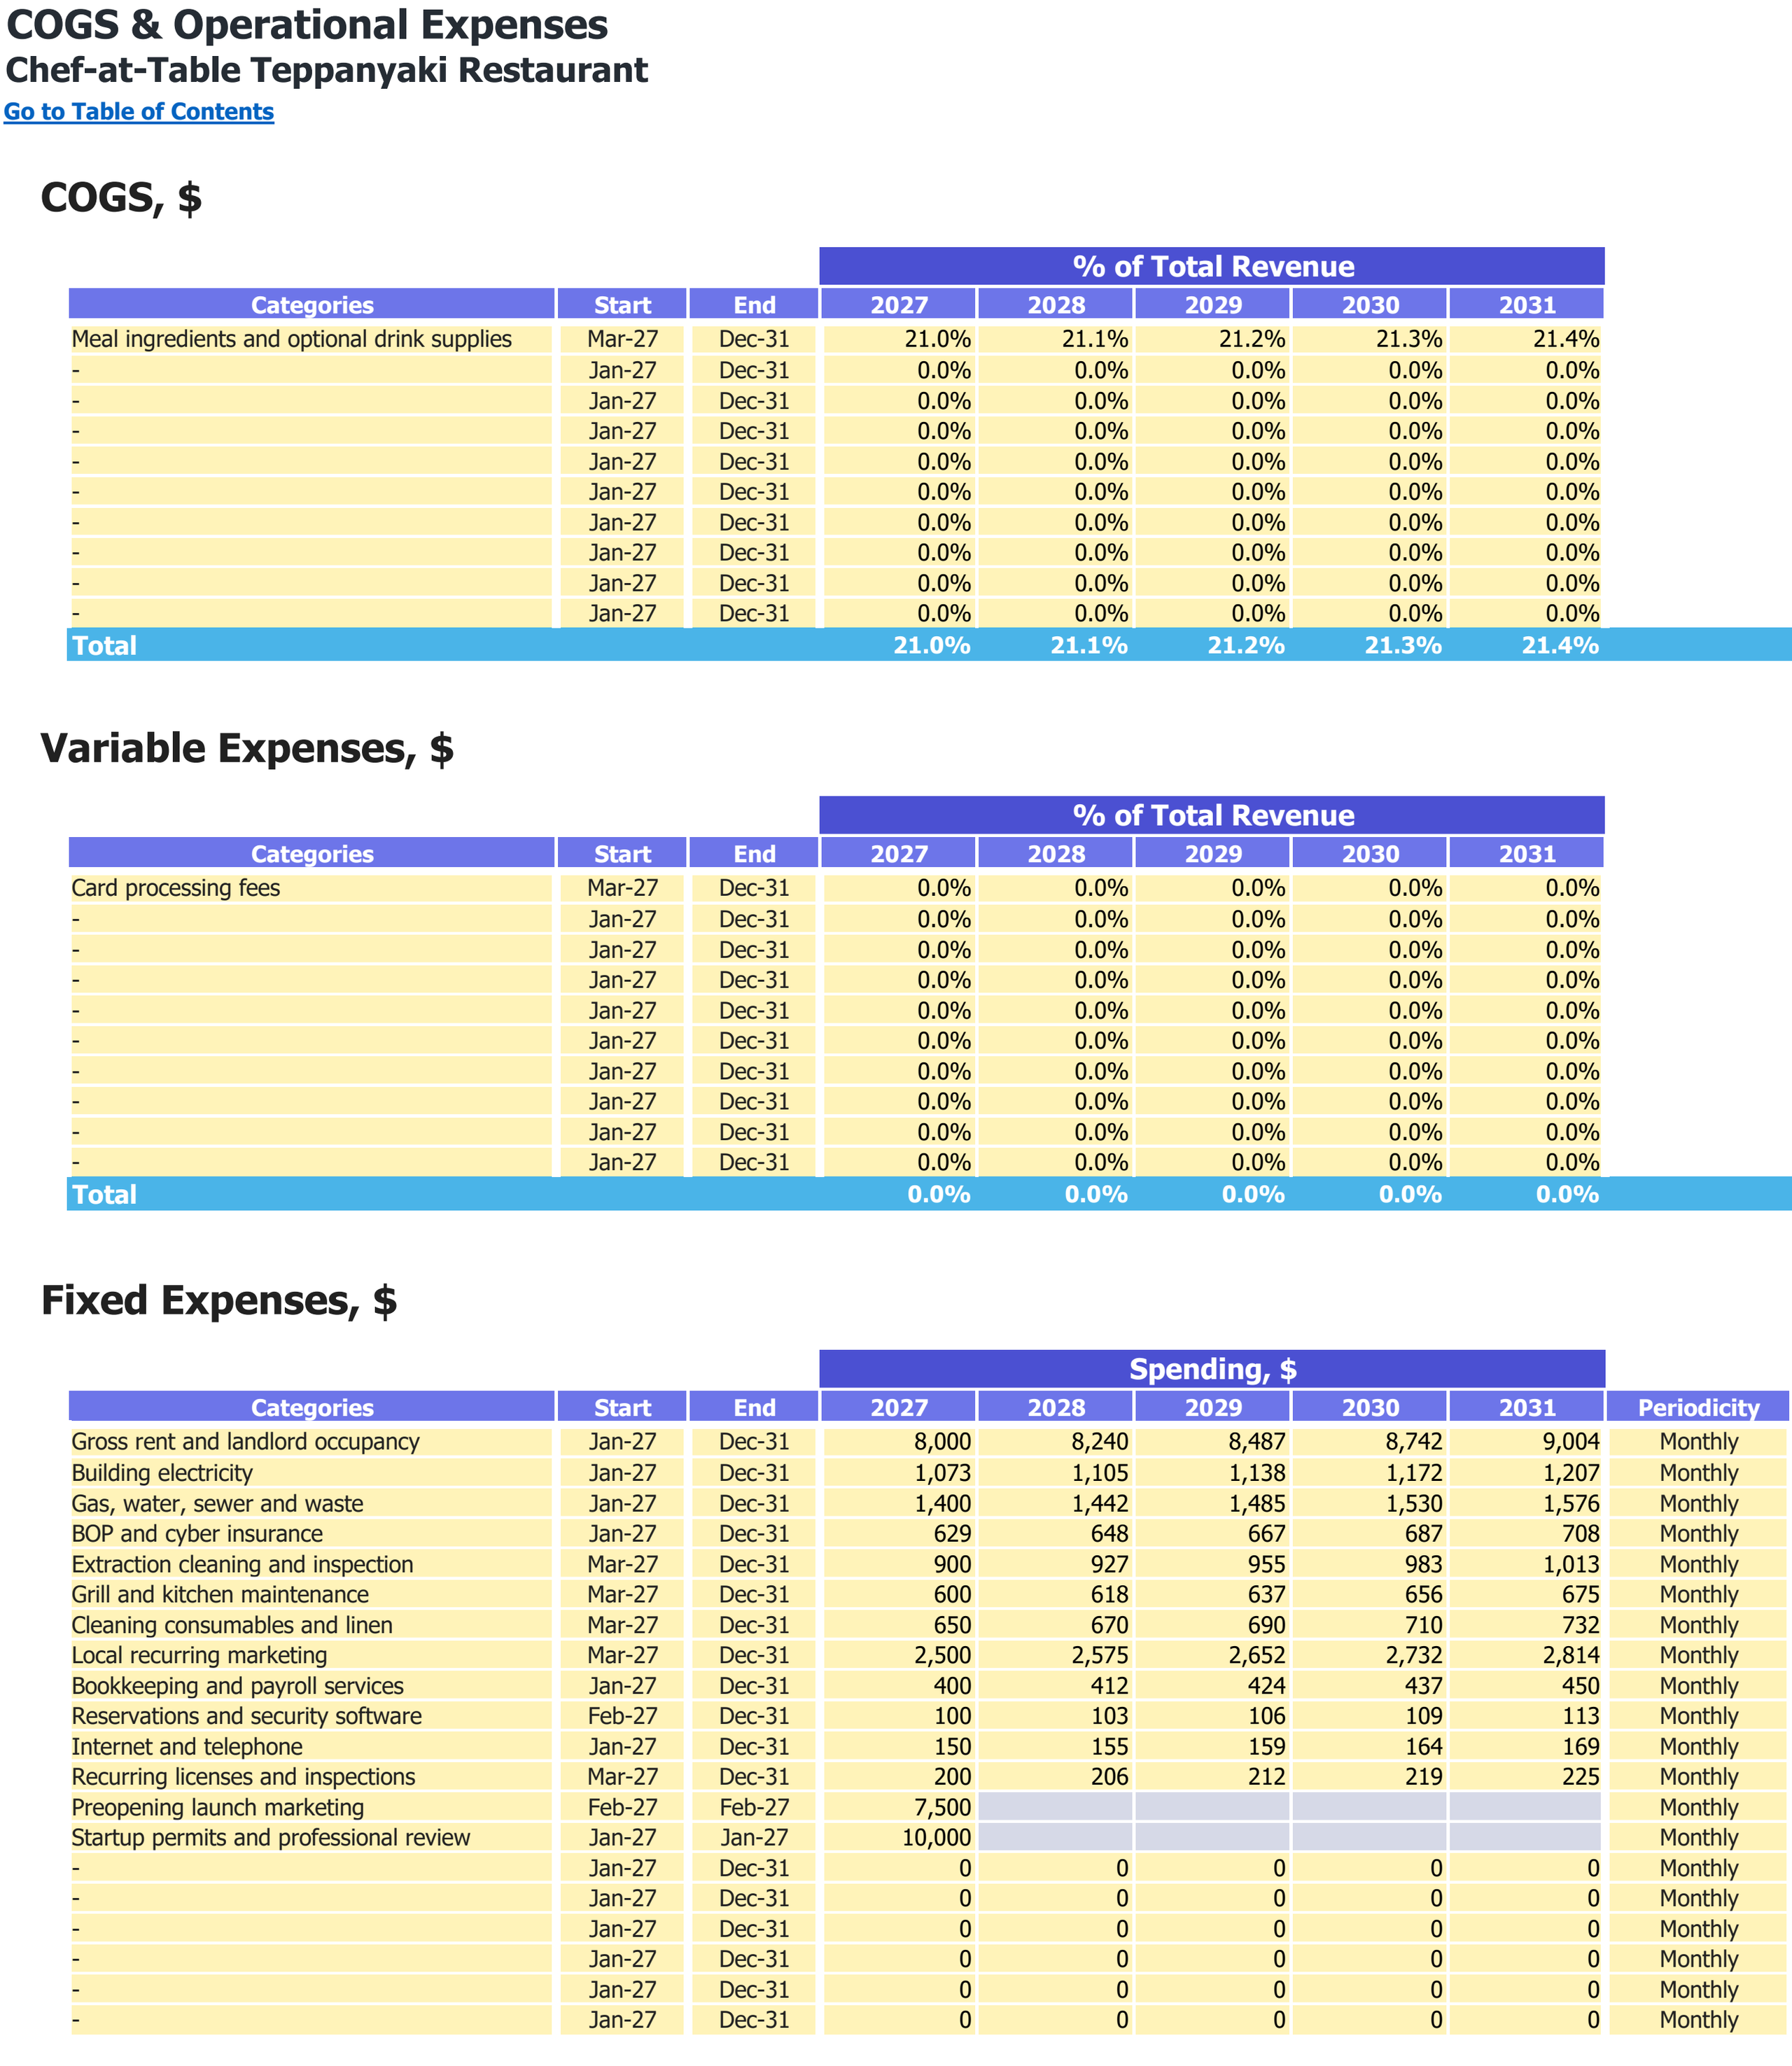
Food and other direct-cost categories, variable expense shares and fixed operating expenses. Monetary inputs are USD; the annual percentage columns are cost shares of revenue.
Enlarge image in a new tab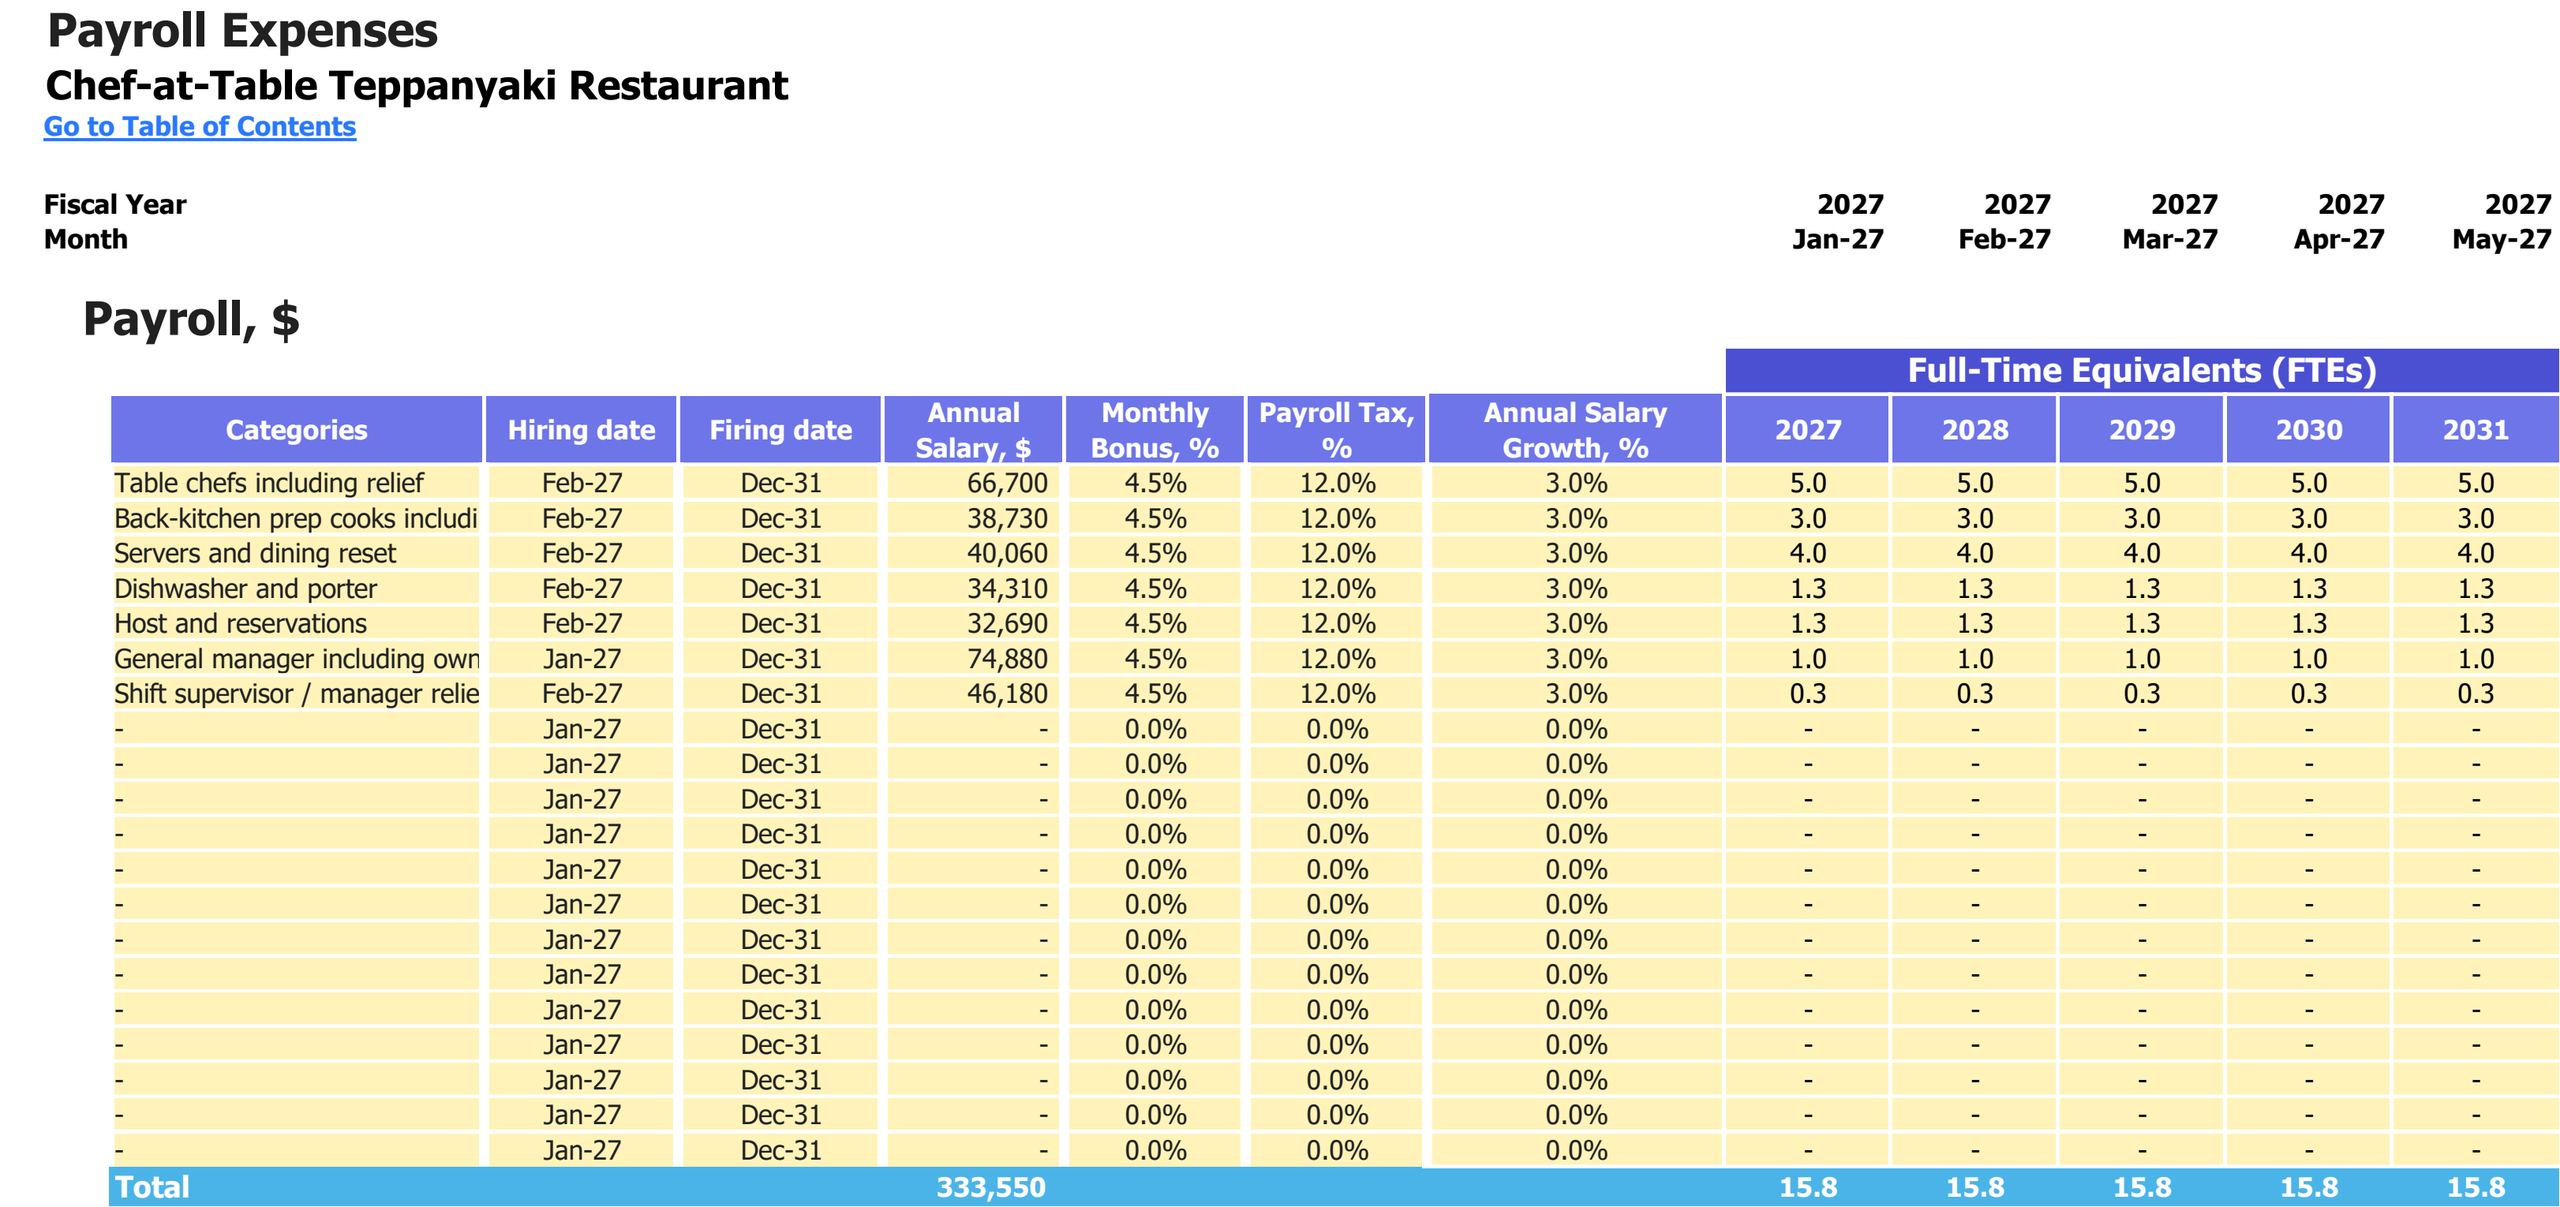
Paid roles, annual salary and employer-load assumptions, with staffing in full-time equivalents for 2027–2031. Salary amounts are USD; percentages and FTEs are labelled separately.
Enlarge image in a new tab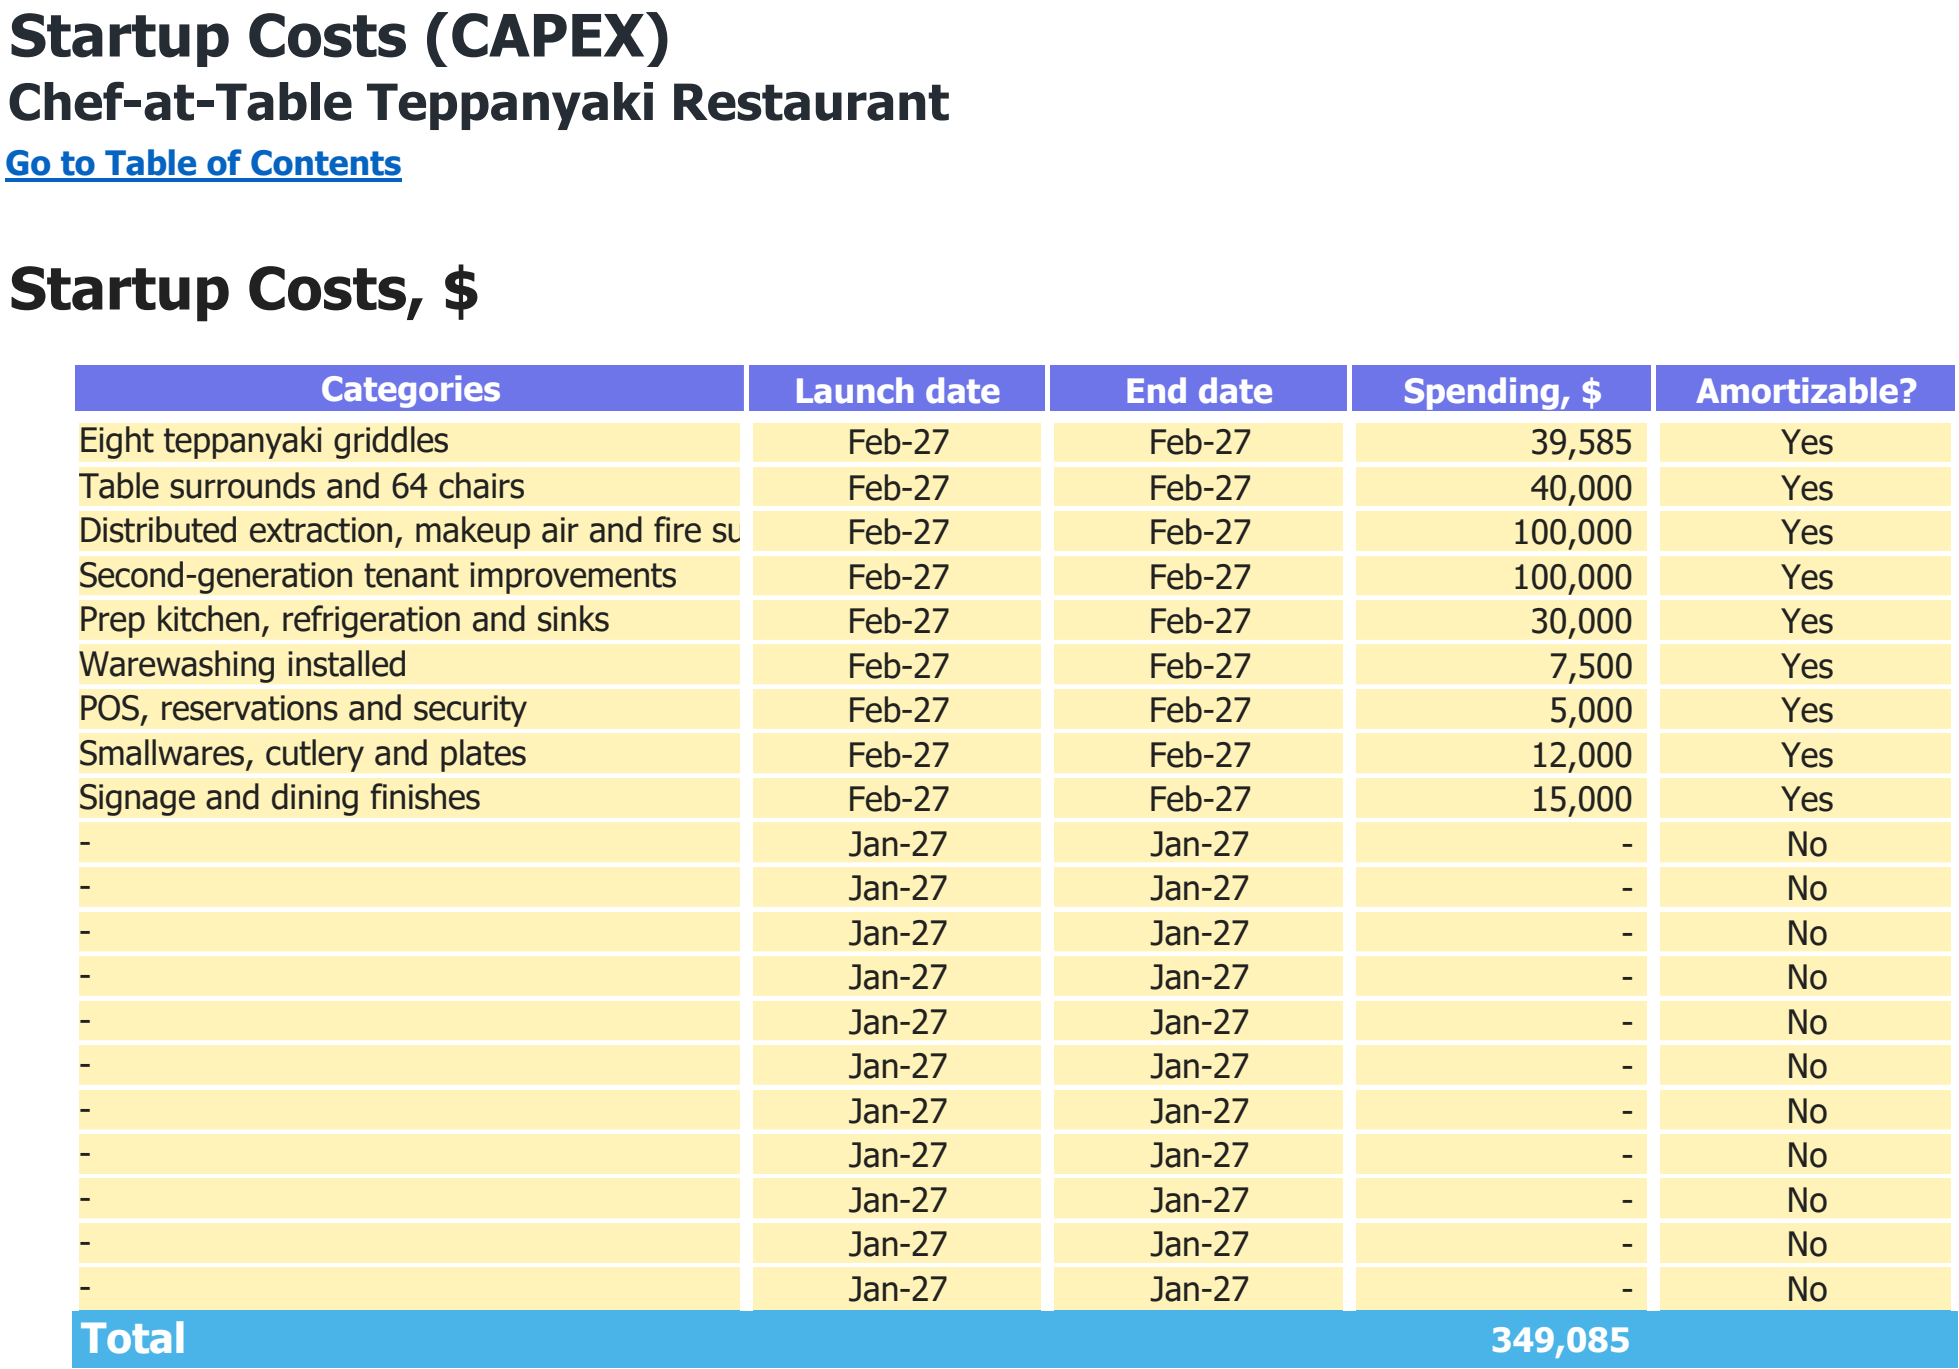
Asset categories, purchase dates and spending assumptions in USD. The total includes every scheduled purchase shown, including later replacements where present.
Enlarge image in a new tab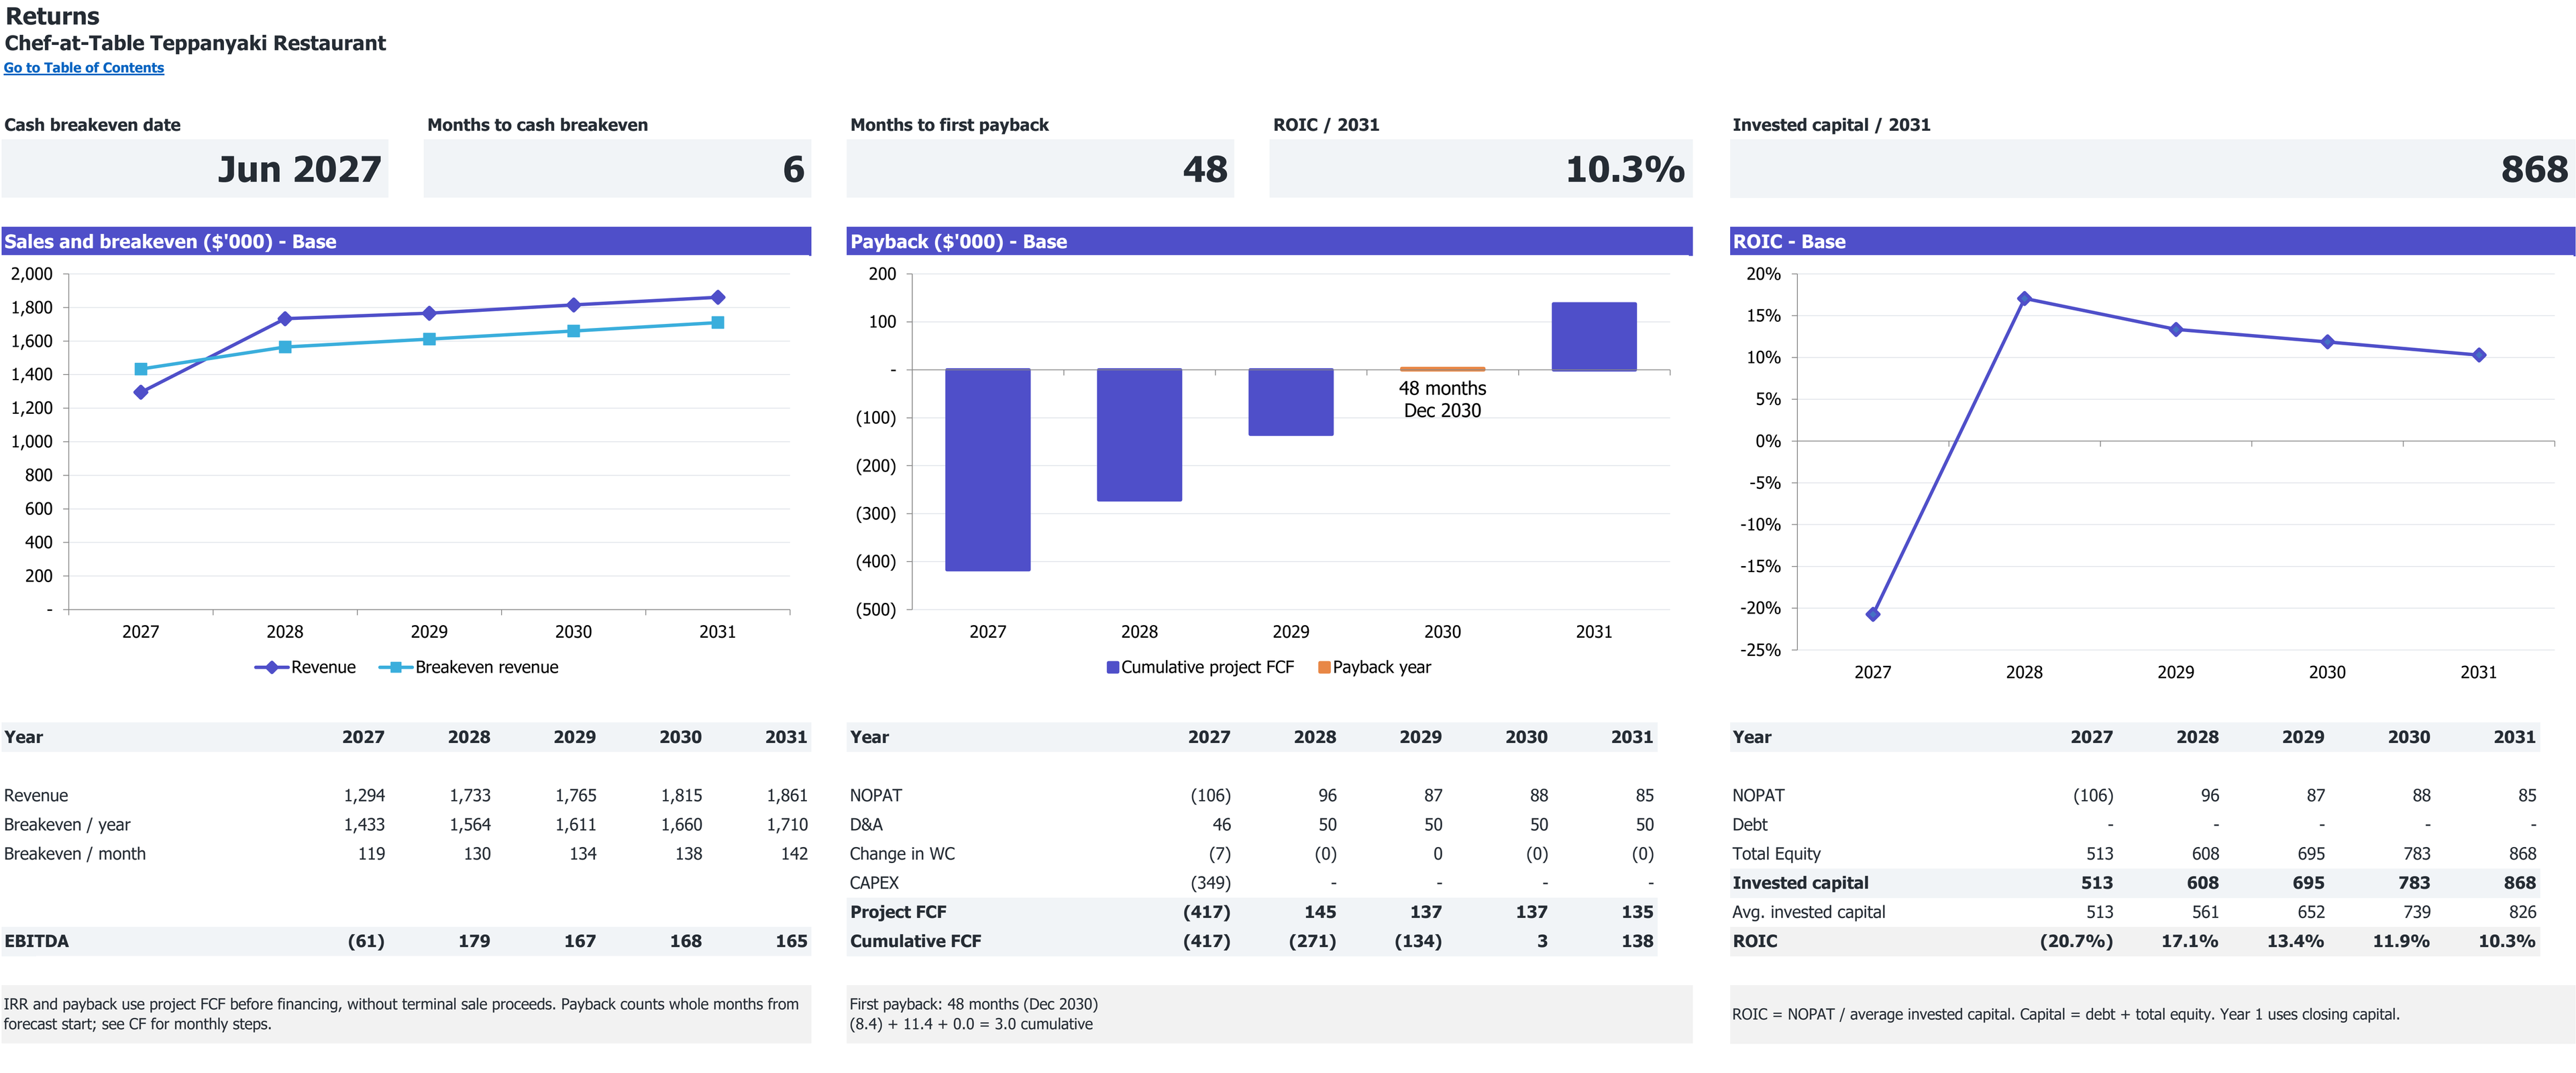
Excerpt from Returns: cumulative project free cash flow and first payback, if reached. 2027–2031 base case; dollar amounts in thousands.
Open full Returns view in a new tabExcerpt from Returns: revenue, annual and monthly break-even revenue, and EBITDA. 2027–2031 base case; dollar amounts in thousands.
Open full Returns view in a new tab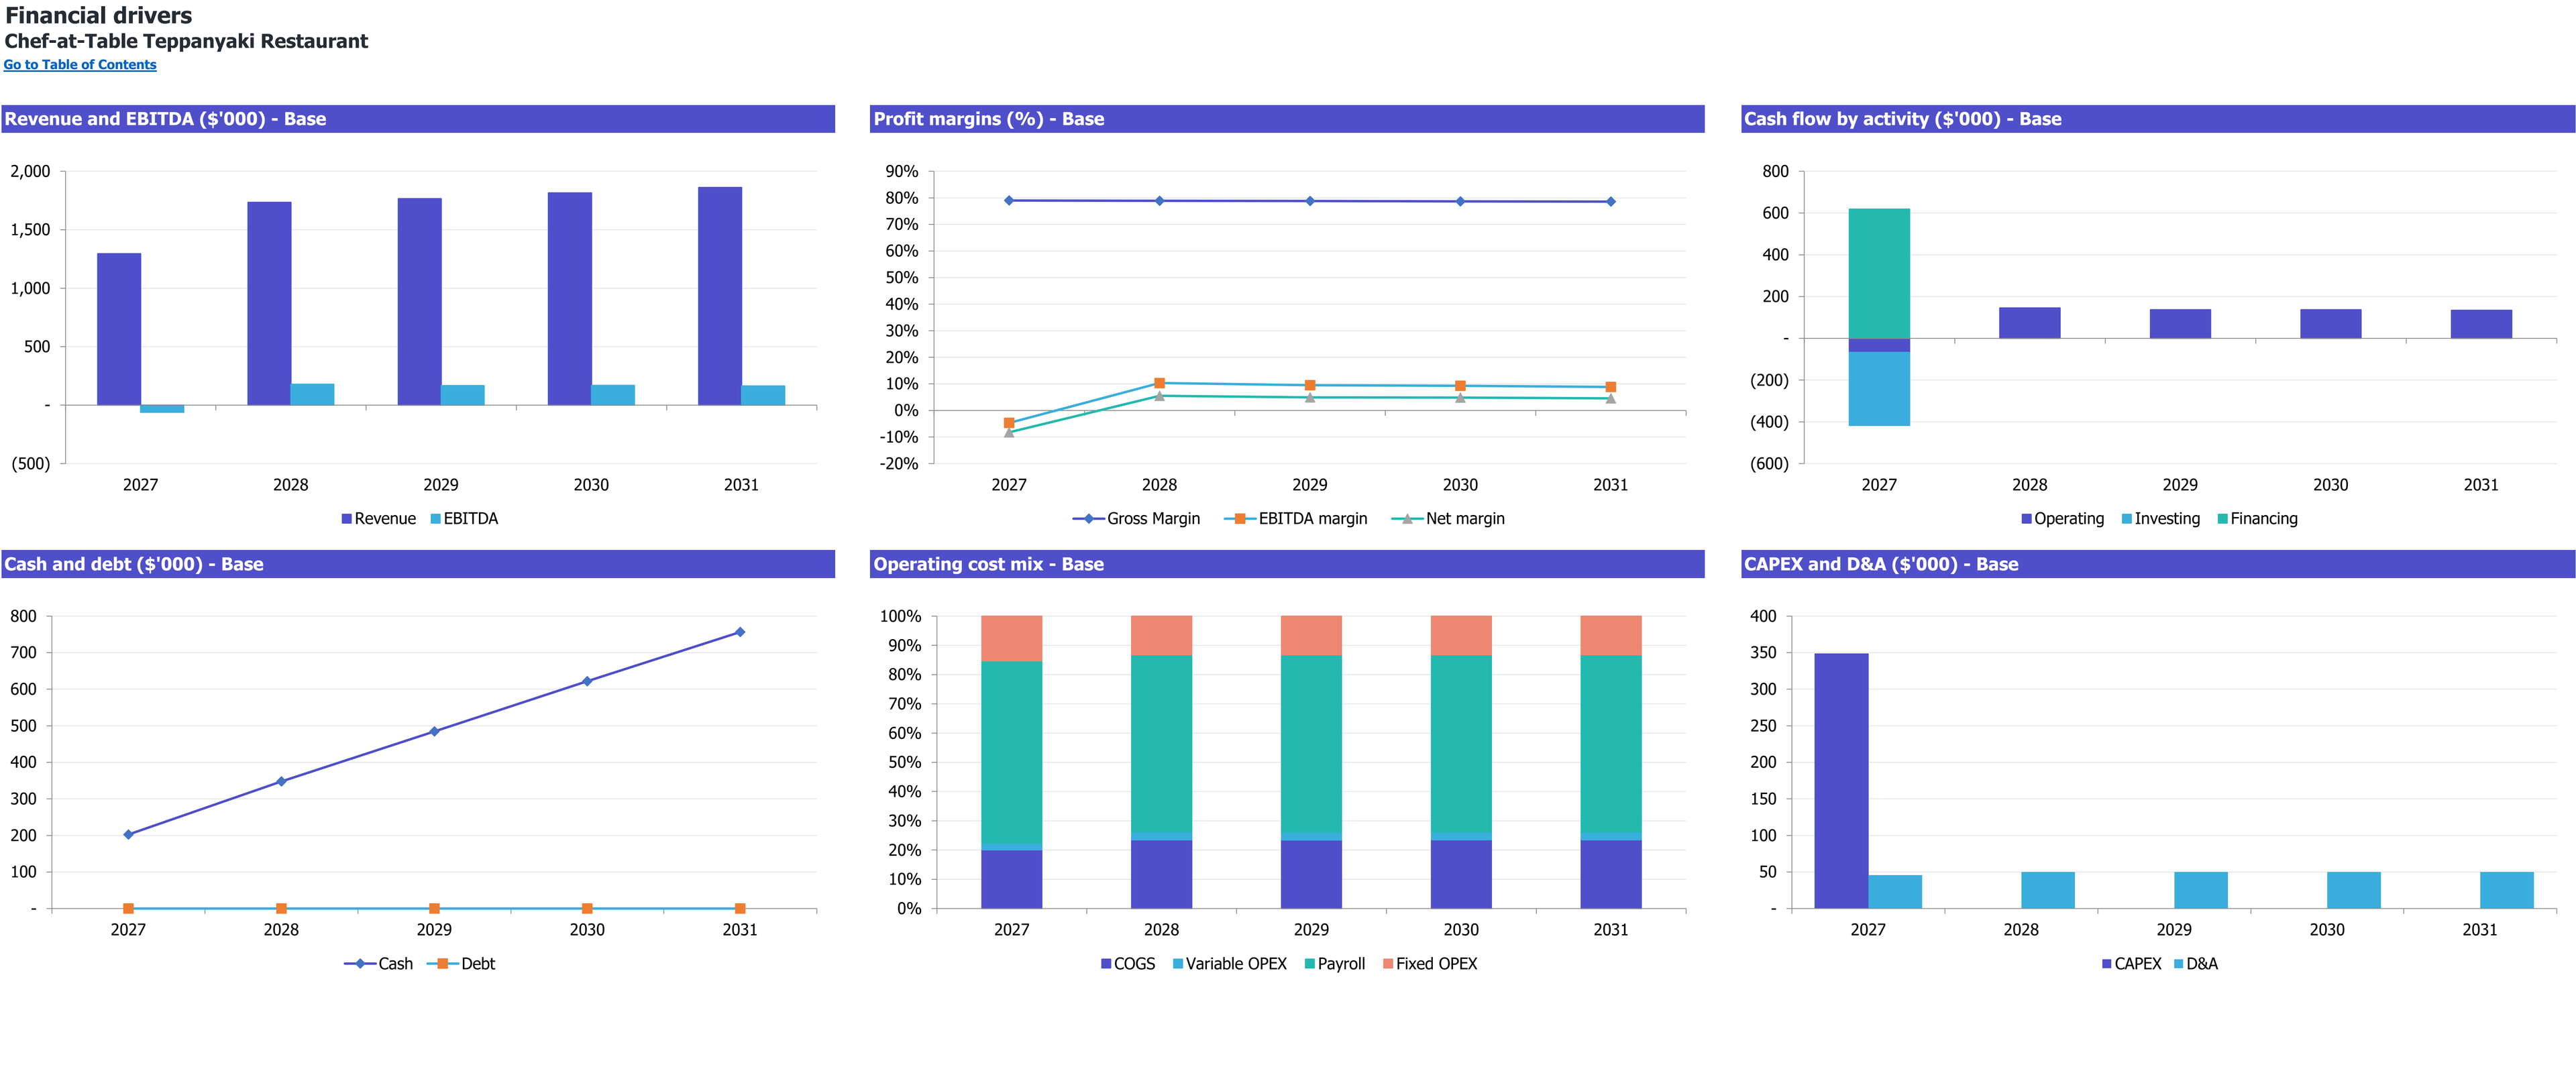
Six annual financial-driver charts for Chef-at-Table Teppanyaki Restaurant, 2027–2031 (Base scenario). Dollar amounts are in thousands; margins and cost mix are percentages.
Enlarge image in a new tab8 selected worksheet views. Figures show this workbook’s starting case.
Workbook availability
What is inside the Excel model
Test how chefs and communal tables work together through complete service cycles. Connect served guests, included-side meals and optional drinks to paid staffing, table-linked assets and cash recovery.
Selected worksheets from the documented workbook. Forecast period: January 2027–December 2031. Model reference: PHY001-14.
Inputs you control. Results you can inspect.
On a small screen, scroll within the table to read every column.
| Planning area | Inputs you review | How they connect | Results to inspect |
|---|---|---|---|
| Tables and chefs | Eight tables, four planned concurrent chefs, six target guests/session. | Schedule each start when both assigned resources are available. | 24 baseline daily sessions / 144 target-fill guests. |
| Time and preparation | 50 chef minutes; 90 table minutes; funded back-kitchen portions. | Require table clearance and chef productive time within the window. | Feasible sessions and served guests. |
| Menu economics | Chicken, sirloin and shrimp mix; 60% optional drink attachment. | Price meals once and add purchased drinks without extra guests. | Meal/drink sales, recipe costs and processing. |
| Staff and assets | Paid relief, support roles and six mandatory opening bundles. | Link capacity to paid hours and opening to asset readiness. | Funded operation and delayed-opening exposure. |
| Cash | All-equity financing and a $100,000 reserve objective. | Cover peak financing-free cash deficit, rounded up to $1,000. | Required equity and minimum monthly balance. |
Is this the right model for your business?
Check the starting case before changing the assumptions.
The starting operation
- A communal-table restaurant where chefs prepare included-side meals at the table.
- An operator planning alternating chef and table cycles.
- A founder testing demand against a service-heavy payroll and all-equity funding.
Check the boundary
The case excludes alcohol, buffet service, sushi-bar revenue, delivery, debt financing and customer advances.
Compare the other restaurant typesHow this business makes money
Connect the unit sold to the resources required by this operating case.
Revenue logic
Served guests buy one entree bundle, with optional nonalcoholic drinks on the same bill.
Sold menu units combine entrees and drinks; guest and table-session counts remain separate.
Why can eight cooking tables need fewer chefs but still hit a chef constraint?
Chef engagement ends before the table clears, allowing one chef to move between tables. Starts must still fit both resources’ availability and the paid productive-minute budget. The integer schedule therefore matters more than adding independent seat and chef capacities.
- Chef engagement
- 50 minutes/session
- Table cycle
- 90 minutes/session
- Baseline schedule
- 24 sessions/day at six target guests
What to establish for your own operation
- Time complete chef engagements and table clearance.
- Test actual shared-table fill and demand against fixed payroll.
- Check site engineering and support capacity before adding tables.
Follow the plan from demand to cash
Open each section for the assumptions, calculations, and limits of this workbook’s starting case.
Schedule chefs and tables as separate resourcesRevenue
A chef is engaged for 50 minutes while the table remains occupied for 90 minutes including dining, payment and reset. Four chefs can alternate eight tables through 24 daily sessions in the saved schedule. At six target guests per session, the resulting ceiling is 144 guests/day.
Partly filled sessions still consume a complete table cycle and chef engagement. The model also checks funded preparation, service and support resources. A table-only capacity calculation would overstate this operating case.
- The final session can contain fewer than six guests.
- Daily demand is capped after its launch ramp; March starts at 90 guests/day.
- Opening follows the latest mandatory asset purchase by at least one month.
Tie equipped tables to investment and opening readinessCAPEX
Initial capital is $349,085.28. Griddles, surrounds/chairs and distributed extraction scale with table inputs; other installed bundles include tenant works, preparation, warewashing and supporting equipment. More tables do not automatically fit the fixed premises.
January equity is $619,000 with no debt. It covers a $518,895.34 financing-free cash deficit plus the $100,000 reserve, rounded upward. Minimum funded cash is $100,104.66 in May 2027.
- The capital budget and operating/working-capital deficit are separate uses.
- Assets use seven-year depreciation from purchase, including preopening purchases.
- Inventory is seven days; receivables, payables and advances are zero.
Test the attendance required by paid service capacityCF
Base 2027 revenue is $1,294,339 from 34,608 served guests, with EBITDA of −$60,613. Monthly EBITDA and operating cash first turn positive in June 2027 and stay positive thereafter.
Project payback occurs in December 2030, month 48. It is cumulative undiscounted unlevered cash recovery, including startup losses and investment, without terminal proceeds. It does not repay the shareholder’s contribution through distributions.
- Holding mature demand at 90 guests/day produces a −$1,539,509.15 minimum cash balance with original equity fixed.
- Later price growth does not create more service capacity.
- An extreme final-month launch exposes a disclosed native IRR convergence limit.
Selected results from the starting case
Modeled results in USD unless stated otherwise. These describe the selected inputs, not an estimate for your location or a guaranteed outcome.
- 2027 revenue
- $1,294,339USD, Base; two setup months and ten service months.
- 2027 EBITDA
- −$60,613USD, Base; full calendar-year result.
- Initial CAPEX
- $349,085.28USD; table-linked equipment and supporting asset bundles.
- Minimum cash
- $100,104.66USD, funded Base balance in May 2027.
- Project payback
- December 2030 / month 48Cumulative undiscounted project FCF recovery from January 2027, with no later reversal.
Make the case your own
Work from the operating plan toward the cash requirement.
Enter table count, shared fill and chef/table timings.
Match paid resource budgets and mandatory purchases to opening.
Replace recipes, prices, installed bids and premises costs.
Review demand downside, required equity and project recovery separately.
Interpretation and scope
- National analytical inputs do not establish local demand, lease terms or engineering feasibility.
- Fixed expected menu mix underpins the exact annual percentage food-cost relationship.
- Same-month settlement omits processor transactions crossing month end.
- The 26% planning tax rate has no chosen jurisdiction and carries no losses between years.
- The native IRR solver may display n.a. in an extreme negative-return boundary despite a mathematical root.
The workbook is an Excel file for local planning. Learn how to interpret assumptions and evidence.
Other restaurant types
Each operating type calls for its own financial structure.
Questions
Are 64 seats the daily sales ceiling?
No. Chef/table scheduling and funded support resources determine feasible daily guests.
Are drinks counted as extra diners?
No. They add sold menu units and revenue while guest counts remain separate.
Does a half-full table use half a chef cycle?
No. Every delivered session uses the full modeled engagement and occupancy cycle.
Does adding tables scale all costs?
No. Three designated asset bundles scale; premises and other budgets still need review.
Is the $619,000 funding a loan?
No. It is a single initial equity contribution; debt and owner distributions are zero.
Can I buy this model now?
No. Purchasing and workbook downloads are not available on this site.
Which software does the workbook use?
The documented file is an Excel workbook (.xlsx). Compatibility with other spreadsheet applications is not established by the file extension.
Read the planning guides
Explore the relevant operating questions and how to interpret a workbook’s assumptions.
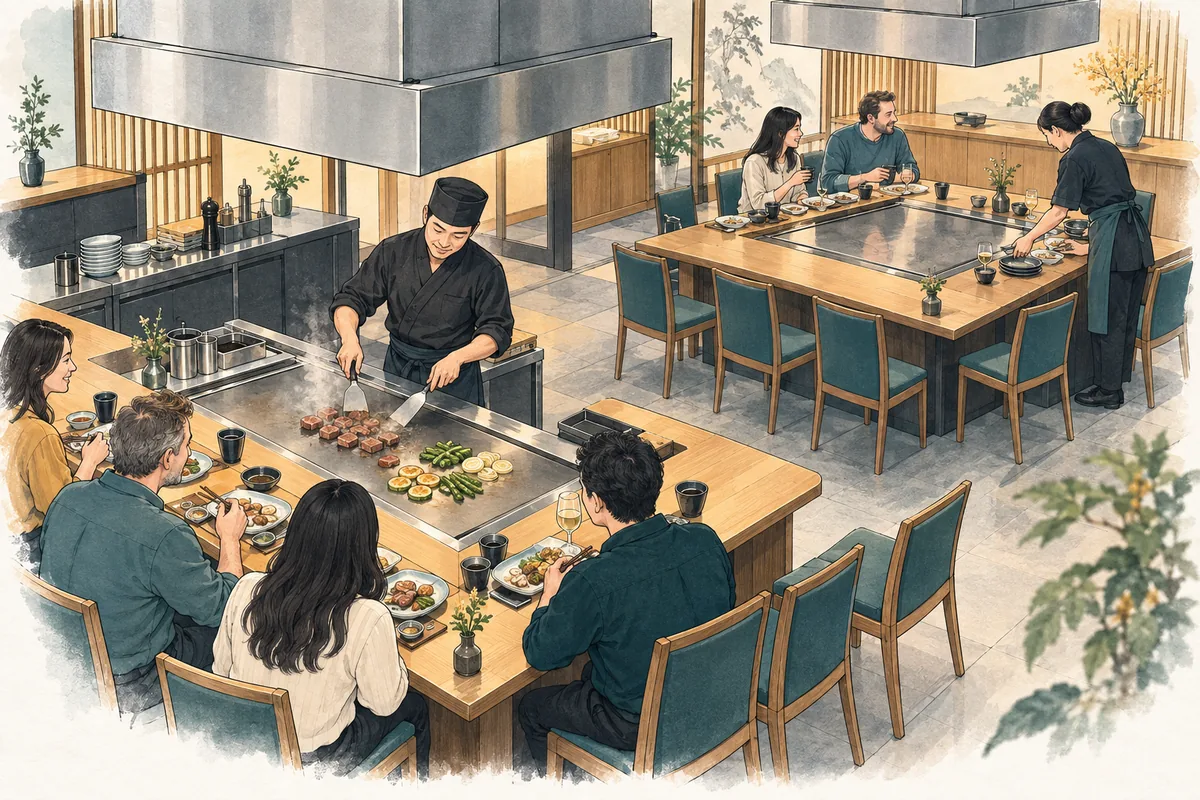
How do chefs and table cycles jointly limit teppanyaki covers?
Follow communal-table fill, chef engagement, table clearing, and funded support shifts to calculate a feasible teppanyaki service schedule.
Read the guide
How to read financial assumptions before editing an Excel model
Follow the chain from operating assumptions to calculated results, check units and timing, and keep a useful record of changes to a financial workbook.
Read the guideEvidence and scope
Primary operator examples support only the operating features described in the source registry. This full configuration, all formulas, local feasibility and numerical economics remain analyst-authored and unverified.
The links below provide operating-format context; they do not verify the workbook’s selected inputs or calculated returns.
The workbook guide and figures describe model PHY001-14, revision r02, for January 2027–December 2031. These are a documented planning case, not observed results for a particular business.