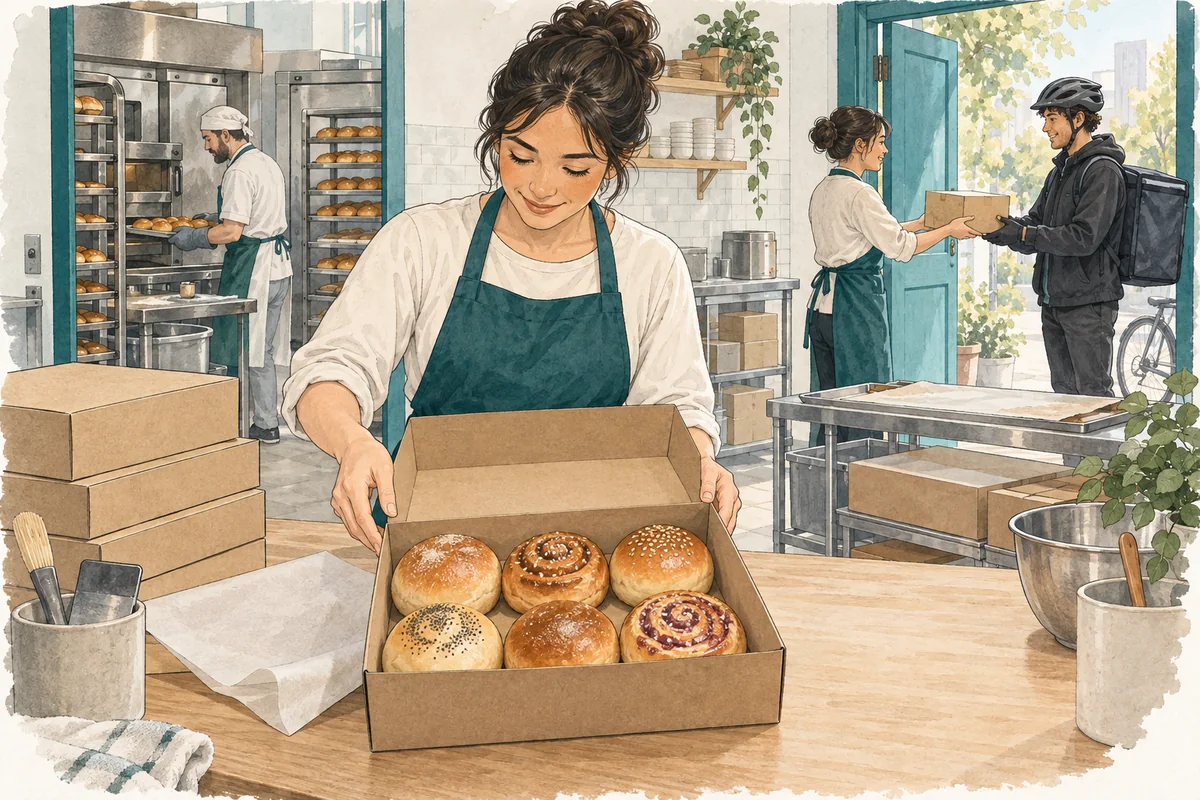
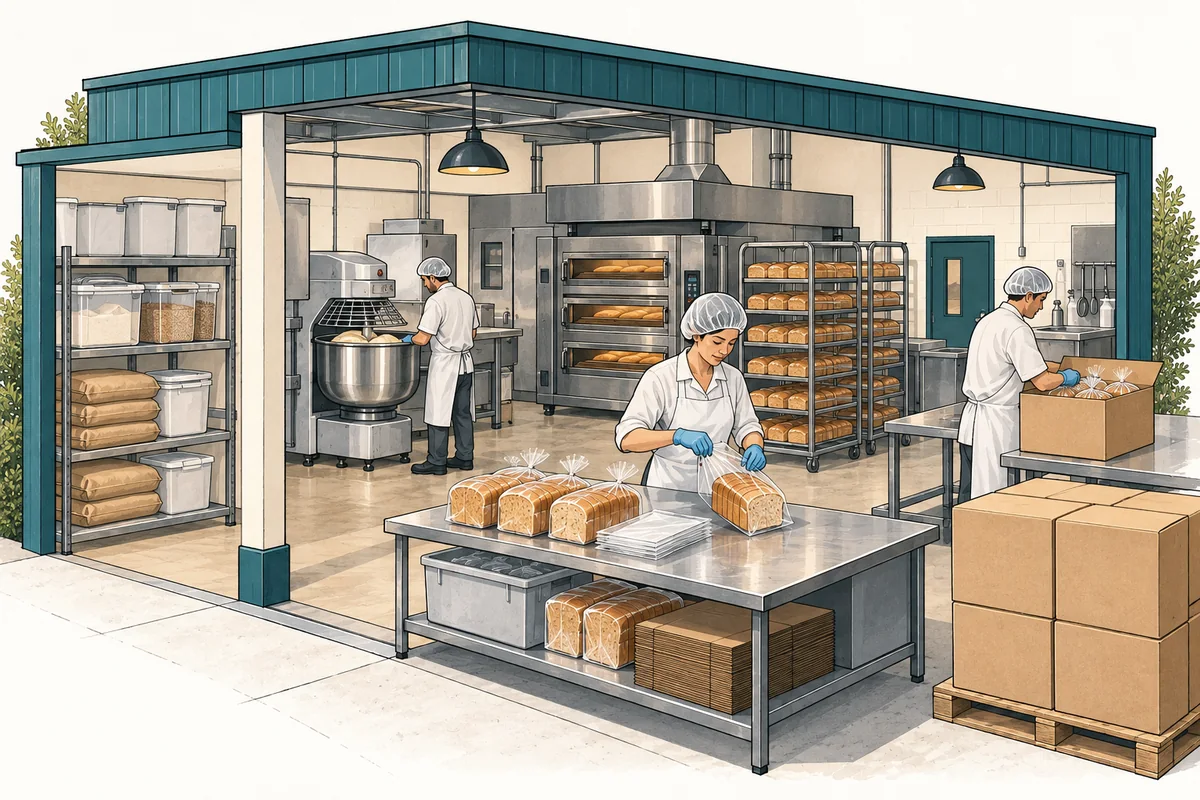
The bakery cafe case models one 2,400-square-foot U.S. cafe with 48 seats, in-house baking, and seated counter-order sales. It excludes takeaway, wholesale, catering, and subscriptions. The Base forecast covers January 2027–December 2031 in USD. The following 2027 prices, production rates, losses, and guest purchases are selected assumptions rather than measured bakery averages.
How do gross bakery items become saleable products?
The oven budget is six racks × twelve items × eight daily batches = 576 gross bakery items per open day. Mixing capacity is 640 and proofing capacity is 648 items per day, so the oven is the lowest gross production limit. Gross items include output that will not become a customer sale.
First, a 3% process loss leaves 576 × 97% = 558.72 good items. Then an 8% unsold allowance applies to that good output, leaving 558.72 × 92% = 514.0224 saleable items per day. Combined saleable yield is 97% × 92% = 89.24%; the two loss percentages have different bases and should not simply be added.
At 1.8 bakery items per served guest, the oven supports 514.0224 ÷ 1.8 = 285.568 expected guests per day. These fractional values express a planning average across activity, not a literal instruction to bake fractional products or seat part of a person. Recipe batches and actual production schedules still need whole-unit planning.
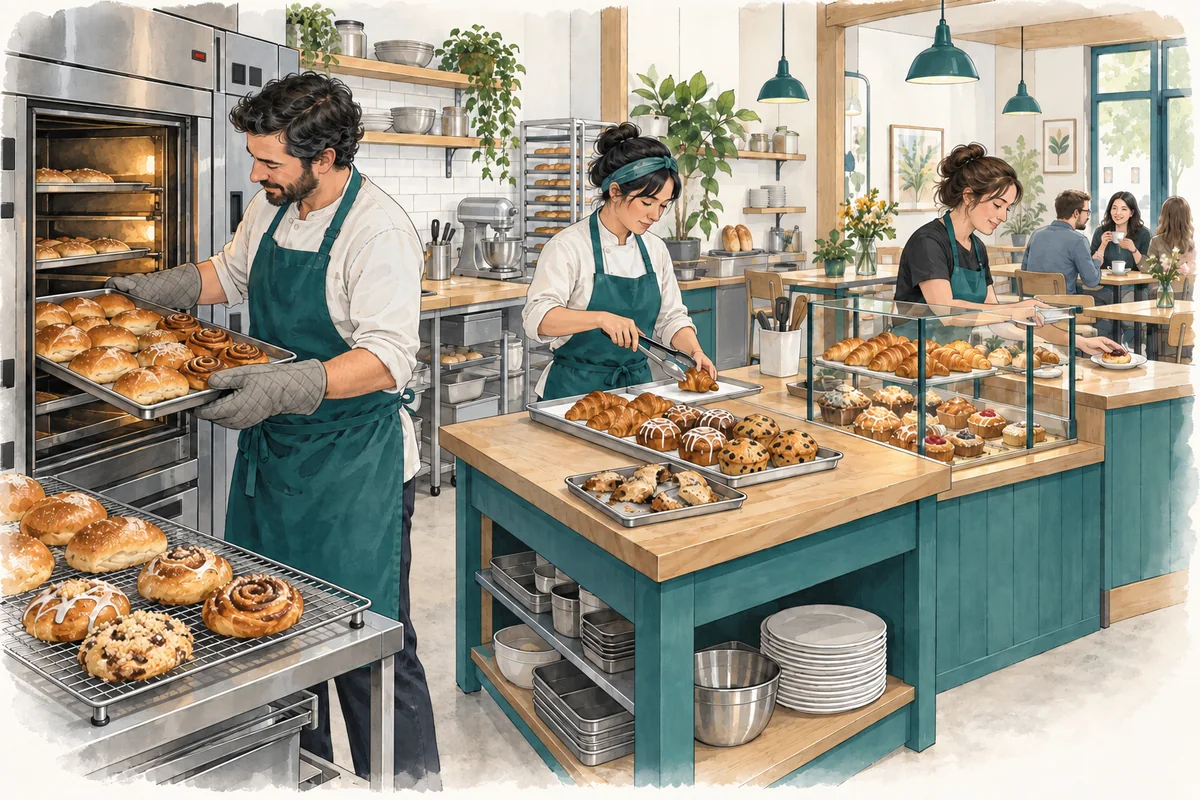
Which resource sets the guest ceiling?
Convert every resource to guests per open day before comparing it. The selected seating limit is 48 seats × six feasible turns = 288 guests. That is slightly above the oven’s 285.568-guest limit, so adding seats alone would not increase the illustrated maximum at the same baking output, losses, and purchase mix.
On a narrow screen, scroll within the table to compare all resource limits.
| Resource | Conversion to guests | Guest ceiling/day |
|---|---|---|
| Oven output after both losses | 576 × 97% × 92% ÷ 1.8 | 285.568 |
| Seating | 48 seats × 6 turns | 288 |
| Mixing after both losses | 640 × 97% × 92% ÷ 1.8 | 317.30 |
| Proofing after both losses | 648 × 97% × 92% ÷ 1.8 | 321.26 |
| Counter service | 36 guests/hour × 10 hours | 360 |
| Beverage service | 40 drinks/hour × 10 hours ÷ 0.85 drinks/guest | 470.59 |
The table isolates the operating resources; it does not forecast 285.568 daily visitors. The workbook also applies the demand path, opening ramp, monthly seasonality, and actual eligible trading days. Its 2027 starting potential demand is 280 guests per open day before ramp and seasonality, so demand can be lower than the resource ceiling.
Each comparison holds the guest purchase assumptions constant. A guest who buys more bakery items consumes more of the baking capacity; a higher drink attachment uses more beverage capacity. If the menu mix changes, both the unit revenue and each relevant guest-capacity conversion need to change together.
Why do rejects and unsold items still cost money?
The selected bakery ingredient cost is $1.30 per gross item, including items later rejected or left unsold. To sell 1.8 bakery items to one guest at 89.24% saleable yield, the plan needs 1.8 ÷ 89.24% = 2.01703 gross items. Bakery ingredients therefore cost about $2.62 per served guest, compared with $2.34 if the same 1.8 sold items required no losses.
That $2.62 already includes the ingredient effect of both loss stages. Adding another full waste-ingredient charge would count those costs twice. The source case records no finished-goods inventory for rejected or unsold products, and these products earn no revenue. Beverage ingredients and guest service supplies remain separate costs.
The complete selected ticket earns 1.8 × $5.50 for bakery products plus 0.85 × $5.25 for drinks: $14.3625 per served guest, displayed as $14.36. That is expected sales value, excluding sales tax and tips. It is not contribution or profit; drink ingredients, service supplies, card fees, paid staff, and premises costs still need coverage.
What staffing and site assumptions change with capacity?
The source case pays eight full-time equivalents, including the working owner, head baker, bakers, counter/barista team, and prep relief. Its logic funds extra baker FTE when production capacity grows and extra counter/barista FTE when service capacity or selling hours grow. Lower demand retains baseline staffing, so an unused seat or oven slot does not automatically remove payroll.
The physical site is another separate decision. The 2,400-square-foot footprint describes the premises, while rent and fitout have their own inputs. Increasing the area alone does not update either budget. Likewise, an equipment capacity change requires checking the available space, installation budget, production timing, and paid work needed to use it.
Use timed recipe batches, actual loss records, guest purchase mix, and observed seat turns to replace the selected assumptions in the bakery cafe model. Then inspect which limit becomes binding and whether incremental sales cover the added paid resources. The useful expansion is the one supported by demand and the complete production-to-service chain.