
Bakery Financial Model: Bakery Cafe
Plan a seated bakery cafe with baking, proofing, beverage and counter limits, separate food losses, paid staff and startup cash.
- Excel (.xlsx)
- Premises: 2,400 sq ft / 48 seats
- Guest basket: 1.8 bakery items + 0.85 beverages
- Calendar: Tuesday–Sunday / January 2027 trading
Planning several types? Compare 8 bakery formats
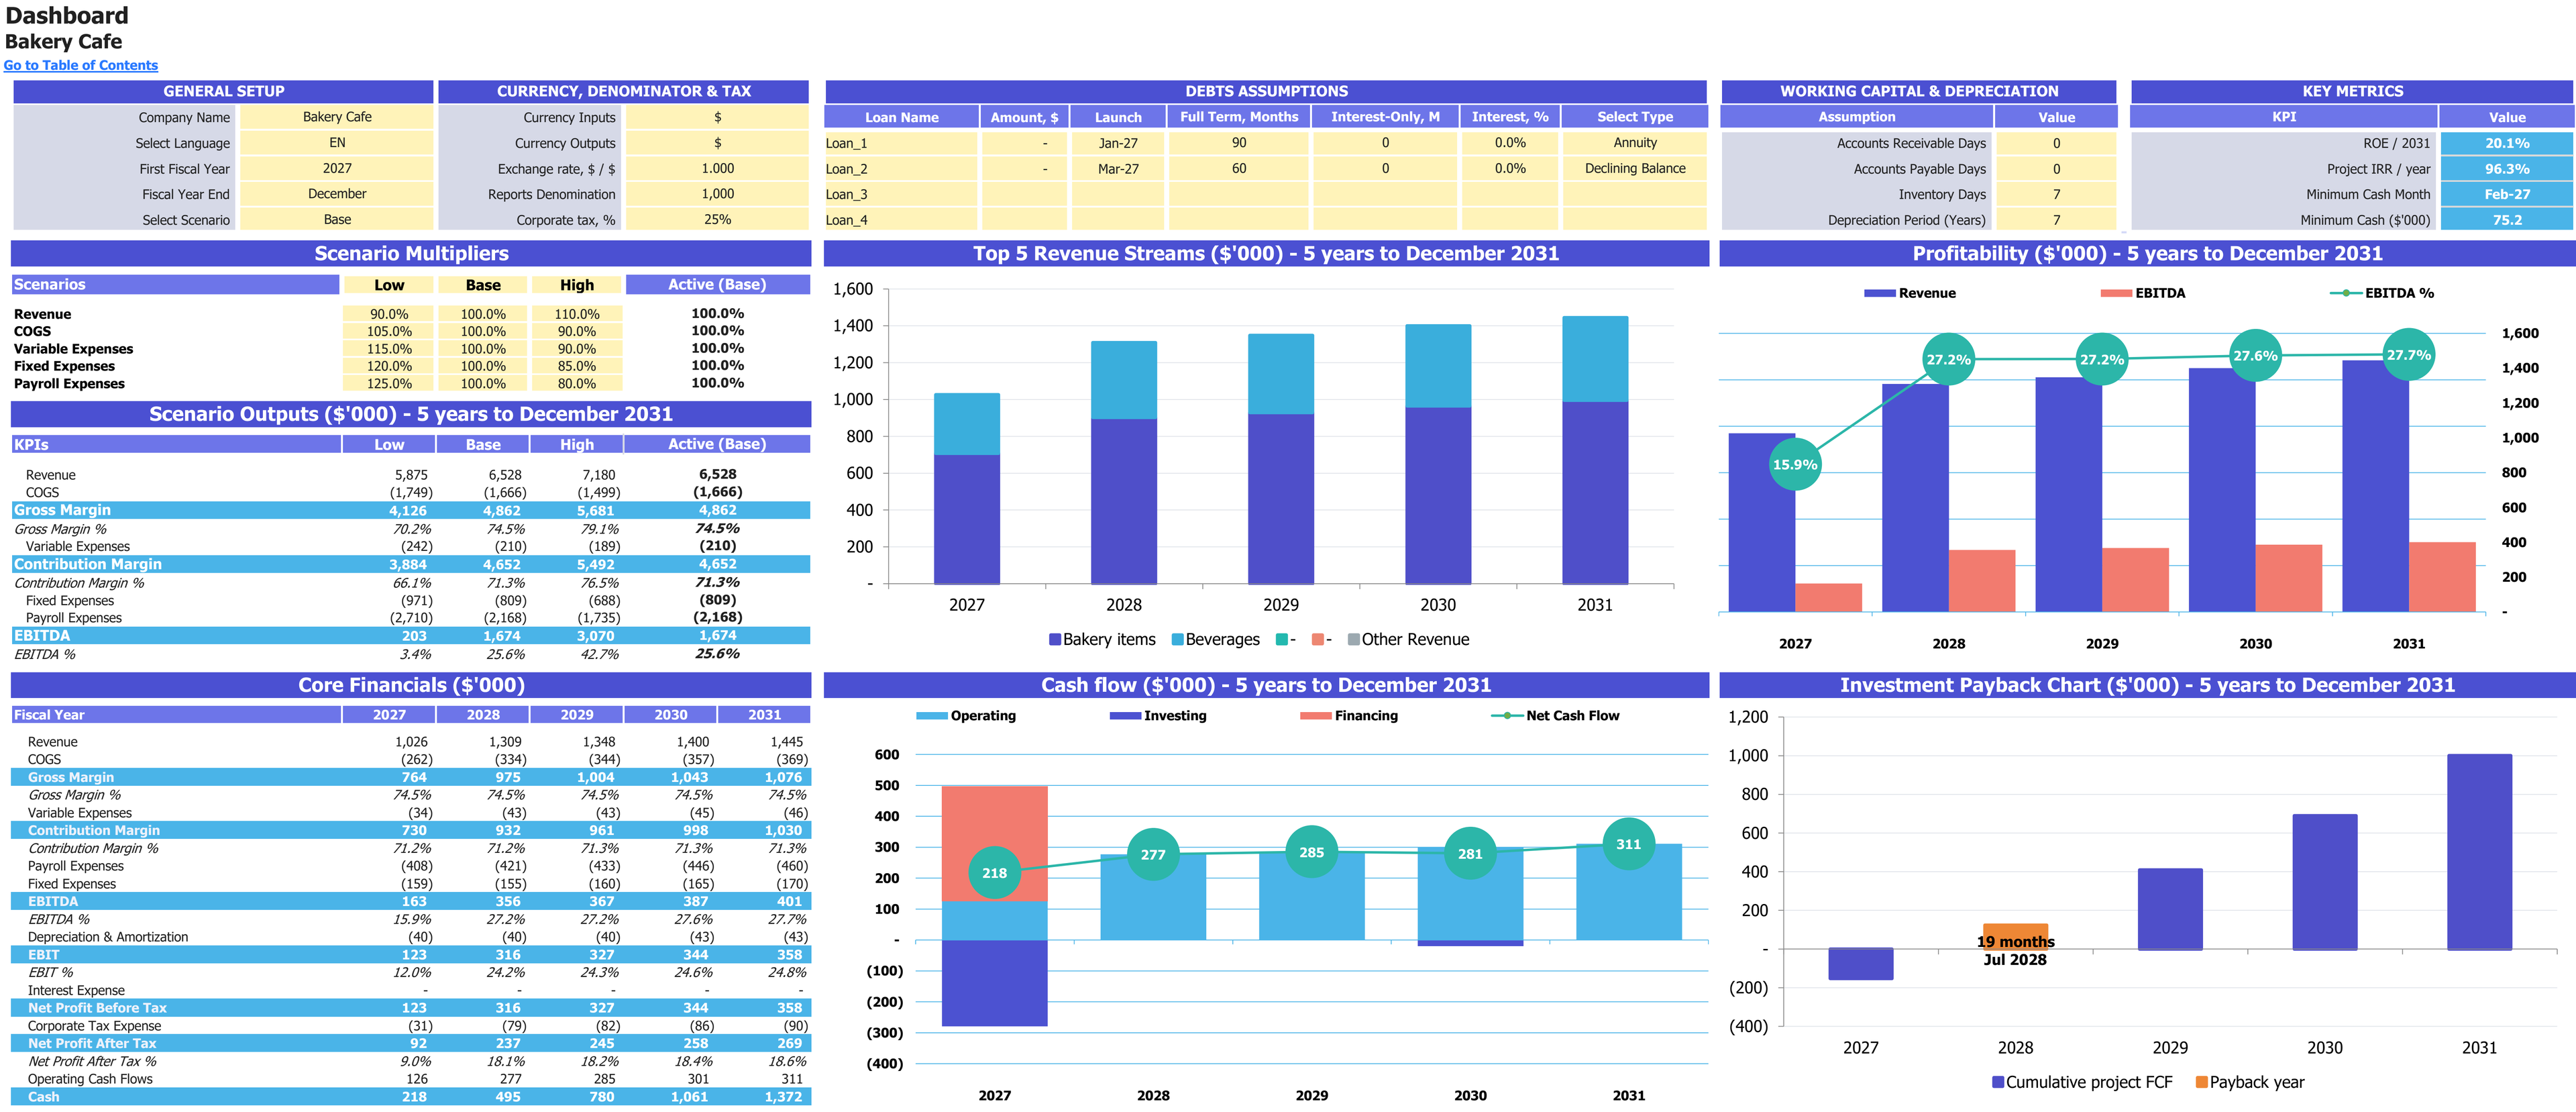
Base-case scenario controls, annual financial results and charts for 2027–2031. Financial report amounts are shown in thousands of USD; percentage measures retain their own units.
Enlarge image in a new tab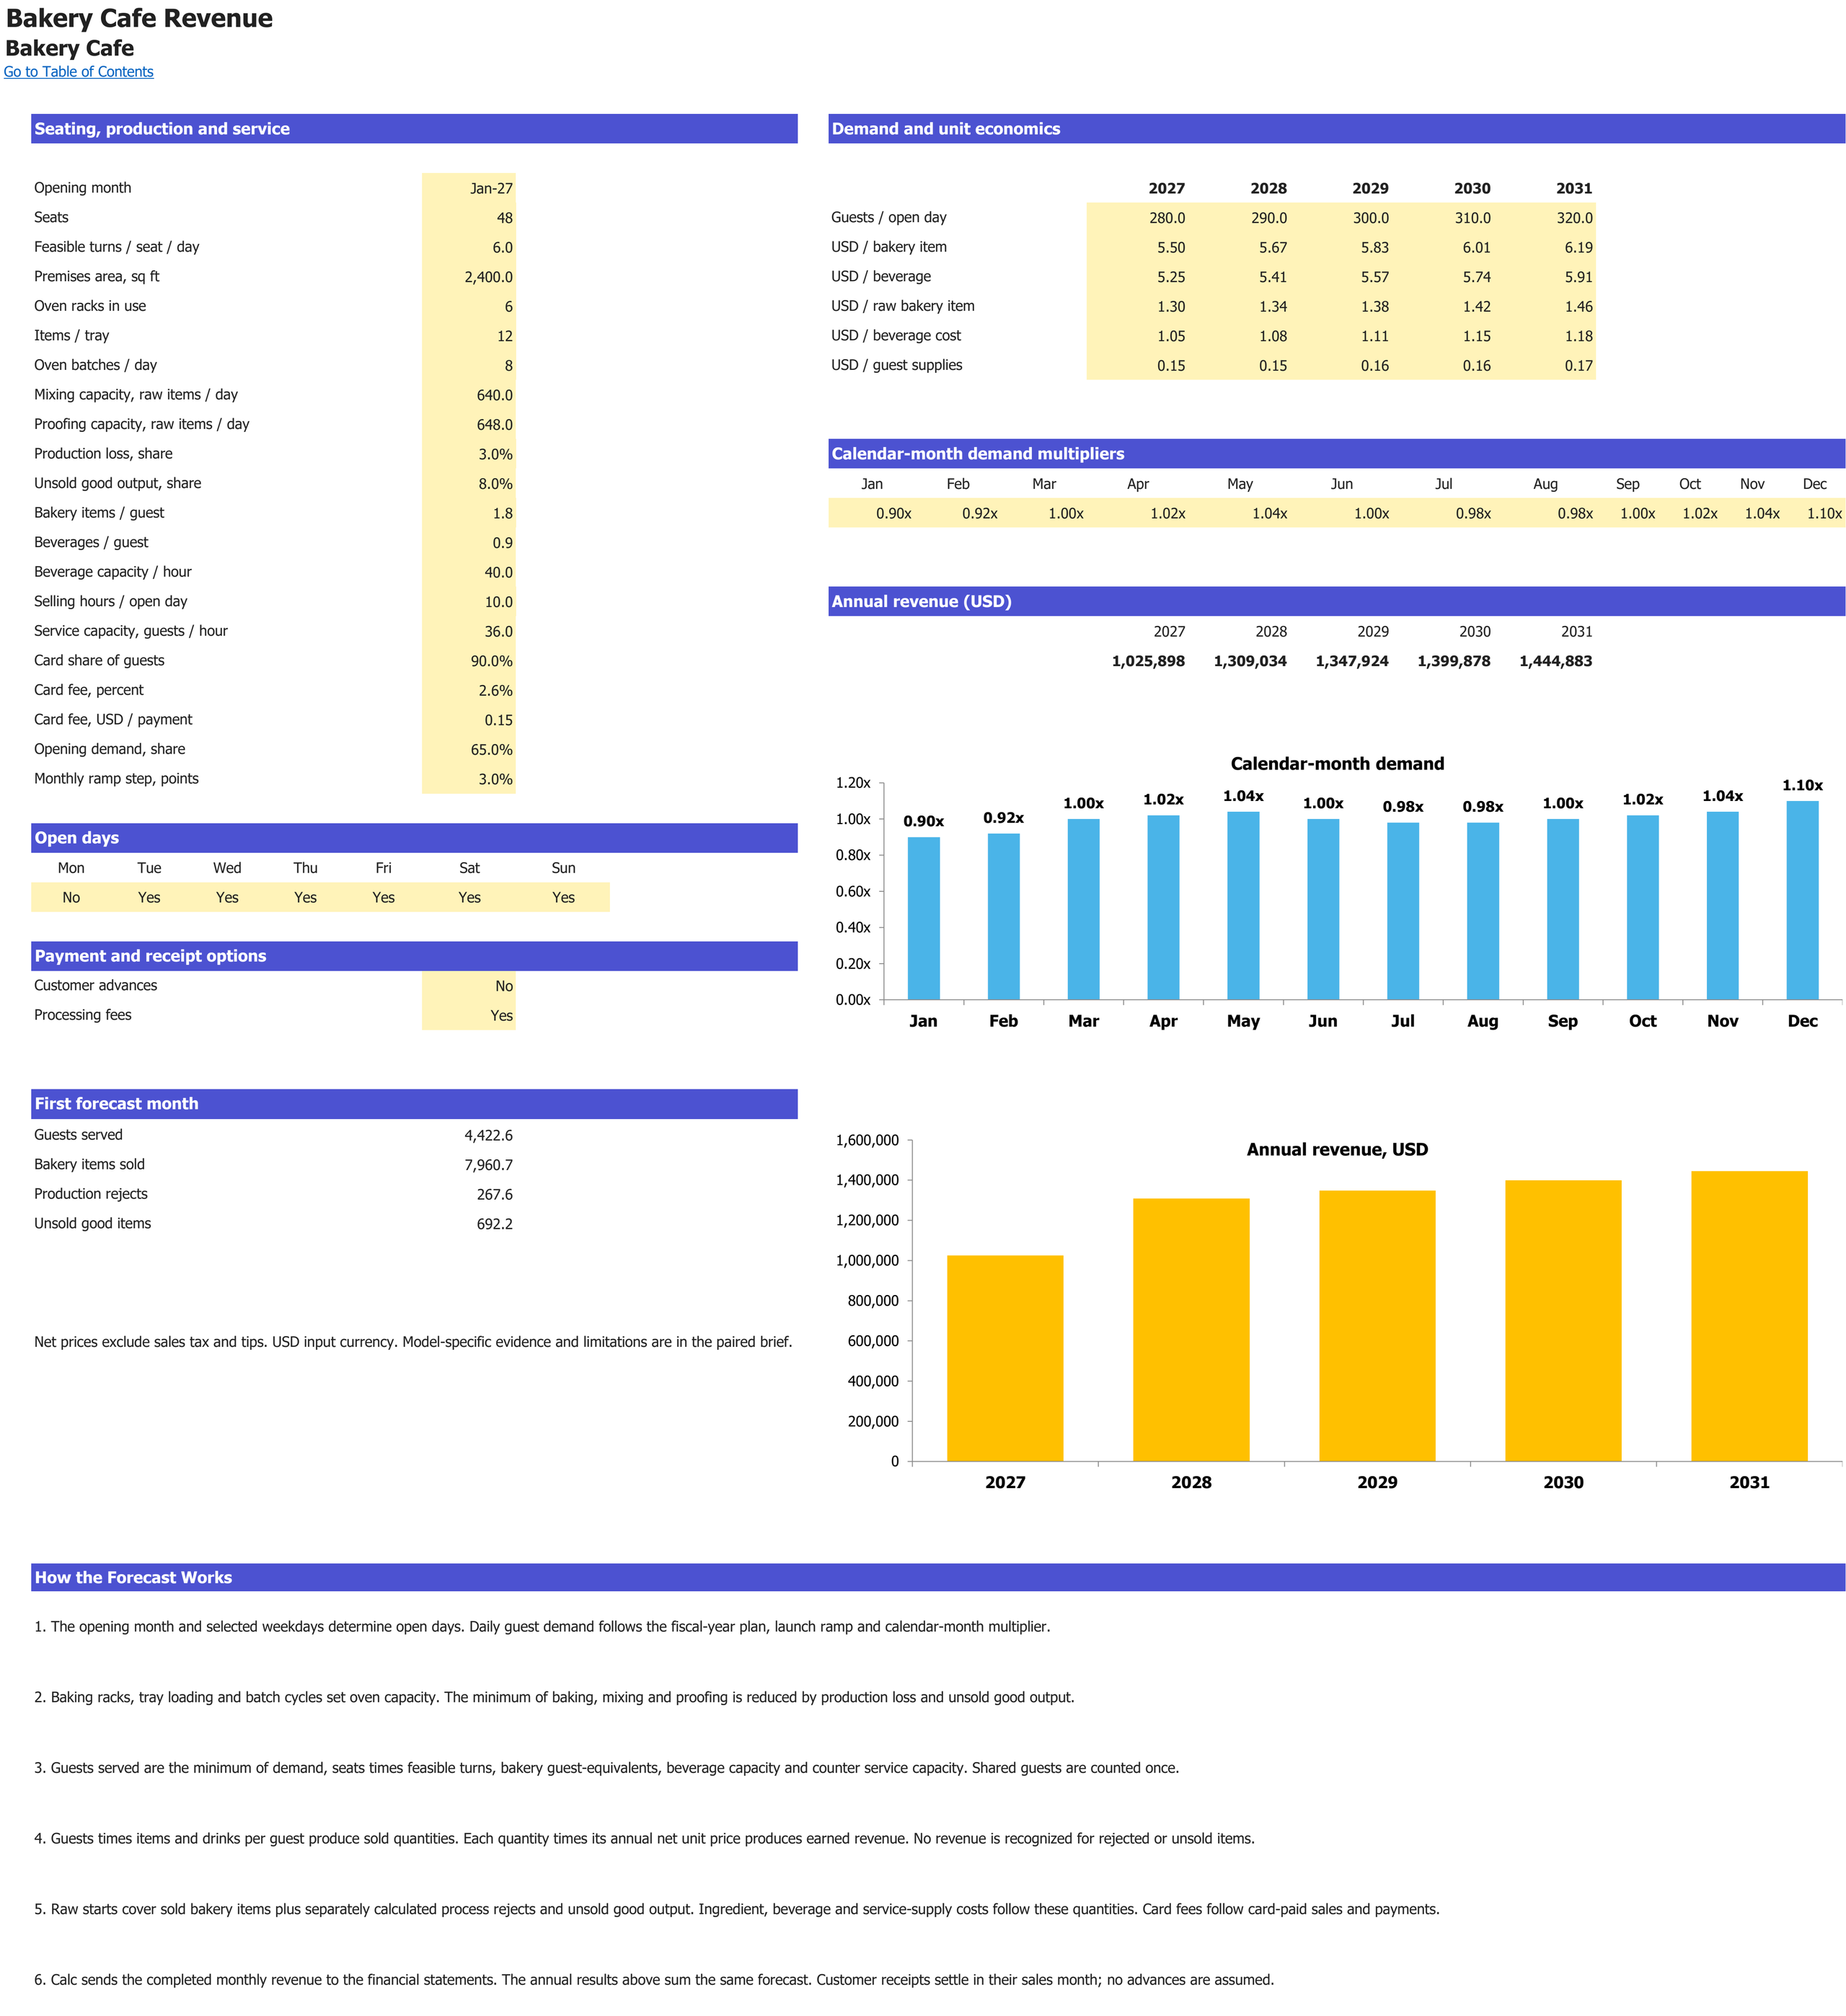
Cafe guest demand, seats, baking and beverage capacity, product yield and unsold output. Monetary inputs and sales use USD; operating volumes retain their labelled units. Forecast years are 2027–2031.
Enlarge image in a new tab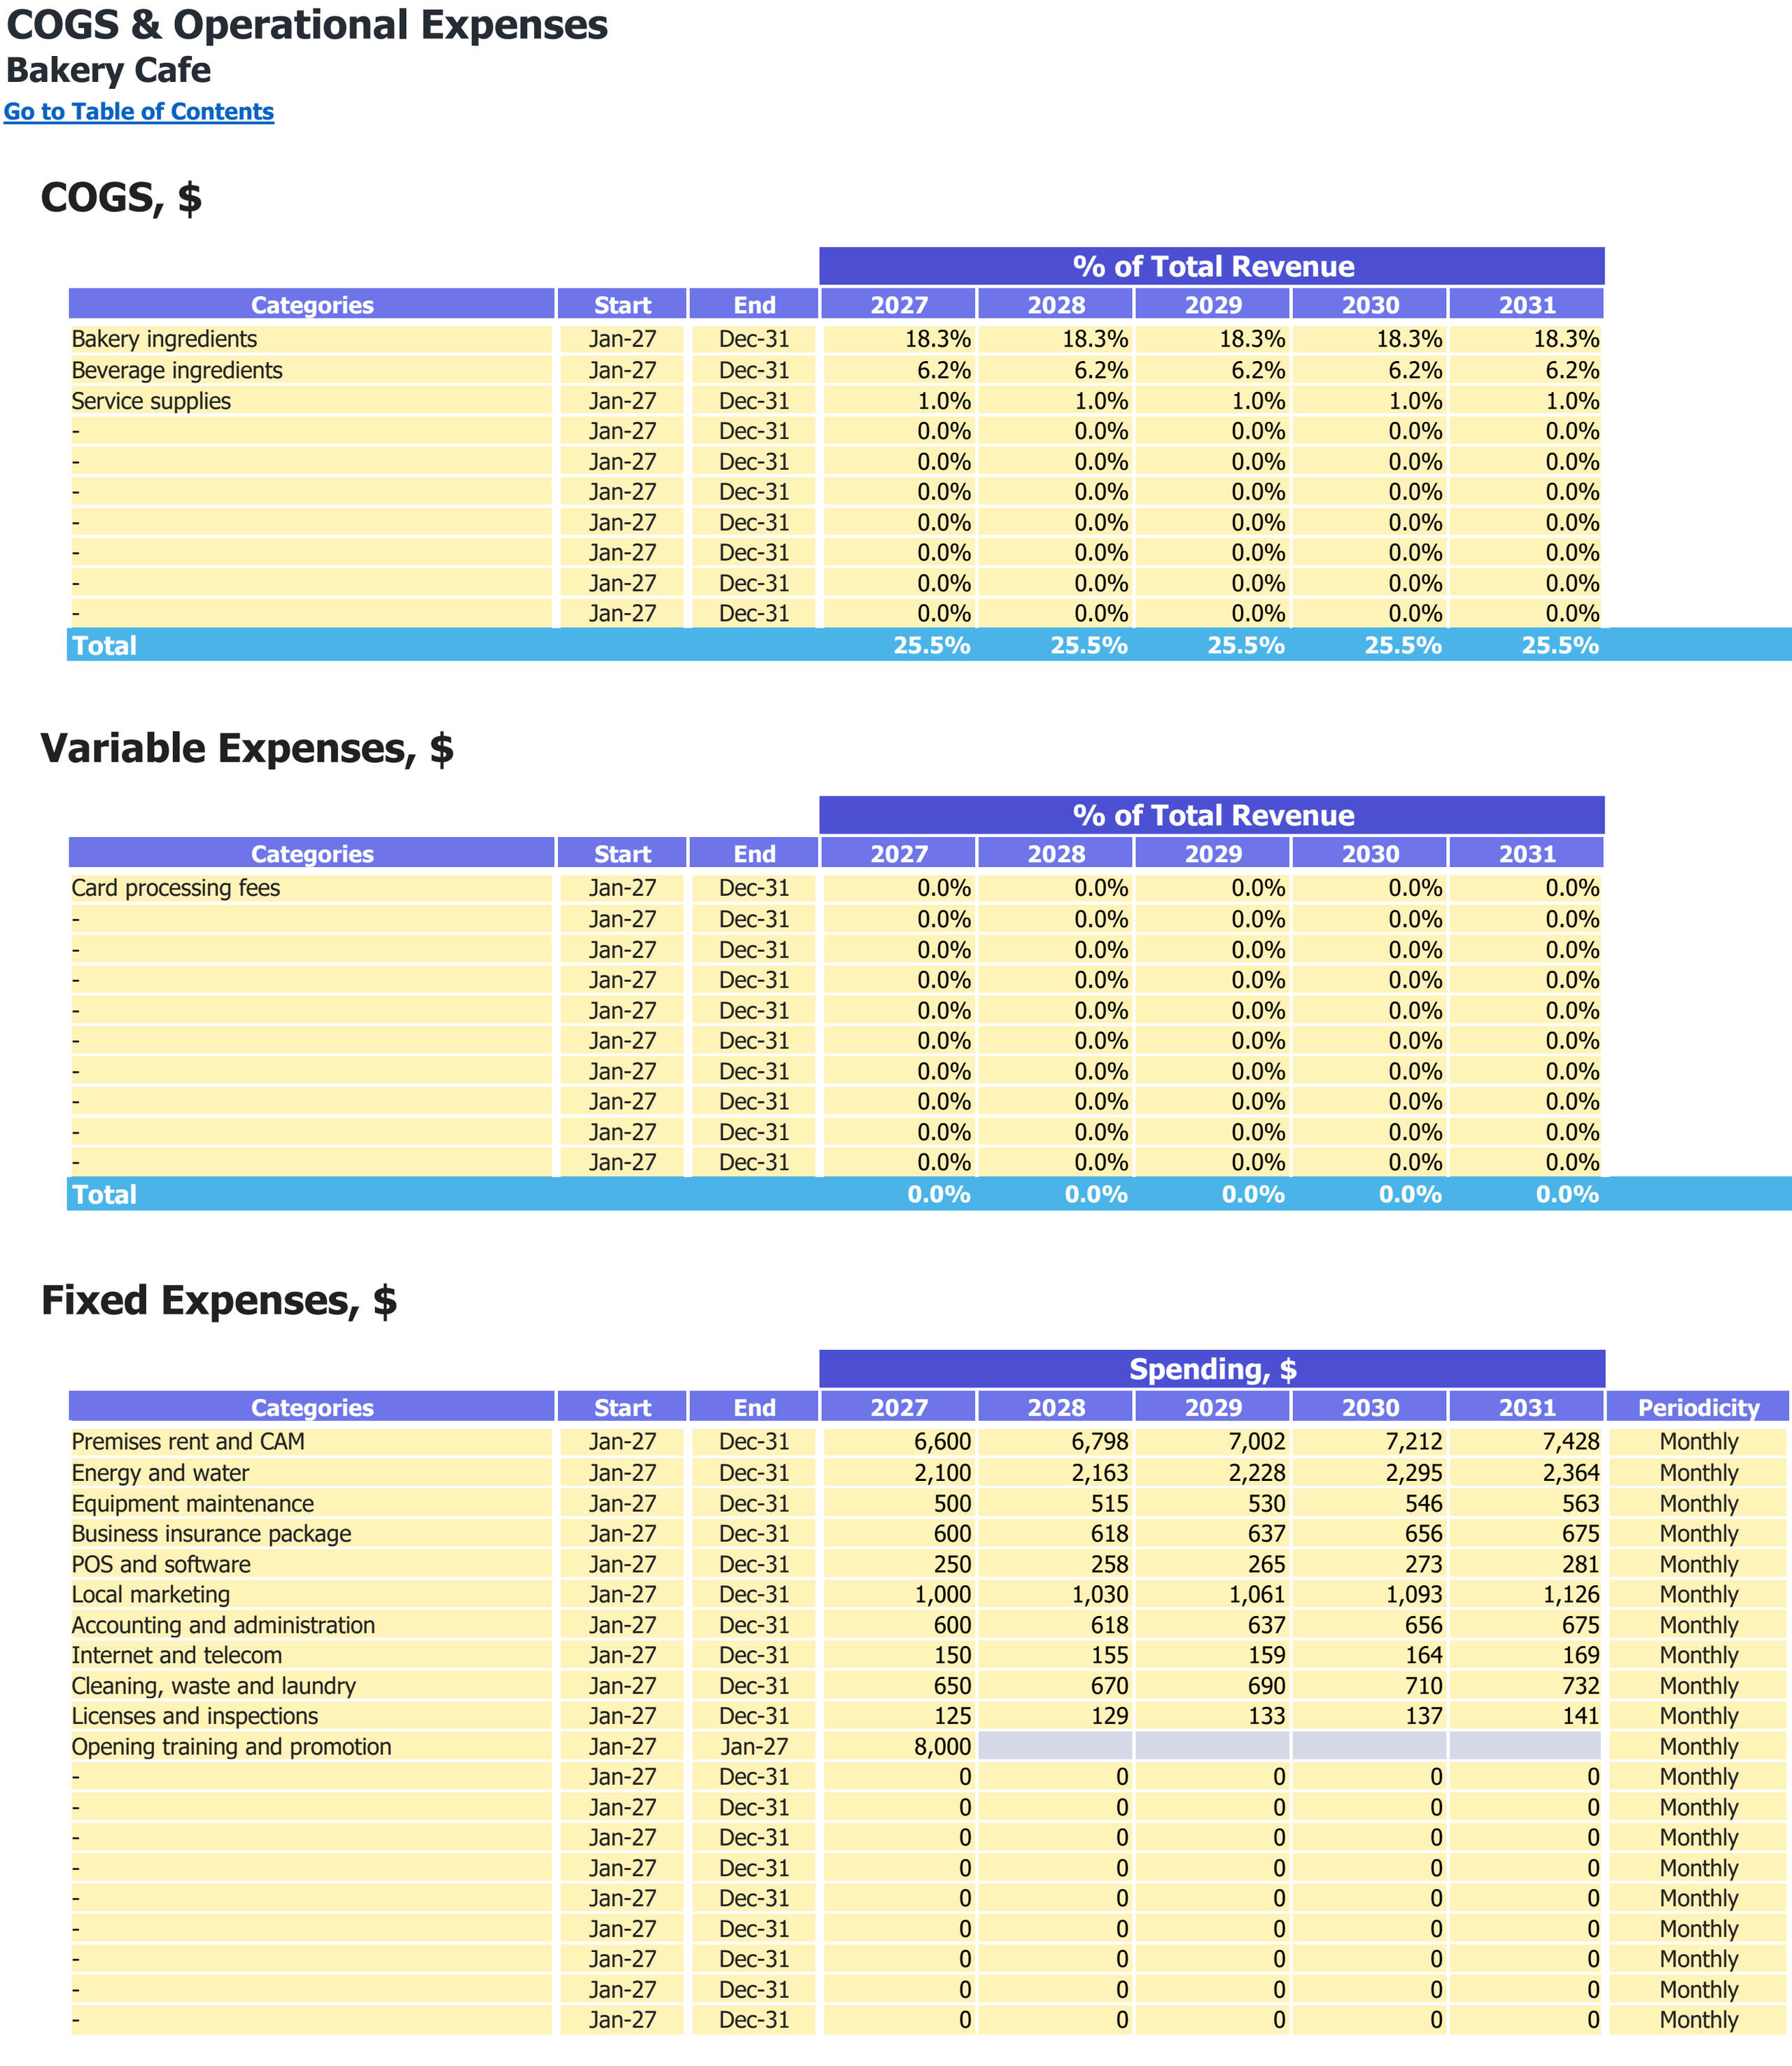
Food and other direct-cost categories, variable expense shares and fixed operating expenses. Monetary inputs are USD; the annual percentage columns are cost shares of revenue.
Enlarge image in a new tab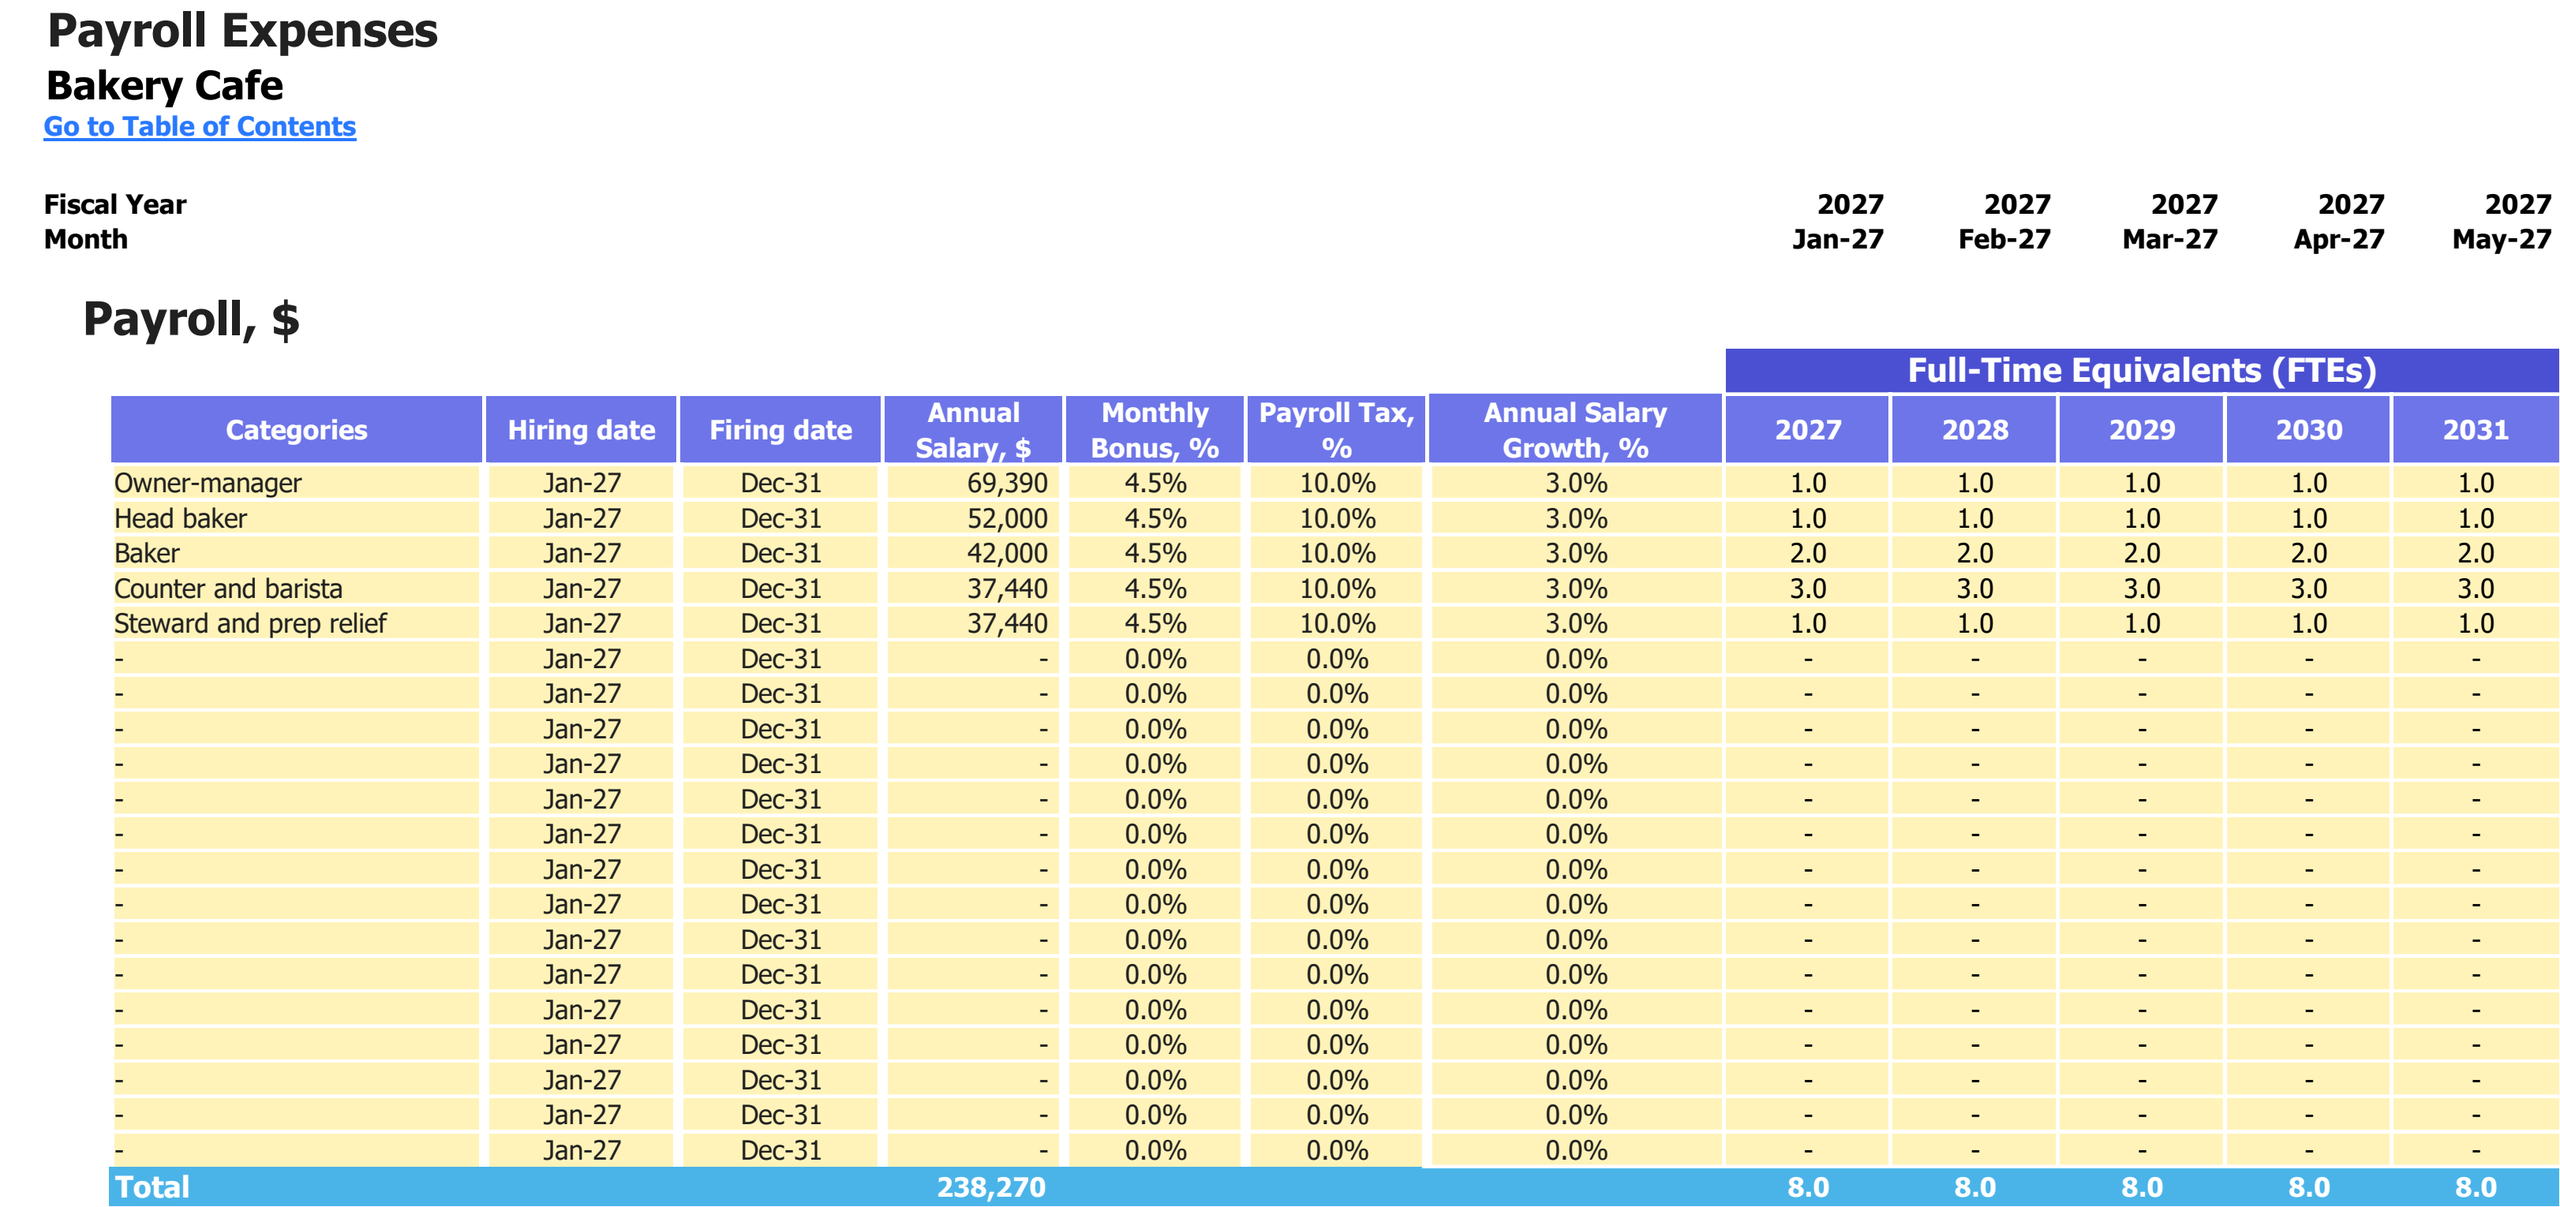
Paid roles, annual salary and employer-load assumptions, with staffing in full-time equivalents for 2027–2031. Salary amounts are USD; percentages and FTEs are labelled separately.
Enlarge image in a new tab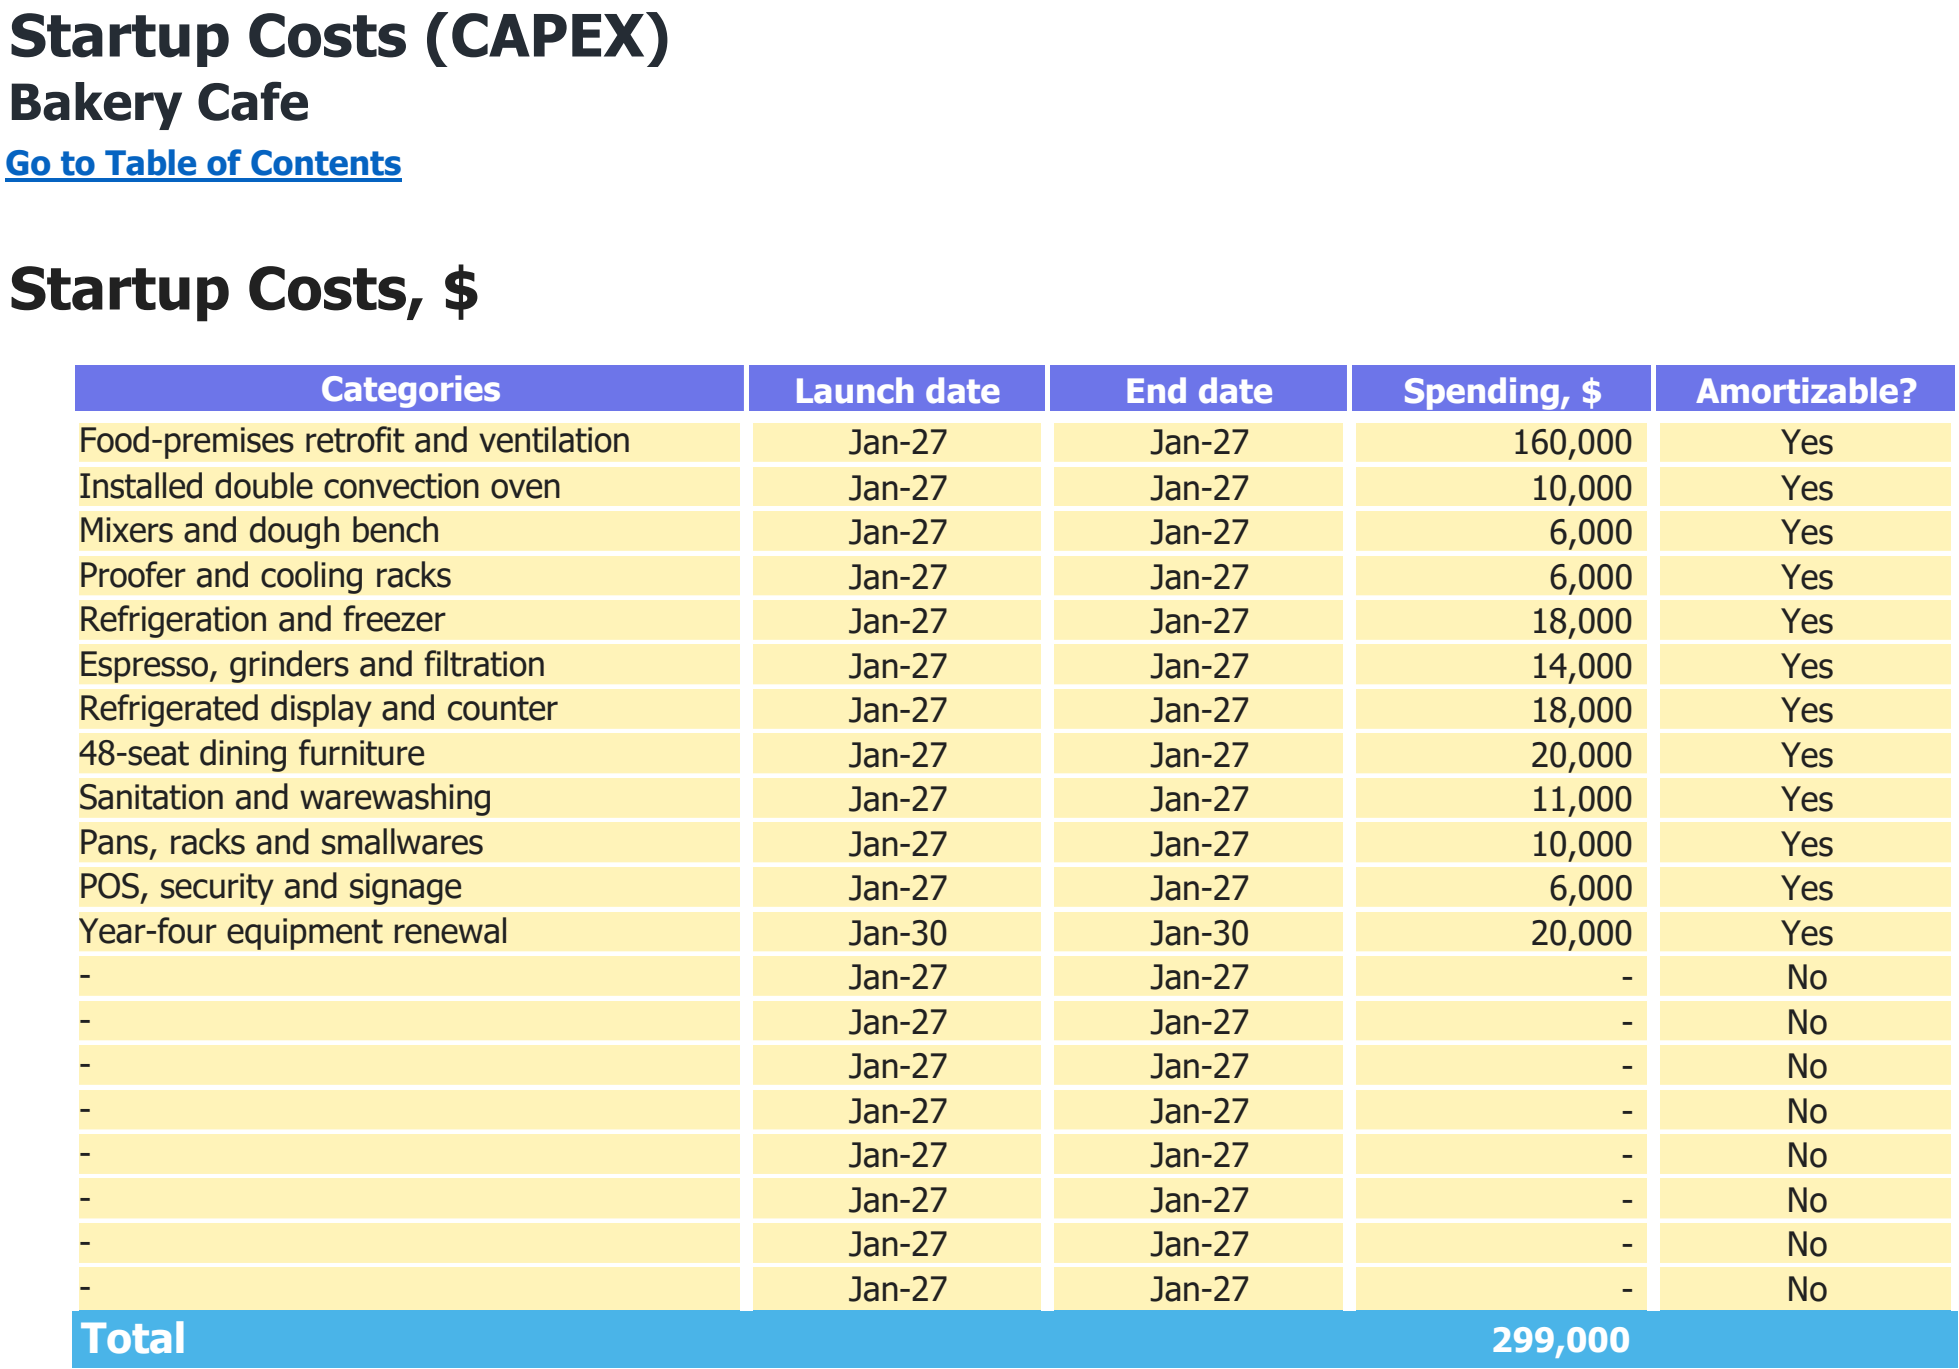
Asset categories, purchase dates and spending assumptions in USD. The total includes every scheduled purchase shown, including later replacements where present.
Enlarge image in a new tab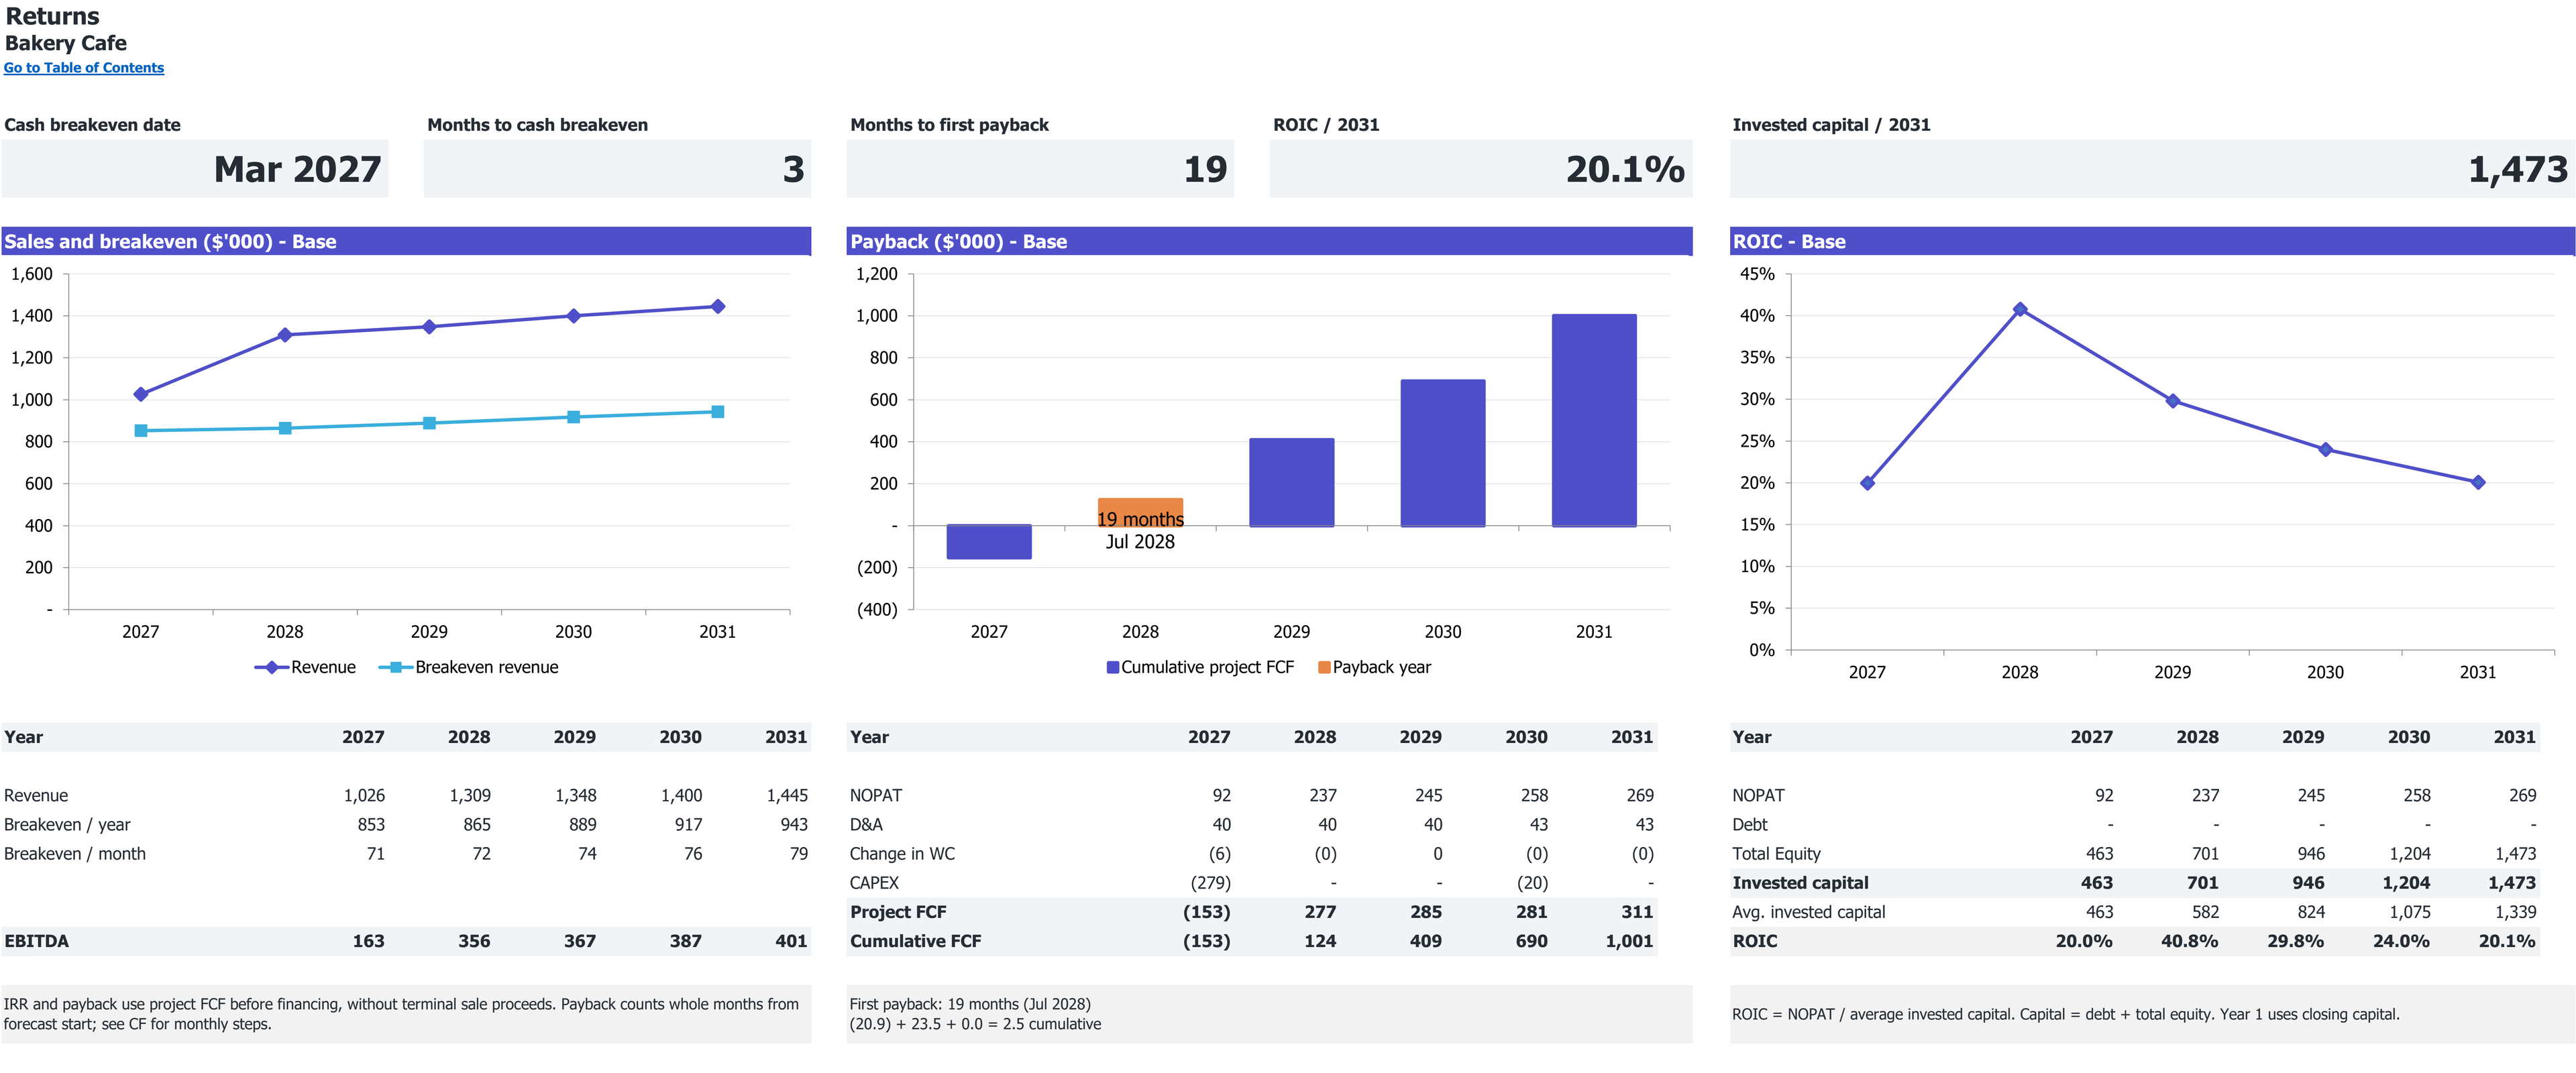
Excerpt from Returns: cumulative project free cash flow and first payback, if reached. 2027–2031 base case; dollar amounts in thousands.
Open full Returns view in a new tabExcerpt from Returns: revenue, annual and monthly break-even revenue, and EBITDA. 2027–2031 base case; dollar amounts in thousands.
Open full Returns view in a new tab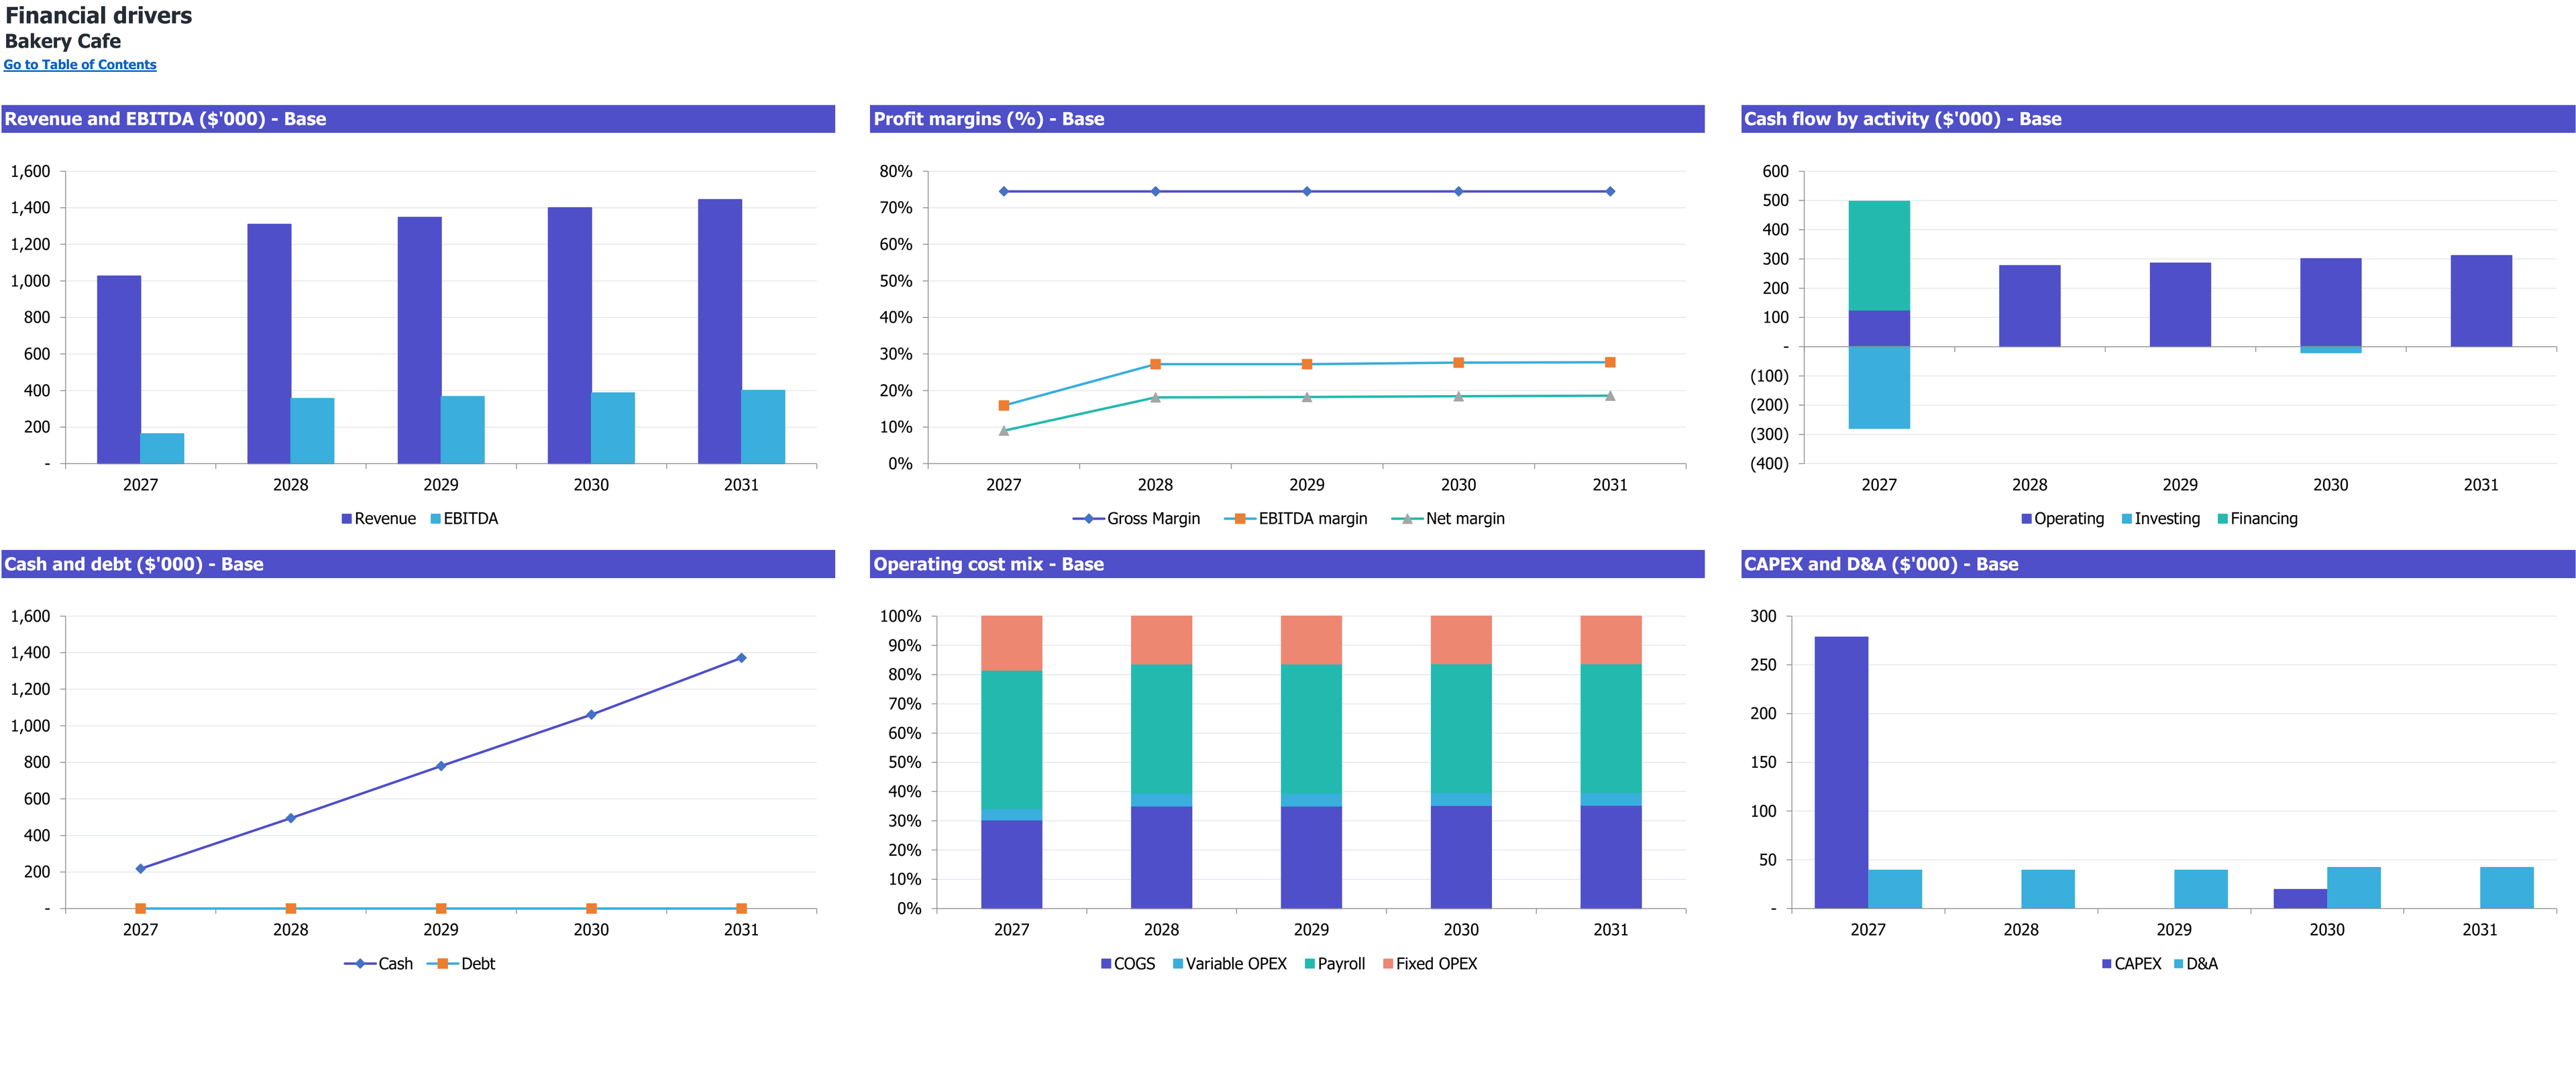
Six annual financial-driver charts for Bakery Cafe, 2027–2031 (Base scenario). Dollar amounts are in thousands; margins and cost mix are percentages.
Enlarge image in a new tab8 selected worksheet views. Figures show this workbook’s starting case.
Workbook availability
What is inside the Excel model
Connect seated cafe guests to the baking line, drinks and counter service. Separate production rejects from unsold good products and test how those losses affect ingredient cost and investment recovery.
Selected worksheets from the documented workbook. Forecast period: January 2027–December 2031. Model reference: PHY003-01.
Inputs you control. Results you can inspect.
On a small screen, scroll within the table to read every column.
| Planning area | Inputs you review | How they connect | Results to inspect |
|---|---|---|---|
| Guests | 280 initial potential guests/open day; 65% opening demand. | Apply calendar factors and a three-percentage-point monthly ramp. | Demand before common guest-capacity limits. |
| Production | 576 raw bakery items/day from the oven; separate mixing/proofing limits. | Apply the lowest production ceiling, 3% rejects and 8% unsold good output. | Saleable bakery units and guest ceiling. |
| Service | 48 seats × six turns; 36 counter guests/hour; 40 beverages/hour. | Compare all limits for the same guest basket. | Served seated guests and product sales. |
| Staff and costs | Eight initial FTE; $1.30 raw bakery ingredients/item. | Fund production/service expansion and cost all raw output once. | Loaded payroll, ingredient usage and operating margin. |
| Investment | $279,000 initial CAPEX; $20,000 renewal; $371,000 equity. | Include all project cash uses and a $75,000 reserve. | Monthly liquidity and project payback. |
Is this the right model for your business?
Check the starting case before changing the assumptions.
The starting operation
- A seated counter-order bakery cafe producing its bakery items.
- An operator testing oven, mixing and proofing against dining/service capacity.
- A founder evaluating ingredient losses and paid production staffing.
Check the boundary
The saved case excludes takeout, catering, wholesale, subscriptions, tips, customer advances and borrowing.
Compare the other bakery typesHow this business makes money
Connect the unit sold to the resources required by this operating case.
Revenue logic
Served guests buy expected bakery items and beverages at their separate net prices.
Production rejects and unsold good items incur ingredient costs without revenue or finished-stock carryover.
Can added seating increase bakery-cafe sales when the oven is already full?
Only if the production and service resources can supply the extra guest basket. Baking, mixing, proofing and two loss stages determine available bakery units, while beverages and counter work impose further limits on those same guests.
- Guest basket
- 1.8 bakery items and 0.85 drinks
- Raw baking
- 576 items/day before losses
- Loss stages
- 3% rejects then 8% unsold good output
What to establish for your own operation
- Validate bake, mixing and proofing cycles with actual products.
- Measure rejects separately from unsold good items.
- Fund staff and review retrofit scope alongside higher capacity.
Follow the plan from demand to cash
Open each section for the assumptions, calculations, and limits of this workbook’s starting case.
Find the bottleneck across production and serviceRevenue
The 48-seat cafe sells an expected 1.8 bakery items and 0.85 drinks per guest. The initial prices are $5.50 per bakery item and $5.25 per beverage. Served guests are capped by seating/turns, bakery output, beverages and counter service together.
The oven supports 576 raw items/day before losses; mixing and proofing have separate ceilings. After 3% production loss and 8% unsold good output, bakery capacity supports about 285.568 expected guests/day. Those are planning productivities requiring actual bake trials.
- The January opening control admits all eligible January dates.
- A sold beverage is a product unit, not another seated guest.
- Increasing premises area alone does not resize rent or fitout.
Keep rejects and unsold goods visible in costPayroll
Raw bakery ingredients start at $1.30 per item, with an explicit flour, fat, filling and other-ingredient budget. Production rejects and unsold good products both consume ingredients without generating sales. Neither creates finished-goods inventory.
Eight initial paid FTE include the owner-manager, head baker, two bakers, three counter/baristas and a steward/prep role. Increased production or service capacity funds additional relevant FTE, while lower demand retains baseline staffing.
- Owner-manager starting annual pay is $69,390.
- The selected combined employer load adds 15% to base wages.
- Total operating expenses already include payroll and card fees.
Budget the retrofit separately from equipmentCAPEX
Initial CAPEX totals $279,000, including a $160,000 food-premises retrofit and separate oven, mixing, proofing, refrigeration, coffee and service assets. January 2030 adds $20,000 equipment renewal. Installed packages require local quotes.
January equity is $371,000 with no debt. It covers initial assets, the peak operating/working-capital deficit and a $75,000 reserve. Minimum funded cash is $75,151 in February 2027. The full funding test includes the later renewal.
- All depreciable assets use one seven-year book life.
- Seven ingredient inventory days are modeled with zero AR/AP.
- The reserve test is monthly, not an intramonth cash guarantee.
Interpret the margin with the assumed ticket and staffingCF
Base 2027 revenue is $1,025,898 from 71,429 served guests, with EBITDA of $163,165. EBITDA, EBIT and operating cash turn positive in March 2027; later baseline EBITDA and operating cash remain positive.
Project payback occurs in July 2028, month 19, and stays nonnegative. Cumulative undiscounted project cash includes all capital and working-capital uses, before financing and without terminal proceeds. No owner distribution return is defined.
- The monetary Downside case gives −$15,861 minimum cash with original equity fixed.
- A July opening with January commitments unchanged gives −$197,007 minimum cash.
- Strong modeled margins depend on prices, recipes, throughput and the retained staffing plan.
Selected results from the starting case
Modeled results in USD unless stated otherwise. These describe the selected inputs, not an estimate for your location or a guaranteed outcome.
- 2027 revenue
- $1,025,898USD, Base; January–December, with all eligible January dates trading.
- 2027 EBITDA
- $163,165USD, Base; paid owner and all operating costs included.
- Initial CAPEX
- $279,000USD in January 2027; a separate $20,000 renewal follows in January 2030.
- Minimum cash
- $75,151USD, funded Base balance in February 2027.
- Project payback
- July 2028 / month 19Cumulative undiscounted project cash recovery, without terminal sale or owner payout.
Make the case your own
Work from the operating plan toward the cash requirement.
Set guest demand, basket and actual trading dates.
Validate each production and service limit and both loss stages.
Replace recipe, staffing, lease and installed-capital allowances.
Review delayed-opening cash, monetary downside and project recovery.
Interpretation and scope
- National references do not establish local demand, lease availability or bake productivity.
- Selected high margins are scenario outputs, not bakery-industry expectations.
- Premises area does not automatically change rent or retrofit budgets.
- Same-month settlement and seven-day ingredient stock simplify cash timing.
- The 25% tax allowance has no chosen jurisdiction or cross-year loss carryforward.
The workbook is an Excel file for local planning. Learn how to interpret assumptions and evidence.
Other bakery types
Each operating type calls for its own financial structure.
Questions
Is takeout included?
No. This case models seated counter-order sales only.
Do unsold good products earn sales?
No. They retain ingredient cost without revenue or finished-stock carryover.
Does a January 31 opening label mean one trading day?
No. It is a month-end control; all eligible January days trade.
Does extra production capacity require extra pay?
Yes. The modeled capacity expansion funds additional relevant baker or service FTE.
Does July 2028 payback describe owner distributions?
No. It measures project cash recovery; owner payouts and terminal proceeds are absent.
Can I buy this model now?
No. Purchasing and workbook downloads are not available on this site.
Which software does the workbook use?
The documented file is an Excel workbook (.xlsx). Compatibility with other spreadsheet applications is not established by the file extension.
Read the planning guides
Explore the relevant operating questions and how to interpret a workbook’s assumptions.
How do baking losses and seating limits shape a bakery cafe forecast?
Convert gross bakery output into saleable items, compare each resource in guests per day, and account for ingredients used by rejected and unsold products.
Read the guide
Should your bakery sell cafe visits, branded orders, or private-label production?
Choose a bakery format by its buyer, production promise, route to market, inventory responsibility, and the work you want to manage.
Read the guideHow to open a bakery cafe with a production plan that reaches the counter
Connect the bakery menu, mixing and proofing schedule, premises, paid shifts, sell-through tests, and opening cash before launching a seated bakery cafe.
Read the guideEvidence and scope
Operationally specified by the analyst. An active local operator, commercial demand and legal permission require separate validation.
The links below provide operating-format context; they do not verify the workbook’s selected inputs or calculated returns.
The workbook guide and figures describe model PHY003-01, revision r01, for January 2027–December 2031. These are a documented planning case, not observed results for a particular business.