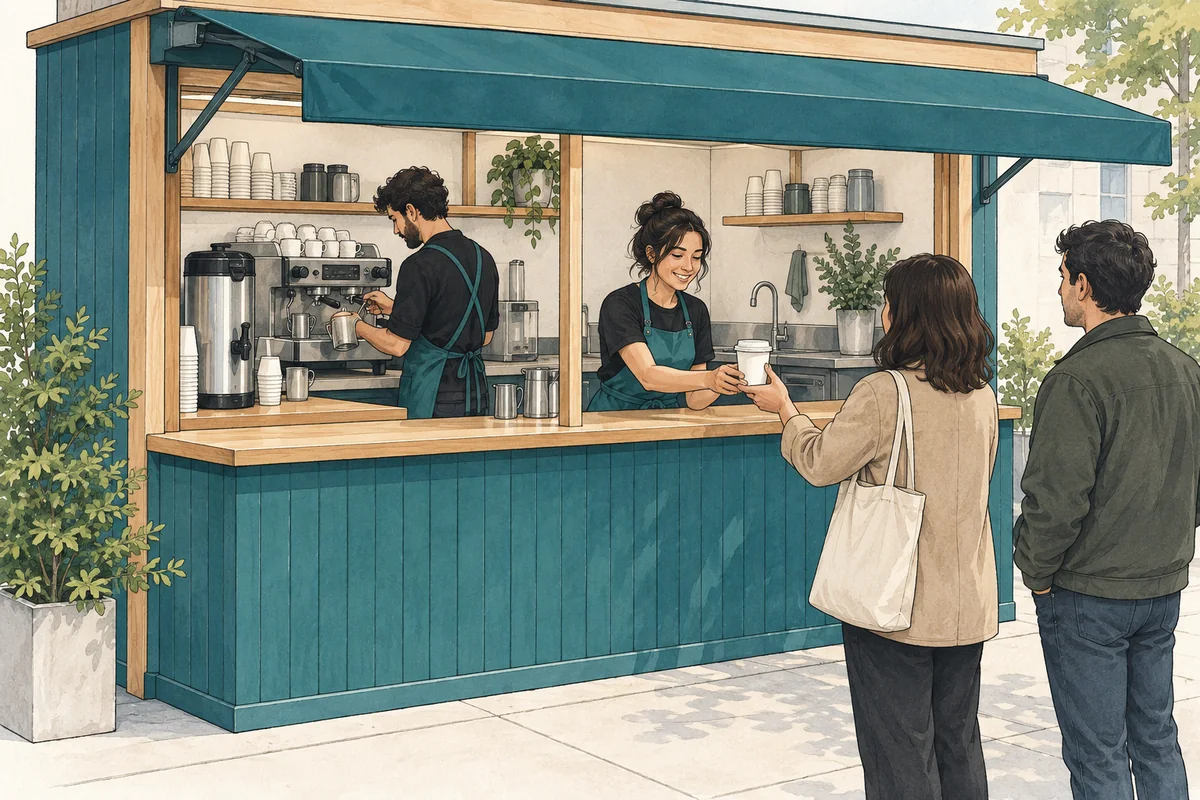
The takeaway coffee kiosk case describes a 250-square-foot U.S. kiosk selling one drink per order through walk-in and preorder channels. It has no seats or food program. The Base forecast covers January 2027–December 2031 in USD, with trading from February 2027. All operating values below are selected case assumptions, not measured national service standards.
Which paid hours are available for service?
Three paid full-time equivalents provide 3 × 2,080 ÷ 12 = 520 hours per month before deductions. Staffing includes one working owner, 0.8 preparation barista, 0.8 counter associate, and 0.4 relief barista. The owner receives pay, but the owner’s administration time cannot also prepare or hand over drinks.
The example below uses an illustrative month with 26 open days and the 2027 inputs. It isolates the staffing calculation; it is not a reported forecast month. The case applies 90% attendance, deducts 17.33 monthly owner-administration hours and one combined staff hour of setup/closing per open day, then splits the balance equally between the two service roles.
On a narrow screen, scroll within the table to read the complete calculation.
| Step | Calculation | Hours available |
|---|---|---|
| Funded paid hours | 3 FTE × 2,080 annual hours ÷ 12 | 520.00 combined hours/month |
| Attendance adjustment | 520 × 90% | 468.00 combined hours/month |
| Owner administration | 468 − 17.33 | 450.67 combined hours/month |
| Setup and closing | 450.67 − 26 × 1 | 424.67 combined hours/month |
| Equal role allocation | 424.67 ÷ 2 | 212.335 hours/role/month |
| Opening-hours ceiling | Smaller of 212.335 and 26 × 8 | 208.00 hours/role/month |
| Productive service time | 208 × 80% | 166.40 productive hours/role/month |
Opening hours and paid hours serve different purposes in this calculation. The opening ceiling prevents the pooled staffing budget from creating more than eight service hours per day for either modeled role. The productivity allowance then reduces that time again. A different calendar month changes setup deductions and available opening hours even when the monthly payroll budget is unchanged.
How does the drink mix change preparation time?
The selected menu mix requires 1.525 preparation minutes per drink: 30% × 0.5 minute for drip coffee, plus 20% × 1.25 minutes for black espresso drinks, plus 50% × 2.25 minutes for milk espresso drinks. One order contains one drink, so the same weighted workload applies per order.
This produces a preparation rate of 60 ÷ 1.525 = 39.34 drinks per productive preparation hour. Handover takes 1.2 minutes per order, equivalent to 50 orders per productive handover hour. These are rates inside the funded-time calculation, not observed output per open hour or promises about customer waiting time.
A menu change should carry its work requirement into the forecast. Increasing a slower drink’s share can consume more preparation time even if the order count stays constant. The case’s weights, recipe quantities, prices, and preparation times describe the same drinks; changing only the average selling price would leave that physical workload unchanged.
Why do preparation and handover share the funded team?
The two roles must both handle every fulfilled order. Using the 166.40 productive hours from the illustration gives a preparation ceiling of 166.40 × 60 ÷ 1.525 = 6,546.89 expected orders per month, compared with 8,320 for handover. Preparation is the lower resource ceiling in this illustration; the two capacities cannot be added together.
Demand is a separate limit. The case starts with 178.5 walk-in plus 31.5 preorder requests per mature day, or 210 in total. Across 26 days, that is 5,460 requests before launch-ramp and seasonality adjustments. Those requests fall below the illustrated resource ceiling, so extra funded capacity alone would not create additional customers. The workbook compares adjusted demand with both role limits each month.
Preorders allocate part of the same fulfilled order count and still require preparation and pickup. They do not create a second team or a separate capacity pool in this version. Channel payment fees differ, but changing the payment channel does not automatically shorten the physical work assumed for an order.
What does the monthly model leave for a peak-time study?
The monthly calculation cannot establish how many people arrive in a particular fifteen-minute interval, the order in which drinks are made, or how long customers wait. A kiosk can have adequate monthly hours while arrivals cluster within a short window. The case contains no explicit peak-window queue simulation, so its monthly capacity should retain that label.
Before using the staffing case for a specific kiosk, collect three linked observations: arrivals by short time interval and channel; actual preparation and handover work for the planned drink mix; and paid coverage after breaks, absence, administration, setup, and closing. Together they show whether a shift-level study needs different staffing or service assumptions.
The assumptions review guide explains how to document those changes. In the kiosk model, review fulfilled orders alongside the paid labor budget and monthly cash. The labor budget remains a cost even when demand uses fewer of the available service hours.