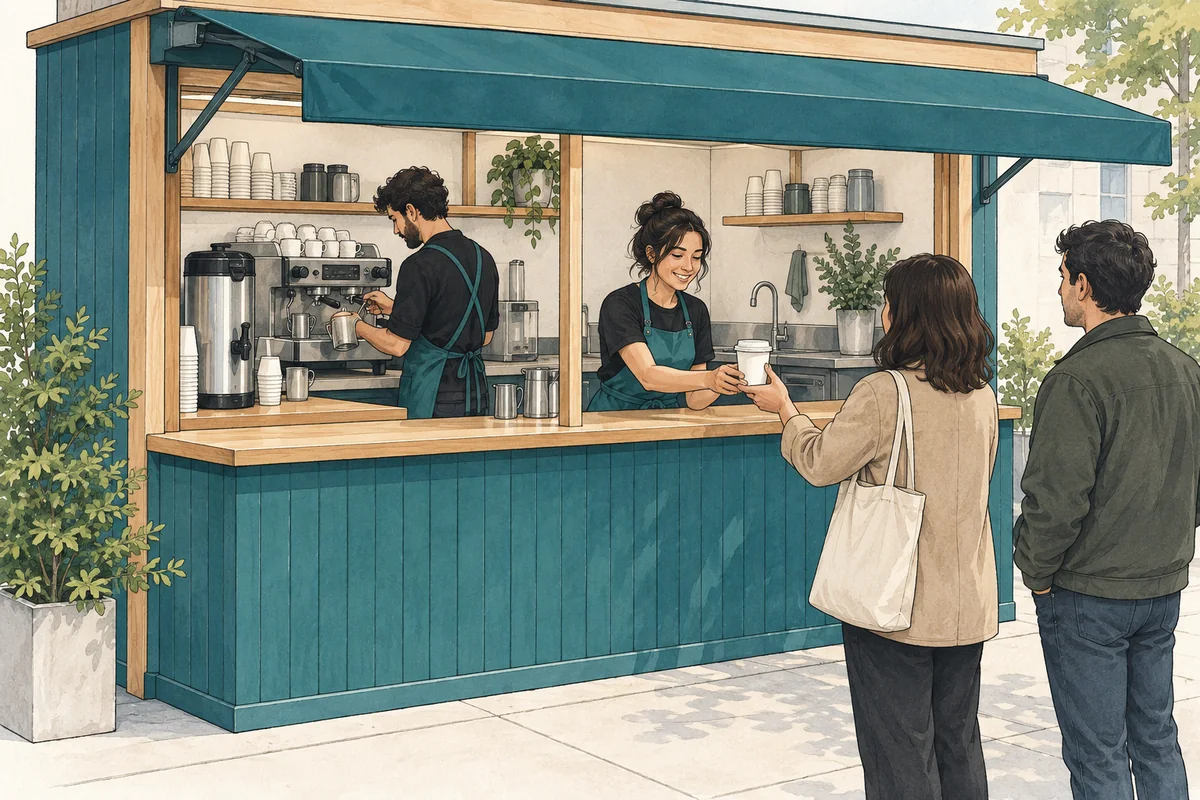
The mobile coffee truck case uses one equipped van and a two-stop route, with one drink per fulfilled order. Its U.S. Base forecast covers January 2027–December 2031 in USD, with sales starting in March 2027. It excludes food, subscriptions, delivery, and separately contracted event fees. The following times, demand, and costs are selected planning assumptions.
Which route hours earn drink revenue?
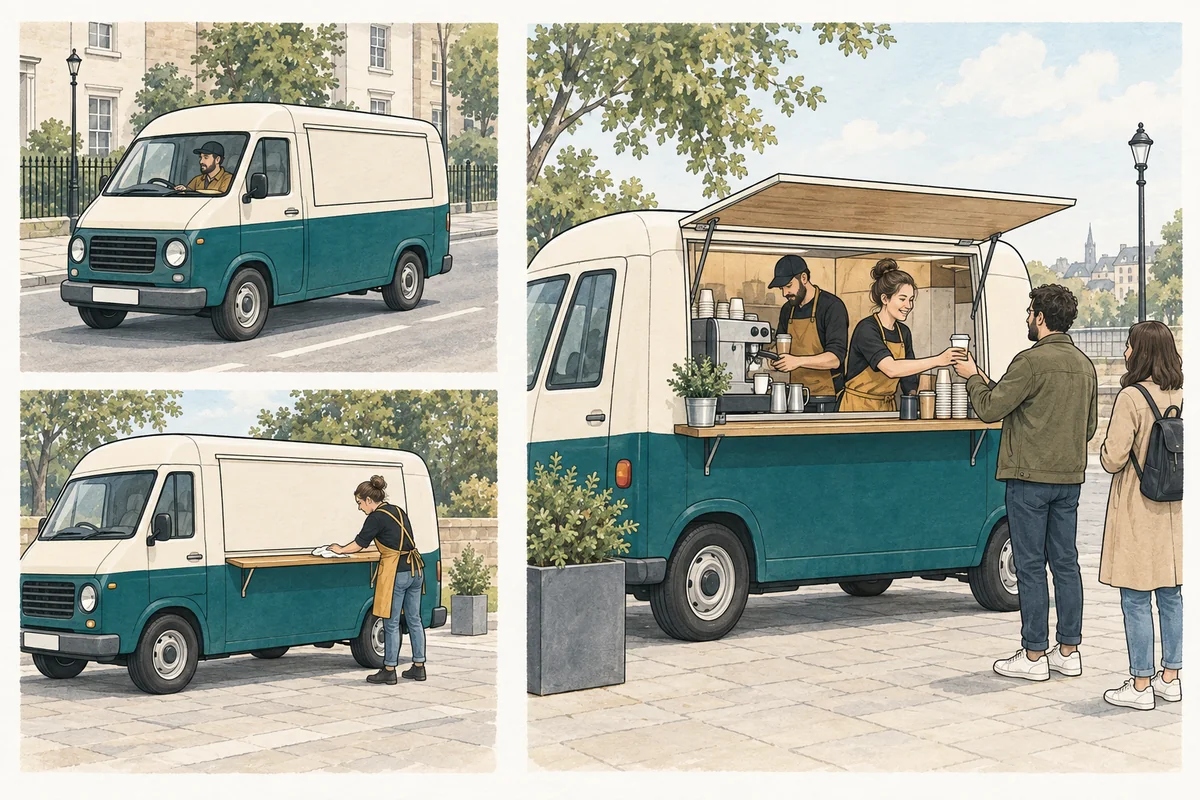
The planned route contains six selling hours within eight owner route hours: 3.5 at the morning stop, 2.5 at the afternoon stop, one for travel, and one for setup and cleanup. Selling therefore occupies 75% of the route before monthly administration. The remaining time still needs paid coverage.
On a narrow screen, scroll within the table to compare the route activities.
| Activity | Time basis | Treatment in the operating case |
|---|---|---|
| Morning selling window | 3.5 hours/route | Own demand and service-capacity limit |
| Afternoon selling window | 2.5 hours/route | Own demand and service-capacity limit |
| Travel | 1 hour/route | Paid owner time; no drink orders |
| Setup and cleanup | 1 hour/route | Paid owner time; no drink orders |
| Administration | 14 owner hours/month | Added outside the eight-hour route |
At 22 planned routes per month, the owner budget is 22 × 8 + 14 = 190 hours per month. The assistant covers 22 × 6 = 132 selling hours, and a separate 20-hour monthly relief allowance is funded. This is a committed staffing budget; a quiet stop does not automatically cancel the wages scheduled for that day.
The route order and travel allowance need to work for the actual locations. The model uses 22 planned routes each month rather than deriving route counts from calendar weekdays. That choice makes the time budget easy to inspect, but it does not establish access to a stop, customer demand, or a practical journey between the two locations.
How does drink mix limit shared throughput?
Preparation is the binding hourly resource in the selected case. The mix is 25% espresso or Americano, 55% milk latte, and 20% flavored latte, requiring 1.0, 1.5, and 1.75 minutes respectively. Weighted preparation time is 25% × 1.0 + 55% × 1.5 + 20% × 1.75 = 1.425 minutes per drink.
Compare the machine’s selected 75 drinks per hour with preparation at 60 ÷ 1.425 = 42.11 and handover at 60 ÷ 0.5 = 120. Applying 85% productive availability to the lowest rate gives 35.79 drinks per selling hour. The rate is a case-derived ceiling, not a national coffee-truck benchmark.
The same van and crew serve both stops sequentially. Six selling hours use the same constrained production system; adding the machine, preparation, and handover rates would count three required steps as three separate sources of sales. A faster machine does not increase the selected rate while preparation remains slower.
Why must each stop pass its own demand test?
Each stop has its own selling window and customers. At the 2027 mature daily demand inputs, with a neutral 1.00 demand-seasonality factor and no launch discount, the morning request count is 110 and the afternoon count is 80. The table applies the same unrounded hourly capacity to each window before taking the smaller of demand and capacity.
On a narrow screen, scroll within the table to see demand and capacity together.
| Stop | Requests | Service ceiling | Fulfilled orders |
|---|---|---|---|
| Morning | 110 | 3.5 × 35.78947… = 125.26 | 110 |
| Afternoon | 80 | 2.5 × 35.78947… = 89.47 | 80 |
| Route total after both tests | 190 | 214.74 combined capacity | 190 |
The route total is the sum of the two stop results, not one test against combined demand. Spare morning capacity cannot repair an afternoon shortage without changing the route or moving customer demand. For example, an illustrative afternoon request count of 100 would still be capped at 89.47 with its existing window, even though the morning stop has unused capacity. That is isolated arithmetic, not a rerun of the financial forecast.
Which costs continue when a route is quiet or closed?
The selected route incurs two $35 pitch fees and 40 miles of travel. At 22 planned routes, pitch fees total 2 × $35 × 22 = $1,540 per month. These are route costs, not a fee for each drink. Selling fewer drinks on a completed route spreads the same pitch budget across fewer orders.
The owner is paid for the route and administration, while the assistant and relief budgets cover their assigned work. The source model’s closure control stops sales; it leaves committed payroll and recurring costs in place unless their budgets change. Moving the opening date also requires reviewing the separately entered payroll and overhead start dates.
Use the mobile coffee truck model to connect a feasible route with drink recipes, revenue, paid time, and monthly cash. Record actual stop availability, selling windows, demand observations, travel time, and the terms for canceled routes before replacing the case inputs. A full route calendar has value only if each stop can earn enough contribution to support the work around it.