
Coffee Shop Financial Model: Mobile Coffee Truck
Plan a two-stop coffee truck route with sellable hours, preparation constraints, drink recipes, paid travel time and startup cash.
- Excel (.xlsx)
- Route: 22 planned routes/month / two pitches
- Selling time: 3.5 morning hours + 2.5 afternoon hours
- Opening: March 2027 after two preparation months
Planning several types? Compare 8 coffee shop formats
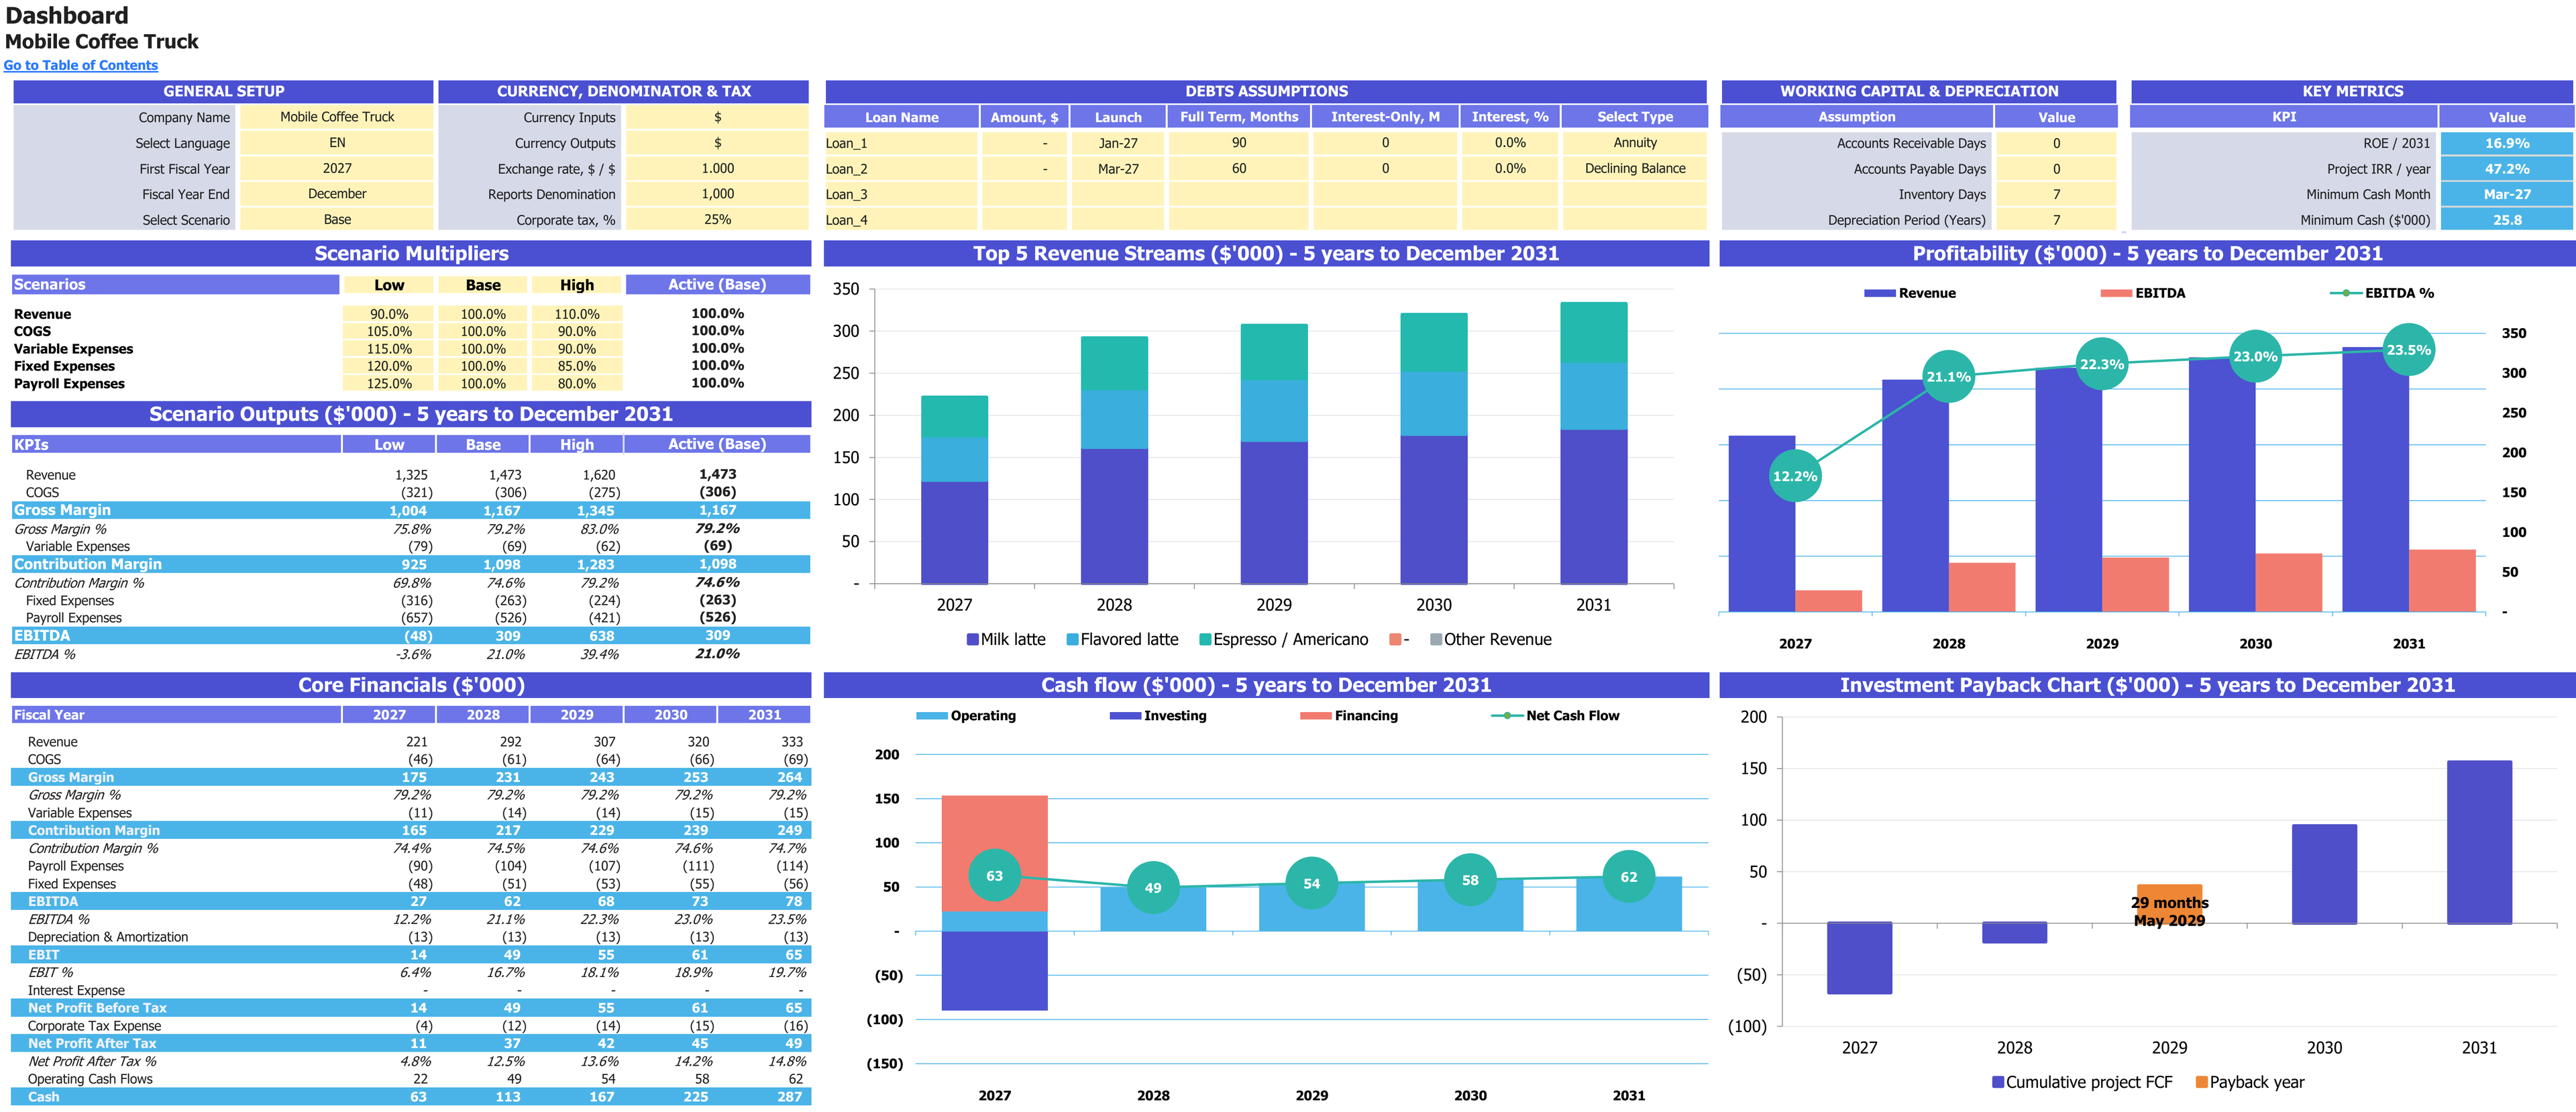
Base-case scenario controls, annual financial results and charts for 2027–2031. Financial report amounts are shown in thousands of USD; percentage measures retain their own units.
Enlarge image in a new tab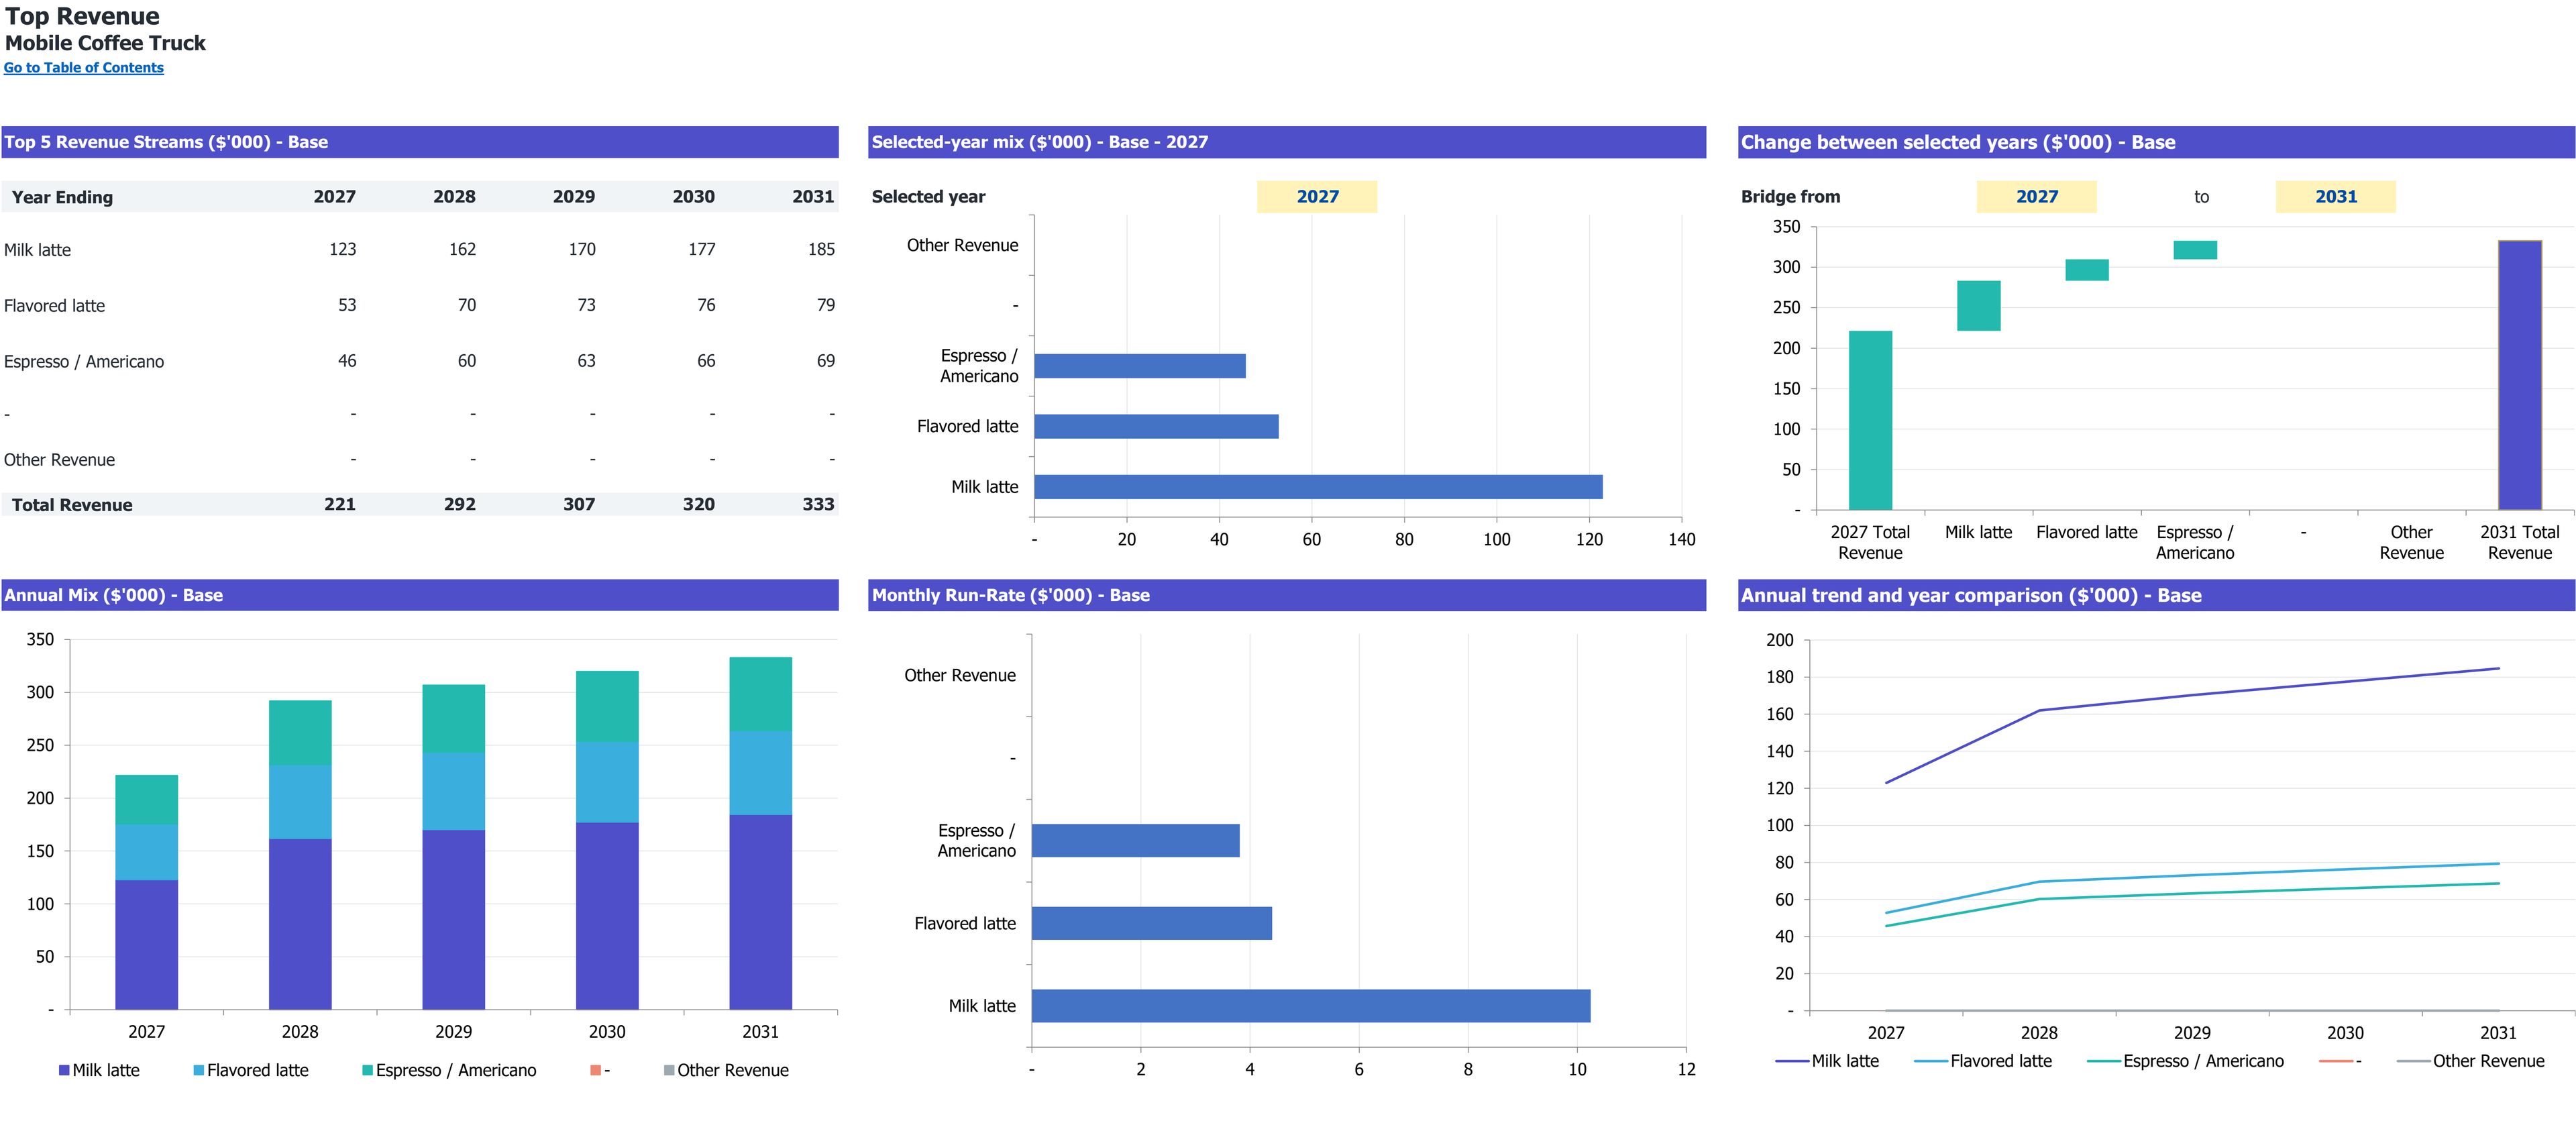
Revenue summary for 2027–2031 and selected-year comparison, in thousands of USD.
Enlarge image in a new tab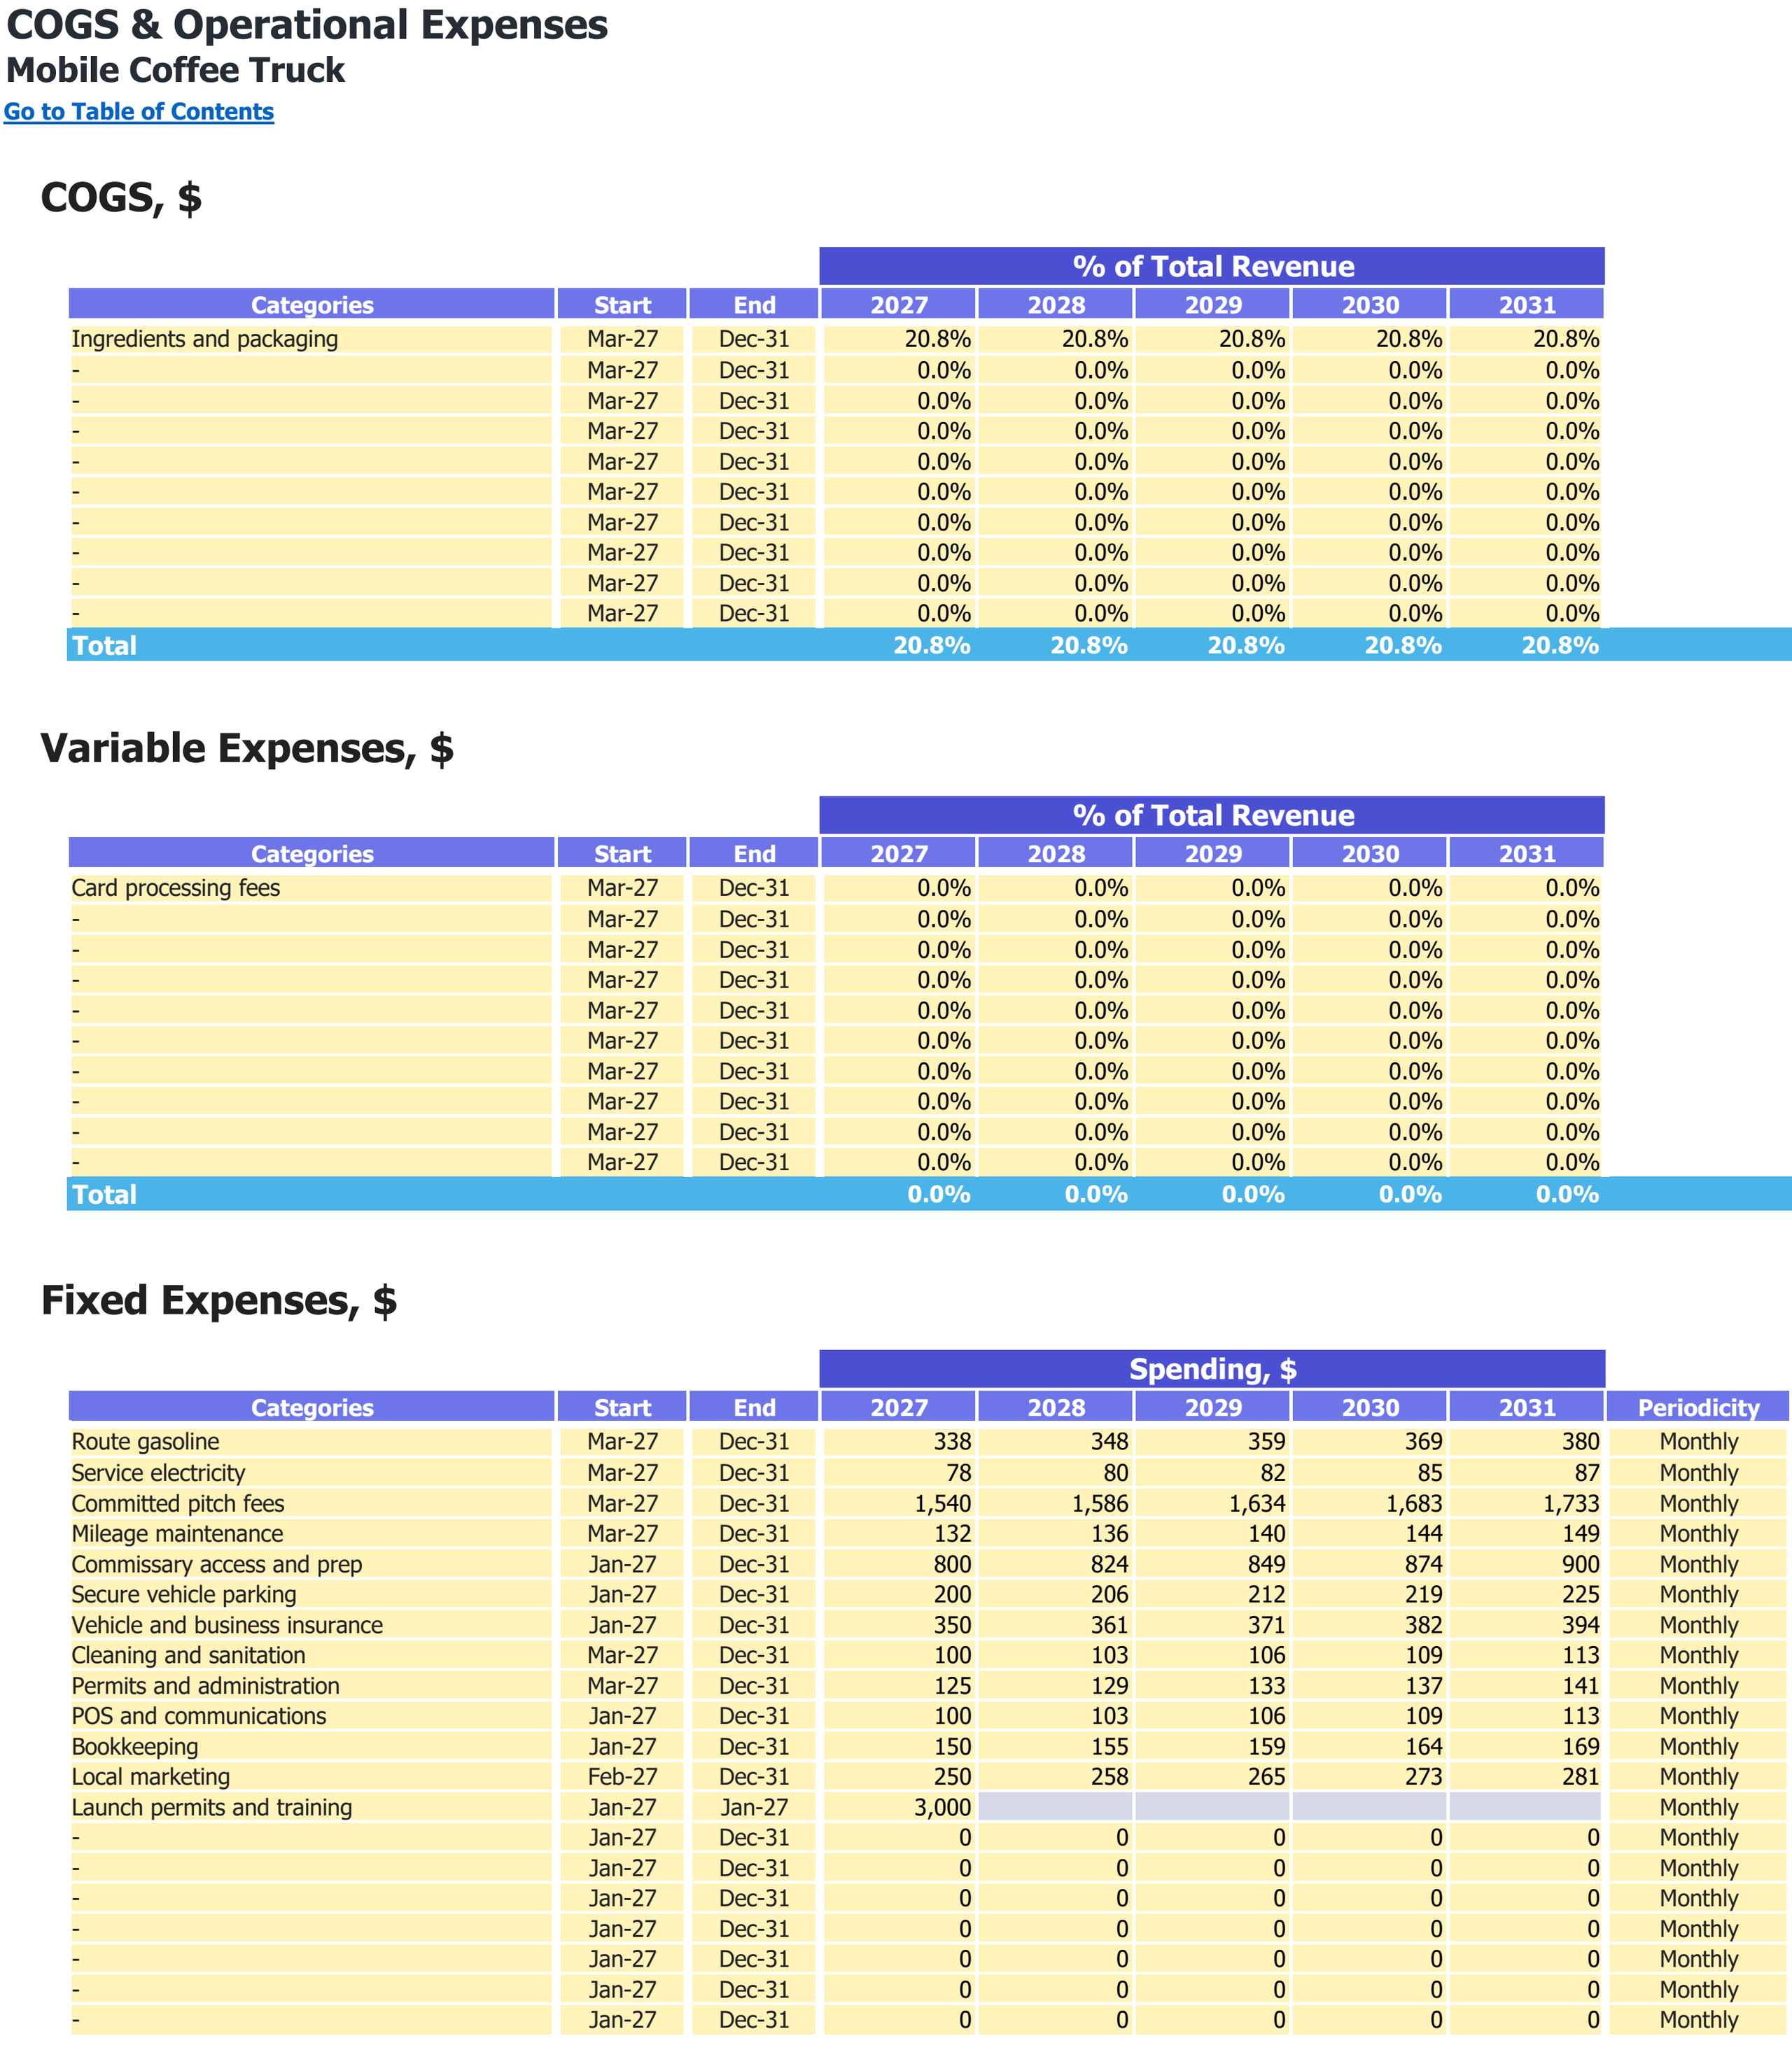
Food and other direct-cost categories, variable expense shares and fixed operating expenses. Monetary inputs are USD; the annual percentage columns are cost shares of revenue.
Enlarge image in a new tab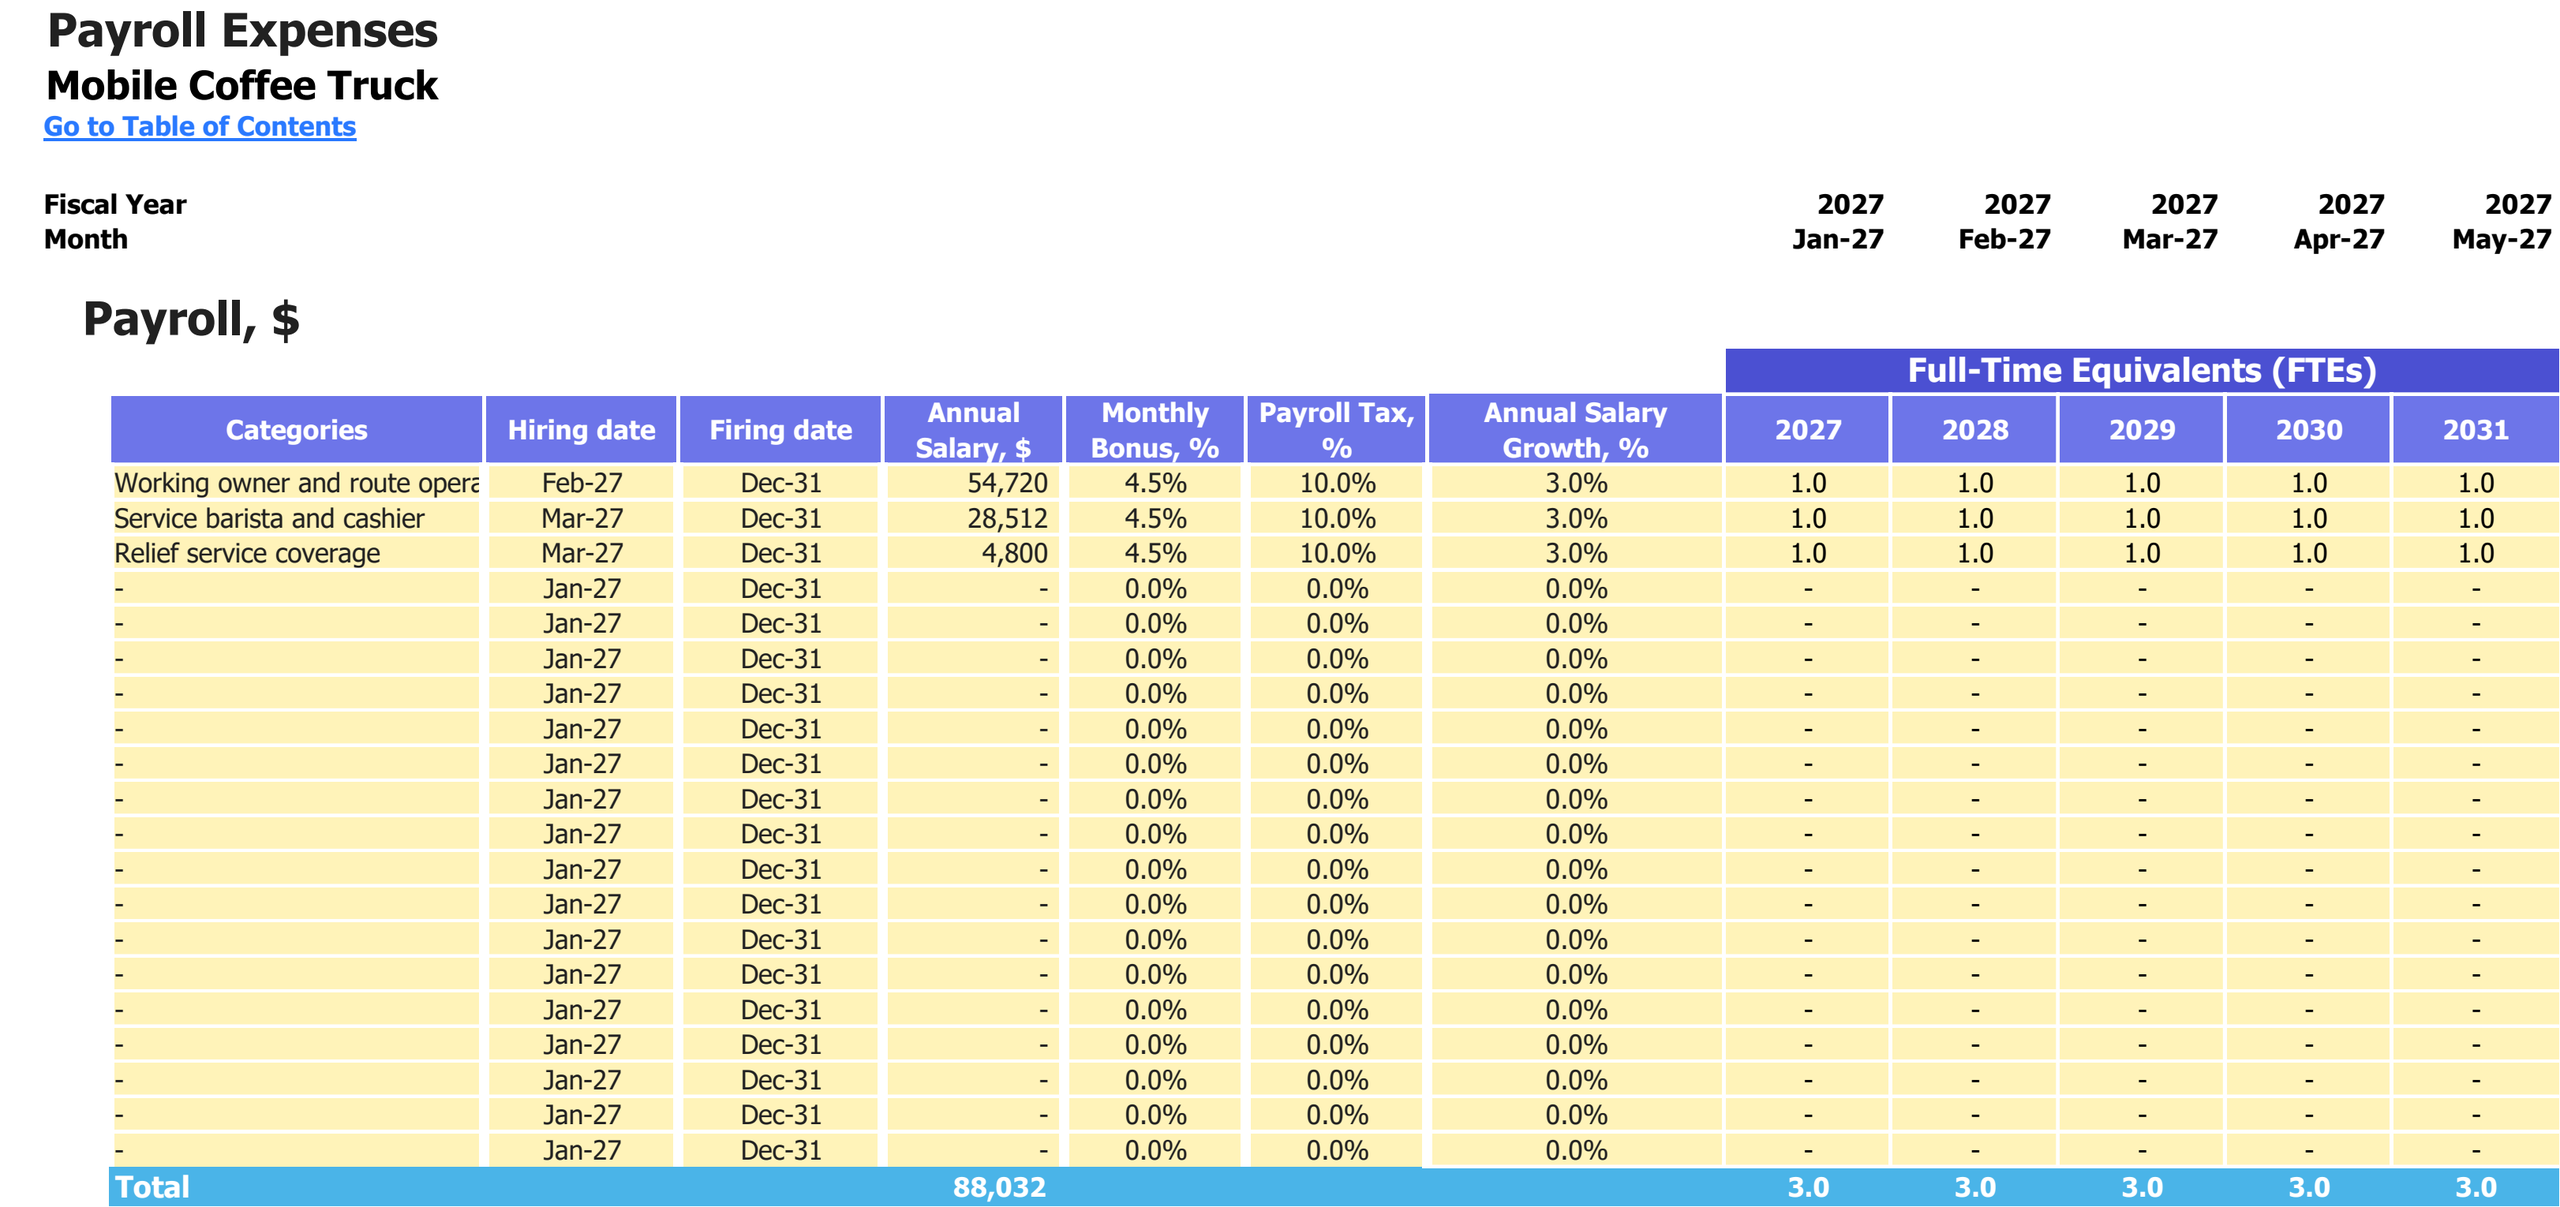
Paid roles, annual salary and employer-load assumptions, with staffing in full-time equivalents for 2027–2031. Salary amounts are USD; percentages and FTEs are labelled separately.
Enlarge image in a new tab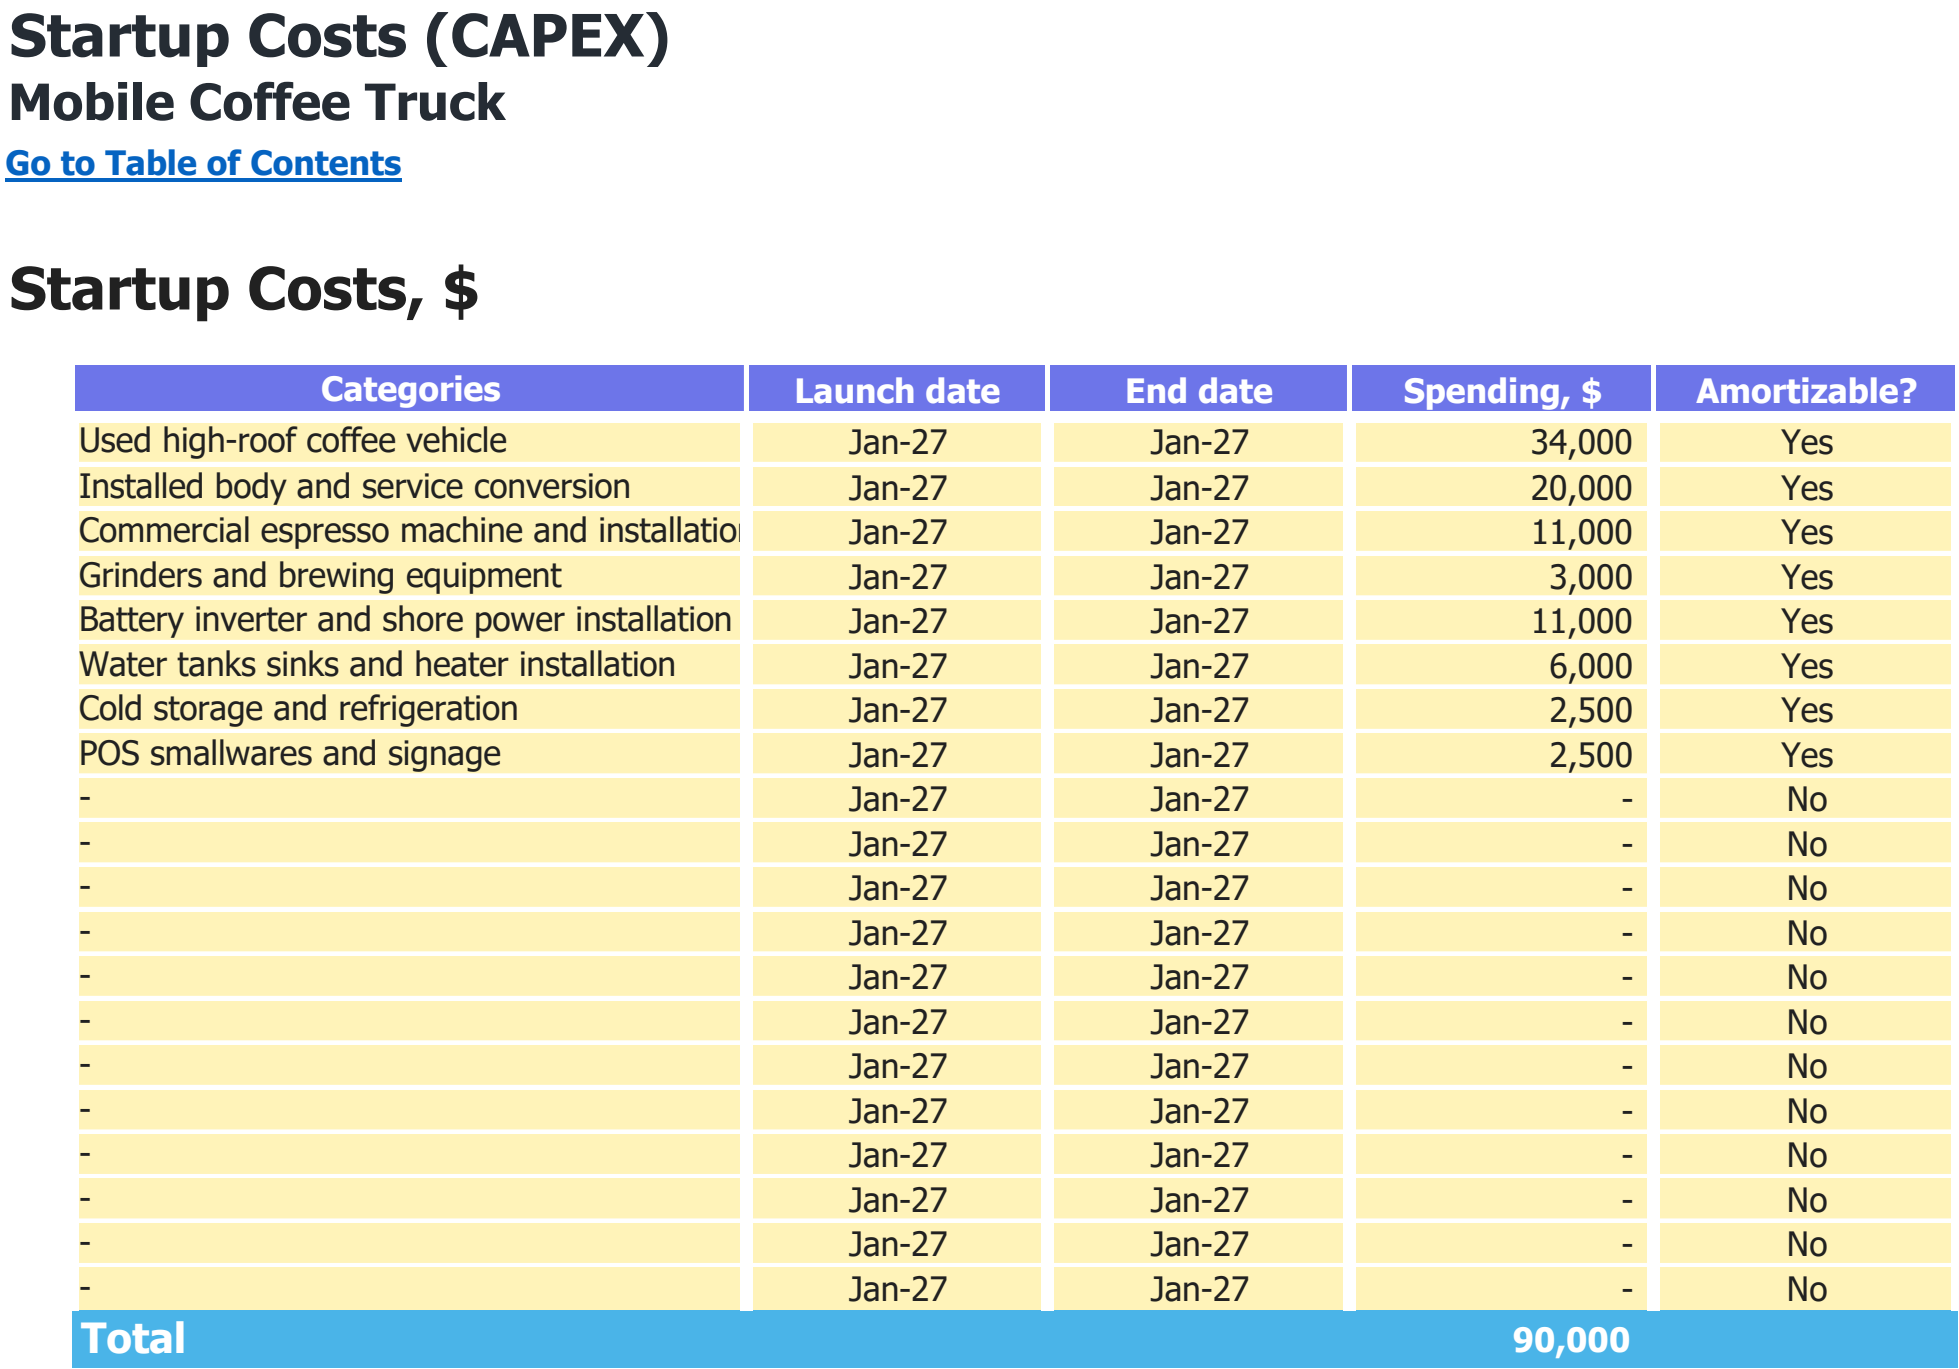
Asset categories, purchase dates and spending assumptions in USD. The total includes every scheduled purchase shown, including later replacements where present.
Enlarge image in a new tab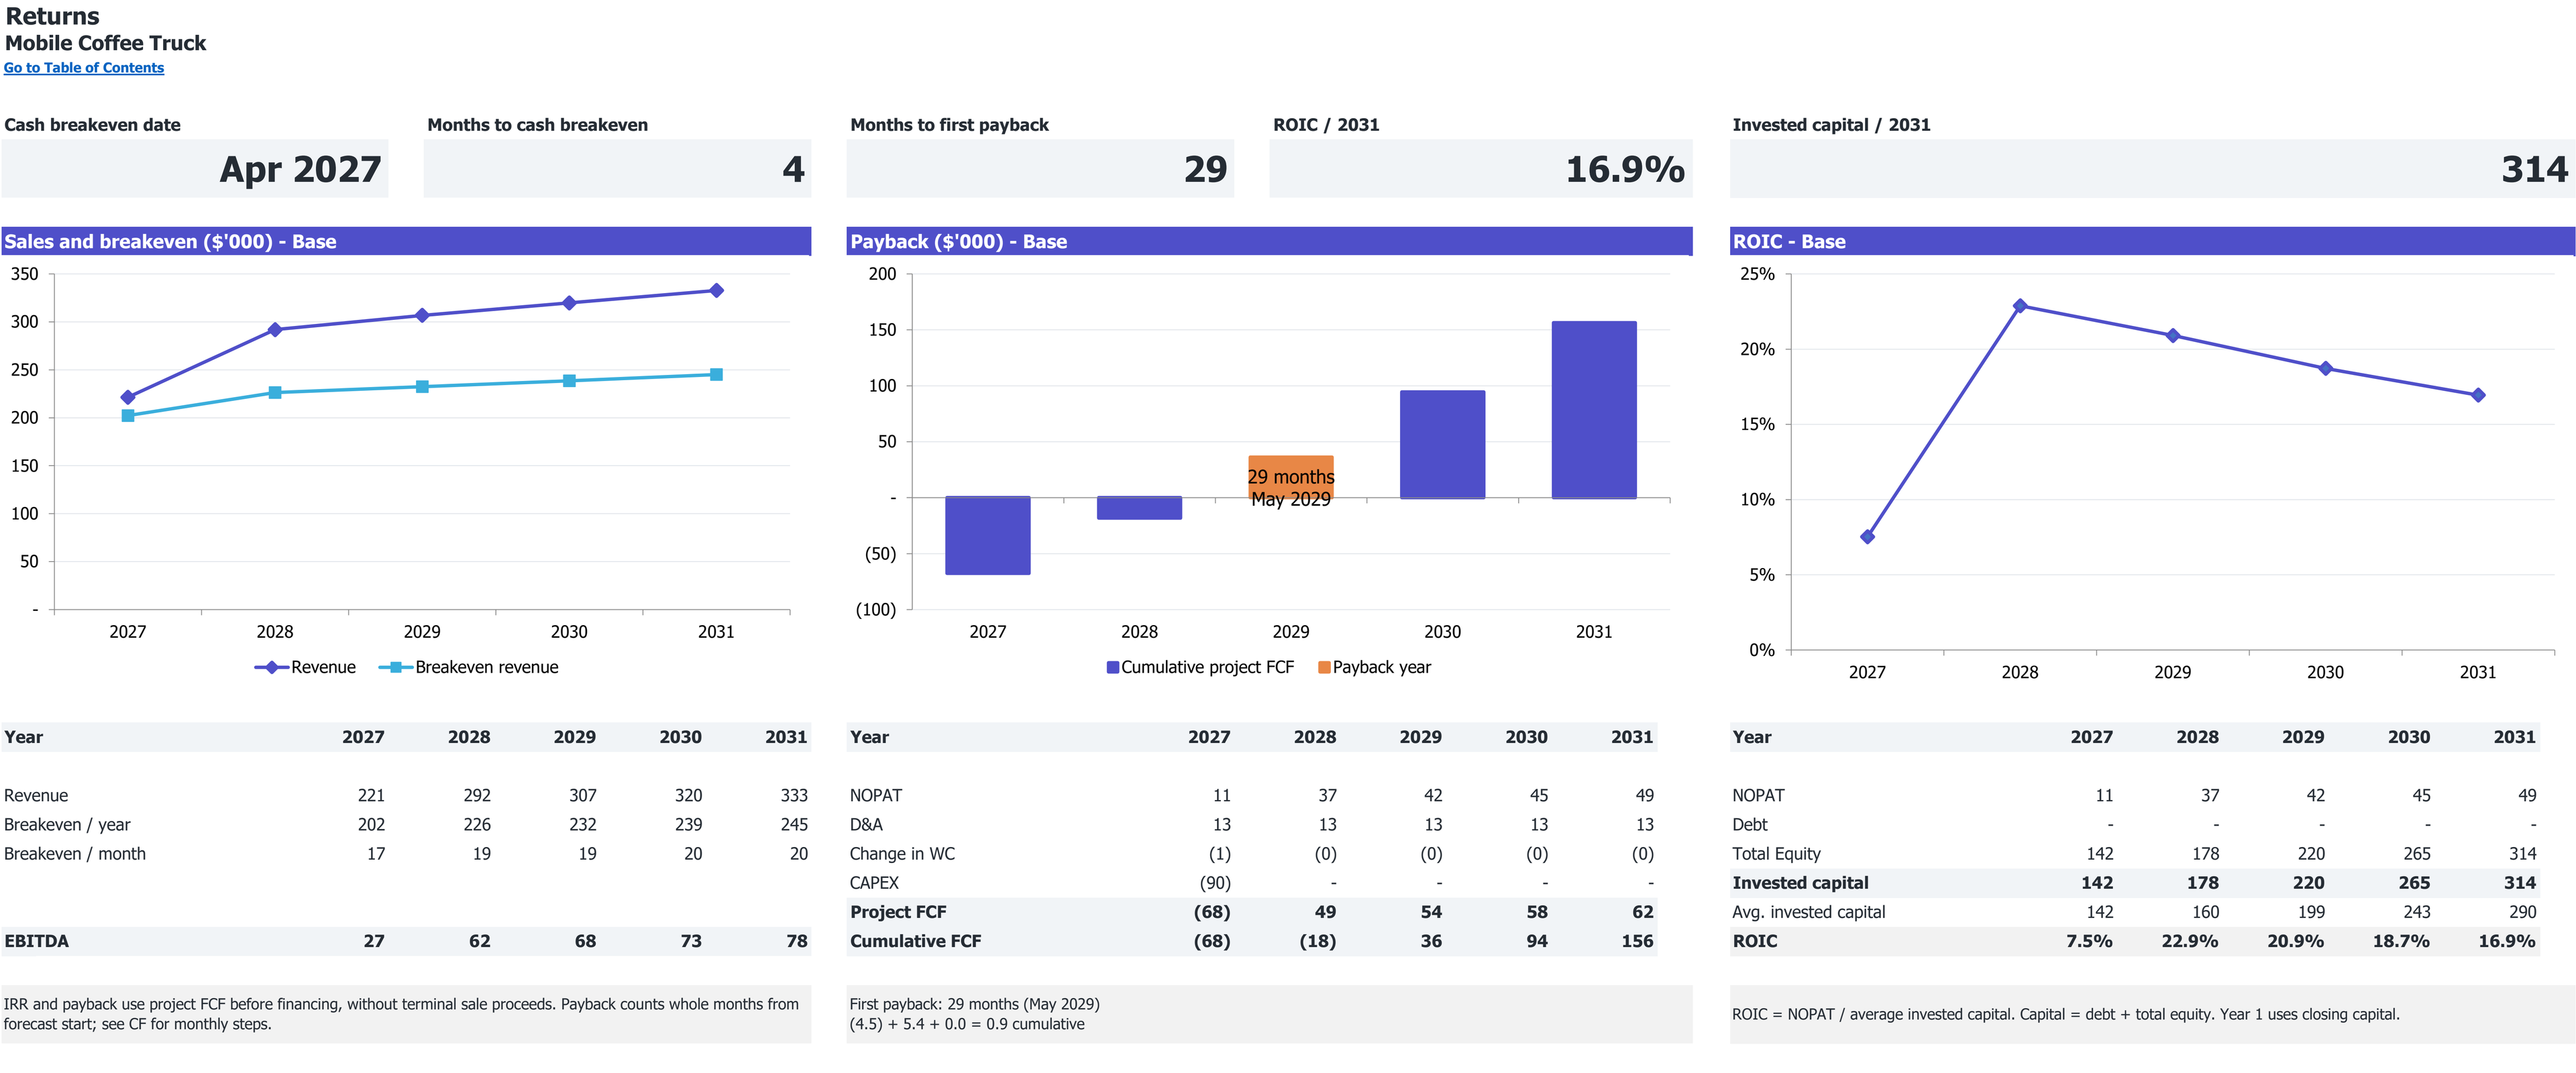
Excerpt from Returns: cumulative project free cash flow and first payback, if reached. 2027–2031 base case; dollar amounts in thousands.
Open full Returns view in a new tabExcerpt from Returns: revenue, annual and monthly break-even revenue, and EBITDA. 2027–2031 base case; dollar amounts in thousands.
Open full Returns view in a new tab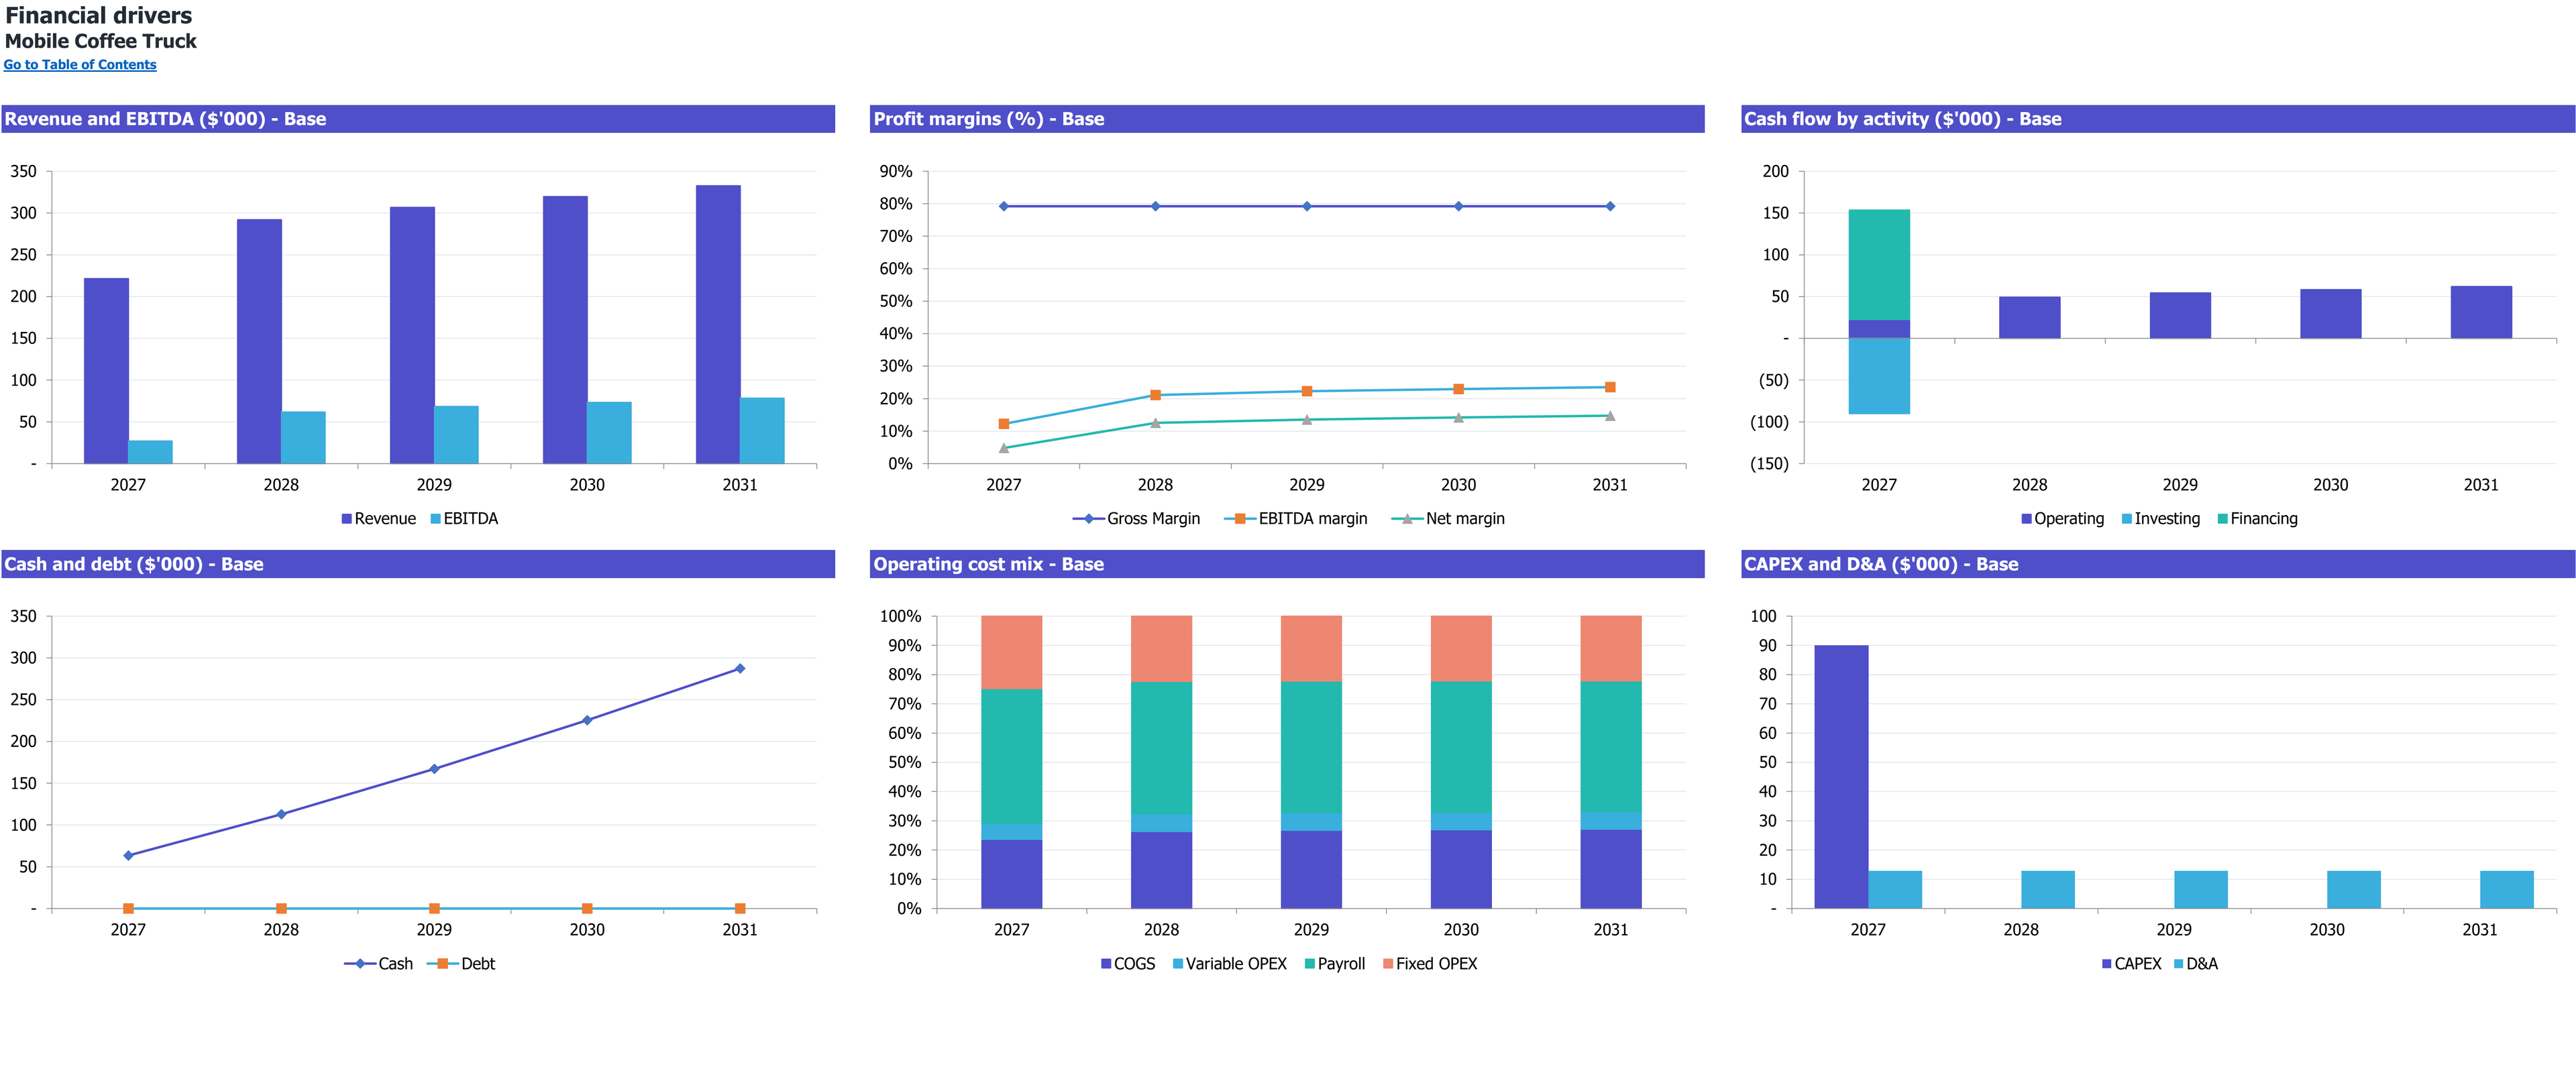
Six annual financial-driver charts for Mobile Coffee Truck, 2027–2031 (Base scenario). Dollar amounts are in thousands; margins and cost mix are percentages.
Enlarge image in a new tab8 selected worksheet views. Figures show this workbook’s starting case.
Workbook availability
What is inside the Excel model
Separate a coffee truck’s selling hours from travel, setup and cleaning. Test each pitch against demand and the same van’s preparation capacity, then follow route costs and investment into cash flow.
Selected worksheets from the documented workbook. Forecast period: January 2027–December 2031. Model reference: PHY002-04.
Inputs you control. Results you can inspect.
On a small screen, scroll within the table to read every column.
| Planning area | Inputs you review | How they connect | Results to inspect |
|---|---|---|---|
| Pitch demand | 110 morning and 80 afternoon mature orders/route. | Apply ramp/seasonality and each stop’s selling-hour ceiling. | Fulfilled orders at each pitch. |
| Throughput | 75 machine drinks/hour; 85% availability; mix-specific prep times. | Take the lowest machine, preparation and handover rate. | Shared achievable drinks/hour. |
| Menu and recipes | 25% black espresso, 55% latte, 20% flavored latte. | Use 18g beans/drink plus milk/syrup and a 5% loss allowance. | Sales, ingredient purchases and packaging. |
| Paid route | One travel hour, one setup/cleanup hour and owner administration. | Pay the full route commitment, assistant selling hours and relief once. | Payroll, pitch, fuel and vehicle costs. |
| Funding | $90,000 installed van CAPEX; $131,000 equity. | Cover the cash trough plus a $25,000 retained reserve. | Funded cash and project recovery. |
Is this the right model for your business?
Check the starting case before changing the assumptions.
The starting operation
- One beverage-only van working two regular pitches.
- An owner-operated route with paid assistant and relief coverage.
- A founder distinguishing selling time from the full paid workday.
Check the boundary
The saved case excludes food, subscriptions, delivery, separately contracted event fees and multiple simultaneous trucks.
Compare the other coffee shop typesHow this business makes money
Connect the unit sold to the resources required by this operating case.
Revenue logic
Fulfilled one-drink orders at the morning and afternoon pitches earn their selected menu prices.
Each stop is constrained separately; travel and setup consume paid time without creating sales.
How much of a coffee truck’s route day can actually earn sales?
Only the hours spent selling at approved pitches. Travel, setup, cleaning and administration still need pay, and each stop has its own demand ceiling. Adding paid route time without additional sellable hours can increase cost without increasing capacity.
- Selling
- Six hours across two pitches
- Other route work
- One travel hour plus one setup/cleaning hour
- Demand
- Separate morning and afternoon requests
What to establish for your own operation
- Verify pitch rights and measured customer traffic.
- Time complete drink preparation and handover.
- Budget the owner’s full day and weather or closure exposure.
Follow the plan from demand to cash
Open each section for the assumptions, calculations, and limits of this workbook’s starting case.
Count six selling hours within a longer paid dayRevenue
The route has 3.5 morning selling hours and 2.5 afternoon hours, plus travel and setup/cleaning. Twenty-two monthly routes are a fixed planning input. Each stop fulfills the smaller of its demand and its own capacity.
The same machine and crew support both pitches. Initial prices are $4.50 black espresso, $5.50 latte and $6.50 flavored latte. Drink mix changes weighted preparation time; the machine rating alone does not establish sales.
- The launch ramp is 60%, 80%, then full demand.
- Travel and cleaning do not earn drink revenue.
- Fixed route counts do not automatically follow calendar weekdays.
Pay for the full mobile operating commitmentPayroll
The owner budget covers travel, selling, setup, cleaning and administration at an initial $24/hour equivalent. The assistant covers selling hours at $18/hour; relief adds 20 hours/month at $20. Committed monthly wages remain when demand falls.
Ingredients use explicit bean, milk and syrup quantities, with $0.20 complete packaging per drink. Route costs include fuel, service power, two pitch fees and mileage maintenance. Commissary and secure parking are separate ongoing commitments.
- The 5% ingredient loss is applied once.
- A closure stops sales but does not cancel committed wages and overhead.
- Workers compensation is included in the payroll allowance, not duplicated in insurance.
Fund the vehicle and launch deficit separatelyCAPEX
January CAPEX is $90,000: a $34,000 vehicle plus conversion, espresso equipment, power, water, refrigeration and supporting assets. These are installed planning budgets requiring supplier confirmation. No later replacement CAPEX is modeled.
January equity of $131,000 covers the $105,240 unfunded cash trough and a $25,000 reserve, rounded upward. The lowest funded cash is $25,760 in March 2027. There is no debt.
- The startup deficit includes wages, launch expenses and inventory.
- Assets use seven-year book depreciation from acquisition.
- Changing the sales opening date does not automatically move payroll and overhead dates.
Test route demand against committed costsCF
Base 2027 revenue is $221,431 from 40,630 drink orders, with EBITDA of $27,081. EBITDA first becomes positive in April 2027 and stays positive; pretax profit first turns positive in May.
Project payback occurs in May 2029, month 29. This cumulative undiscounted unlevered cash measure includes startup uses and taxes without financing or terminal proceeds. No owner distribution policy is assumed.
- Halving both pitch-demand inputs produces −$192,716 minimum cash with Base equity fixed.
- The monetary Downside case produces −$9,832 minimum cash.
- A profitable Base route does not confirm pitch rights or customer demand.
Selected results from the starting case
Modeled results in USD unless stated otherwise. These describe the selected inputs, not an estimate for your location or a guaranteed outcome.
- 2027 revenue
- $221,431USD, Base; ten trading months after March opening.
- 2027 EBITDA
- $27,081USD, Base; paid owner labor and startup costs included.
- Initial CAPEX
- $90,000USD; vehicle and installed conversion/equipment in January 2027.
- Minimum cash
- $25,760USD, funded Base balance in March 2027.
- Project payback
- May 2029 / month 29Whole-month cumulative undiscounted project cash recovery; no later reversal.
Make the case your own
Work from the operating plan toward the cash requirement.
Set planned routes, pitch demand and selling hours.
Validate the full paid route and preparation workflow.
Replace vehicle, power, ingredient and pitch-fee allowances.
Review lower-demand cash needs and align all launch dates.
Interpretation and scope
- The national case is not a pitch contract or local permit assessment.
- Fixed monthly routes omit actual weekday and holiday counts.
- Constant within-year drink mix supports the native annual food-cost relationship.
- Same-month settlement and zero AR/AP simplify cash timing.
- The 25% tax allowance has no selected jurisdiction or loss carryforward; no later replacement or owner payouts are modeled.
The workbook is an Excel file for local planning. Learn how to interpret assumptions and evidence.
Other coffee shop types
Each operating type calls for its own financial structure.
Questions
Is every paid route hour a selling hour?
No. Travel, setup, cleaning and administration are paid non-selling time.
Are event package fees included?
No. Revenue comes from individual drink sales at two pitches.
Does closing a route remove all costs?
No. Committed payroll and recurring budgets remain until changed.
Does the machine’s 75-drink rating set actual sales?
No. Preparation, handover, availability and pitch demand also limit orders.
Does payback repay the owner through distributions?
No. It measures project cash recovery; cash stays in the business under the saved assumptions.
Can I buy this model now?
No. Purchasing and workbook downloads are not available on this site.
Which software does the workbook use?
The documented file is an Excel workbook (.xlsx). Compatibility with other spreadsheet applications is not established by the file extension.
Read the planning guides
Explore the relevant operating questions and how to interpret a workbook’s assumptions.
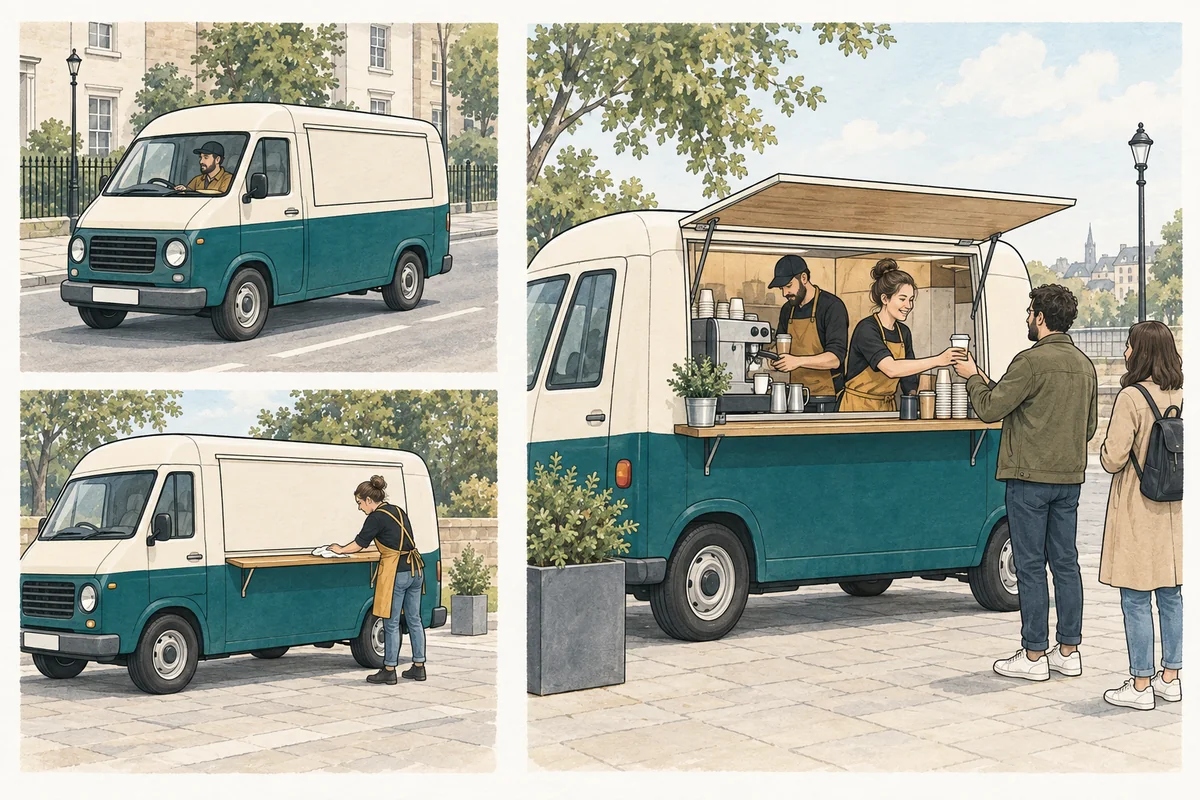
How much of a coffee truck route is actually available for selling?
Separate a coffee truck's selling windows from travel and setup, calculate drink throughput, and test each stop against its own demand and paid route costs.
Read the guide
Which coffee business fits your customers and working day?
Compare a seated coffee shop, takeaway kiosk, mobile truck, and employer-paid service by customer, location, daily work, and the evidence each idea needs.
Read the guide
How to read financial assumptions before editing an Excel model
Follow the chain from operating assumptions to calculated results, check units and timing, and keep a useful record of changes to a financial workbook.
Read the guideEvidence and scope
A related category or operator is referenced. Do not interpret the link as independent proof of this exact configuration or its viability.
The links below provide operating-format context; they do not verify the workbook’s selected inputs or calculated returns.
The workbook guide and figures describe model PHY002-04, revision r01, for January 2027–December 2031. These are a documented planning case, not observed results for a particular business.