
Coffee Shop Financial Model: Employer-Paid Workplace Coffee Service
Plan employer-paid coffee contracts with employee-month billing, purchased stations, beverage consumption, routes and staged expansion funding.
- Excel (.xlsx)
- Contract site: 100 eligible employees
- Initial pricing: $20 standard / $25 specialty per employee-month
- Station plan: 24 at launch / 56 by year five
Planning several types? Compare 8 coffee shop formats
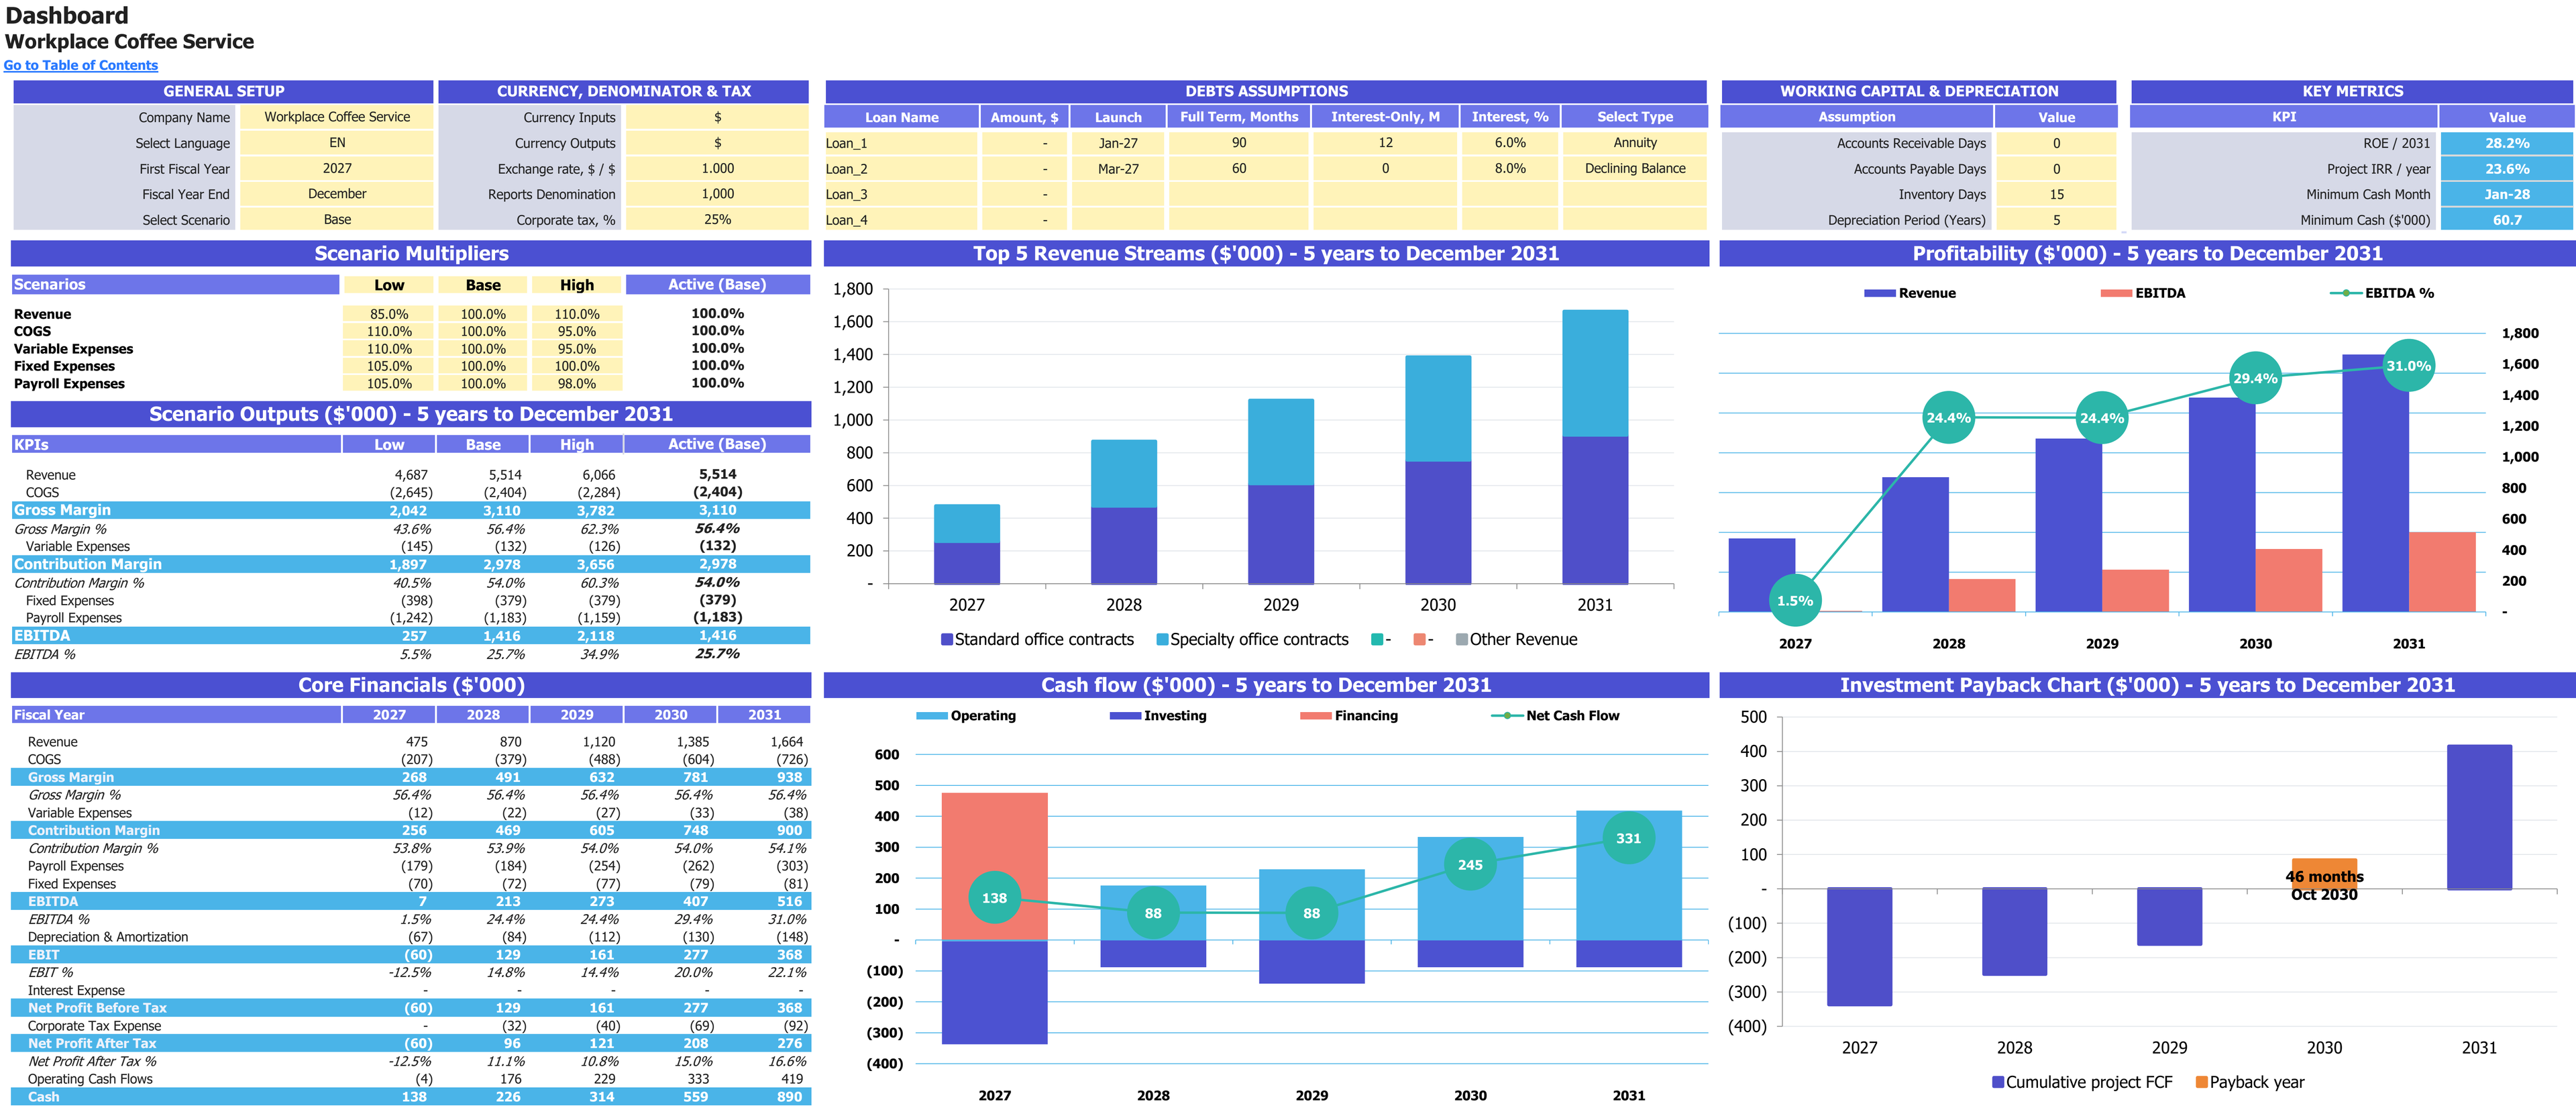
Base-case scenario controls, annual financial results and charts for 2027–2031. Financial report amounts are shown in thousands of USD; percentage measures retain their own units.
Enlarge image in a new tab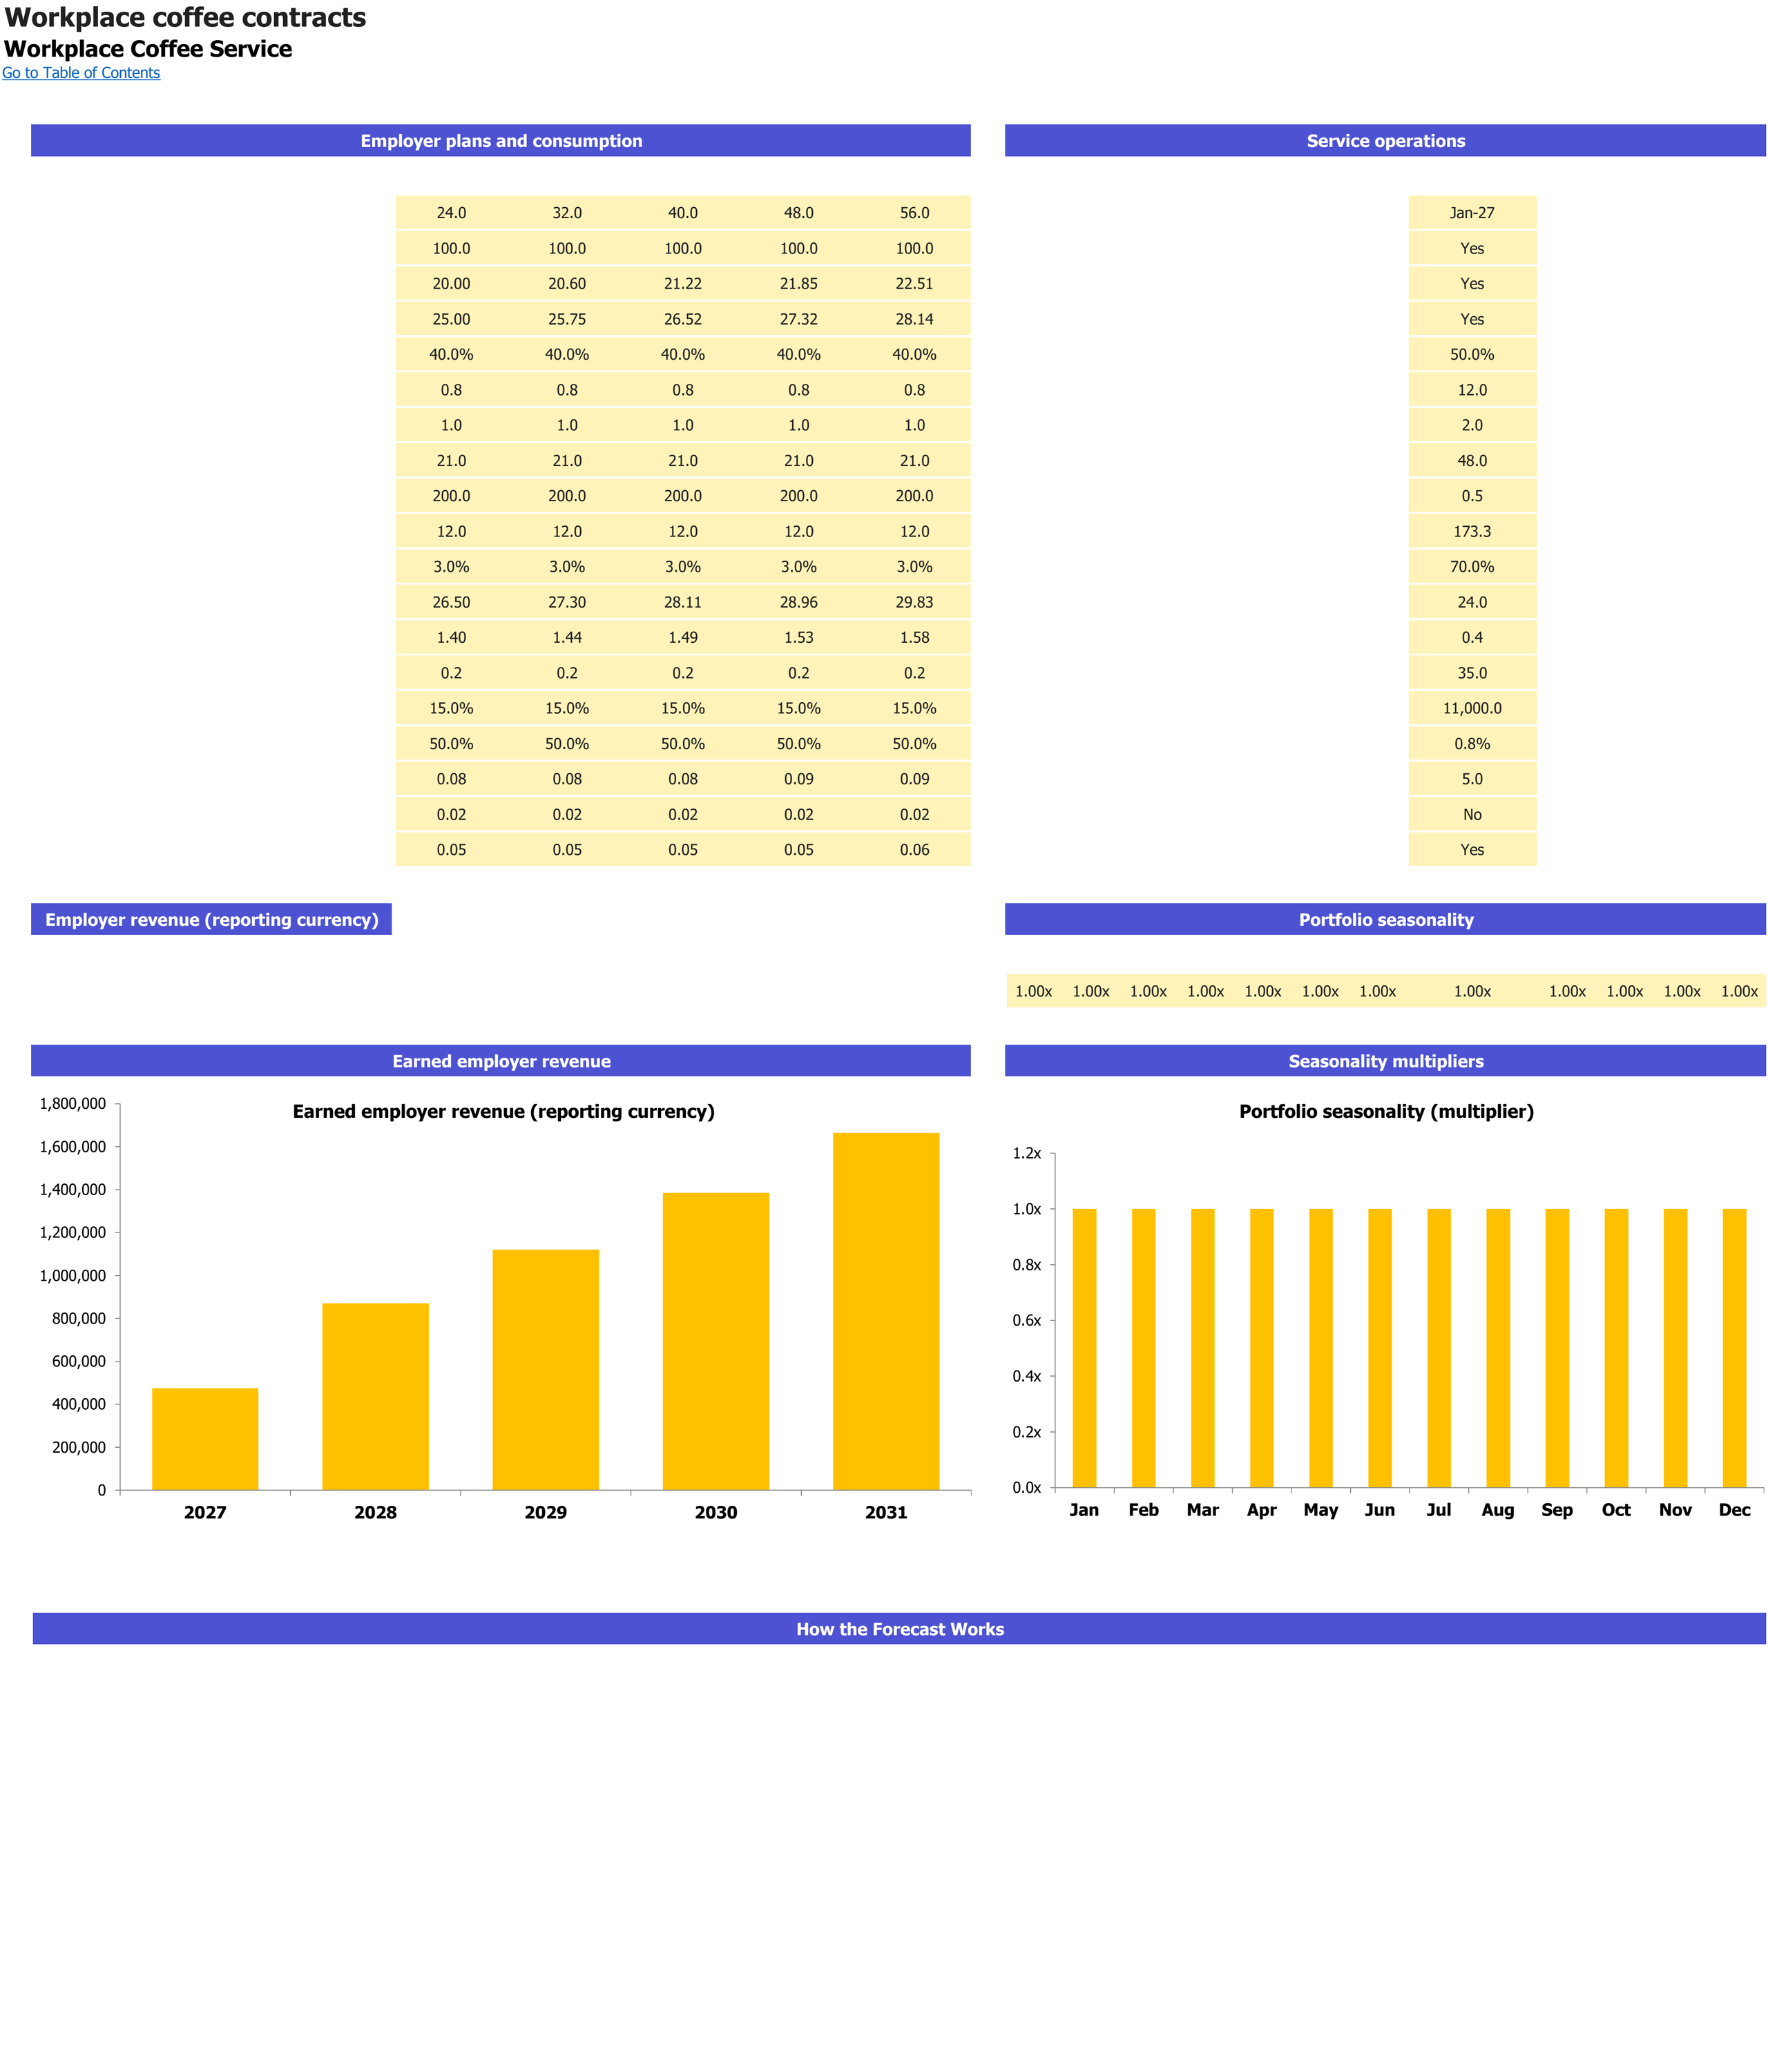
Employer plans, eligible employees, purchased stations and route-service constraints. Monetary inputs and sales use USD; operating volumes retain their labelled units. Forecast years are 2027–2031.
Enlarge image in a new tab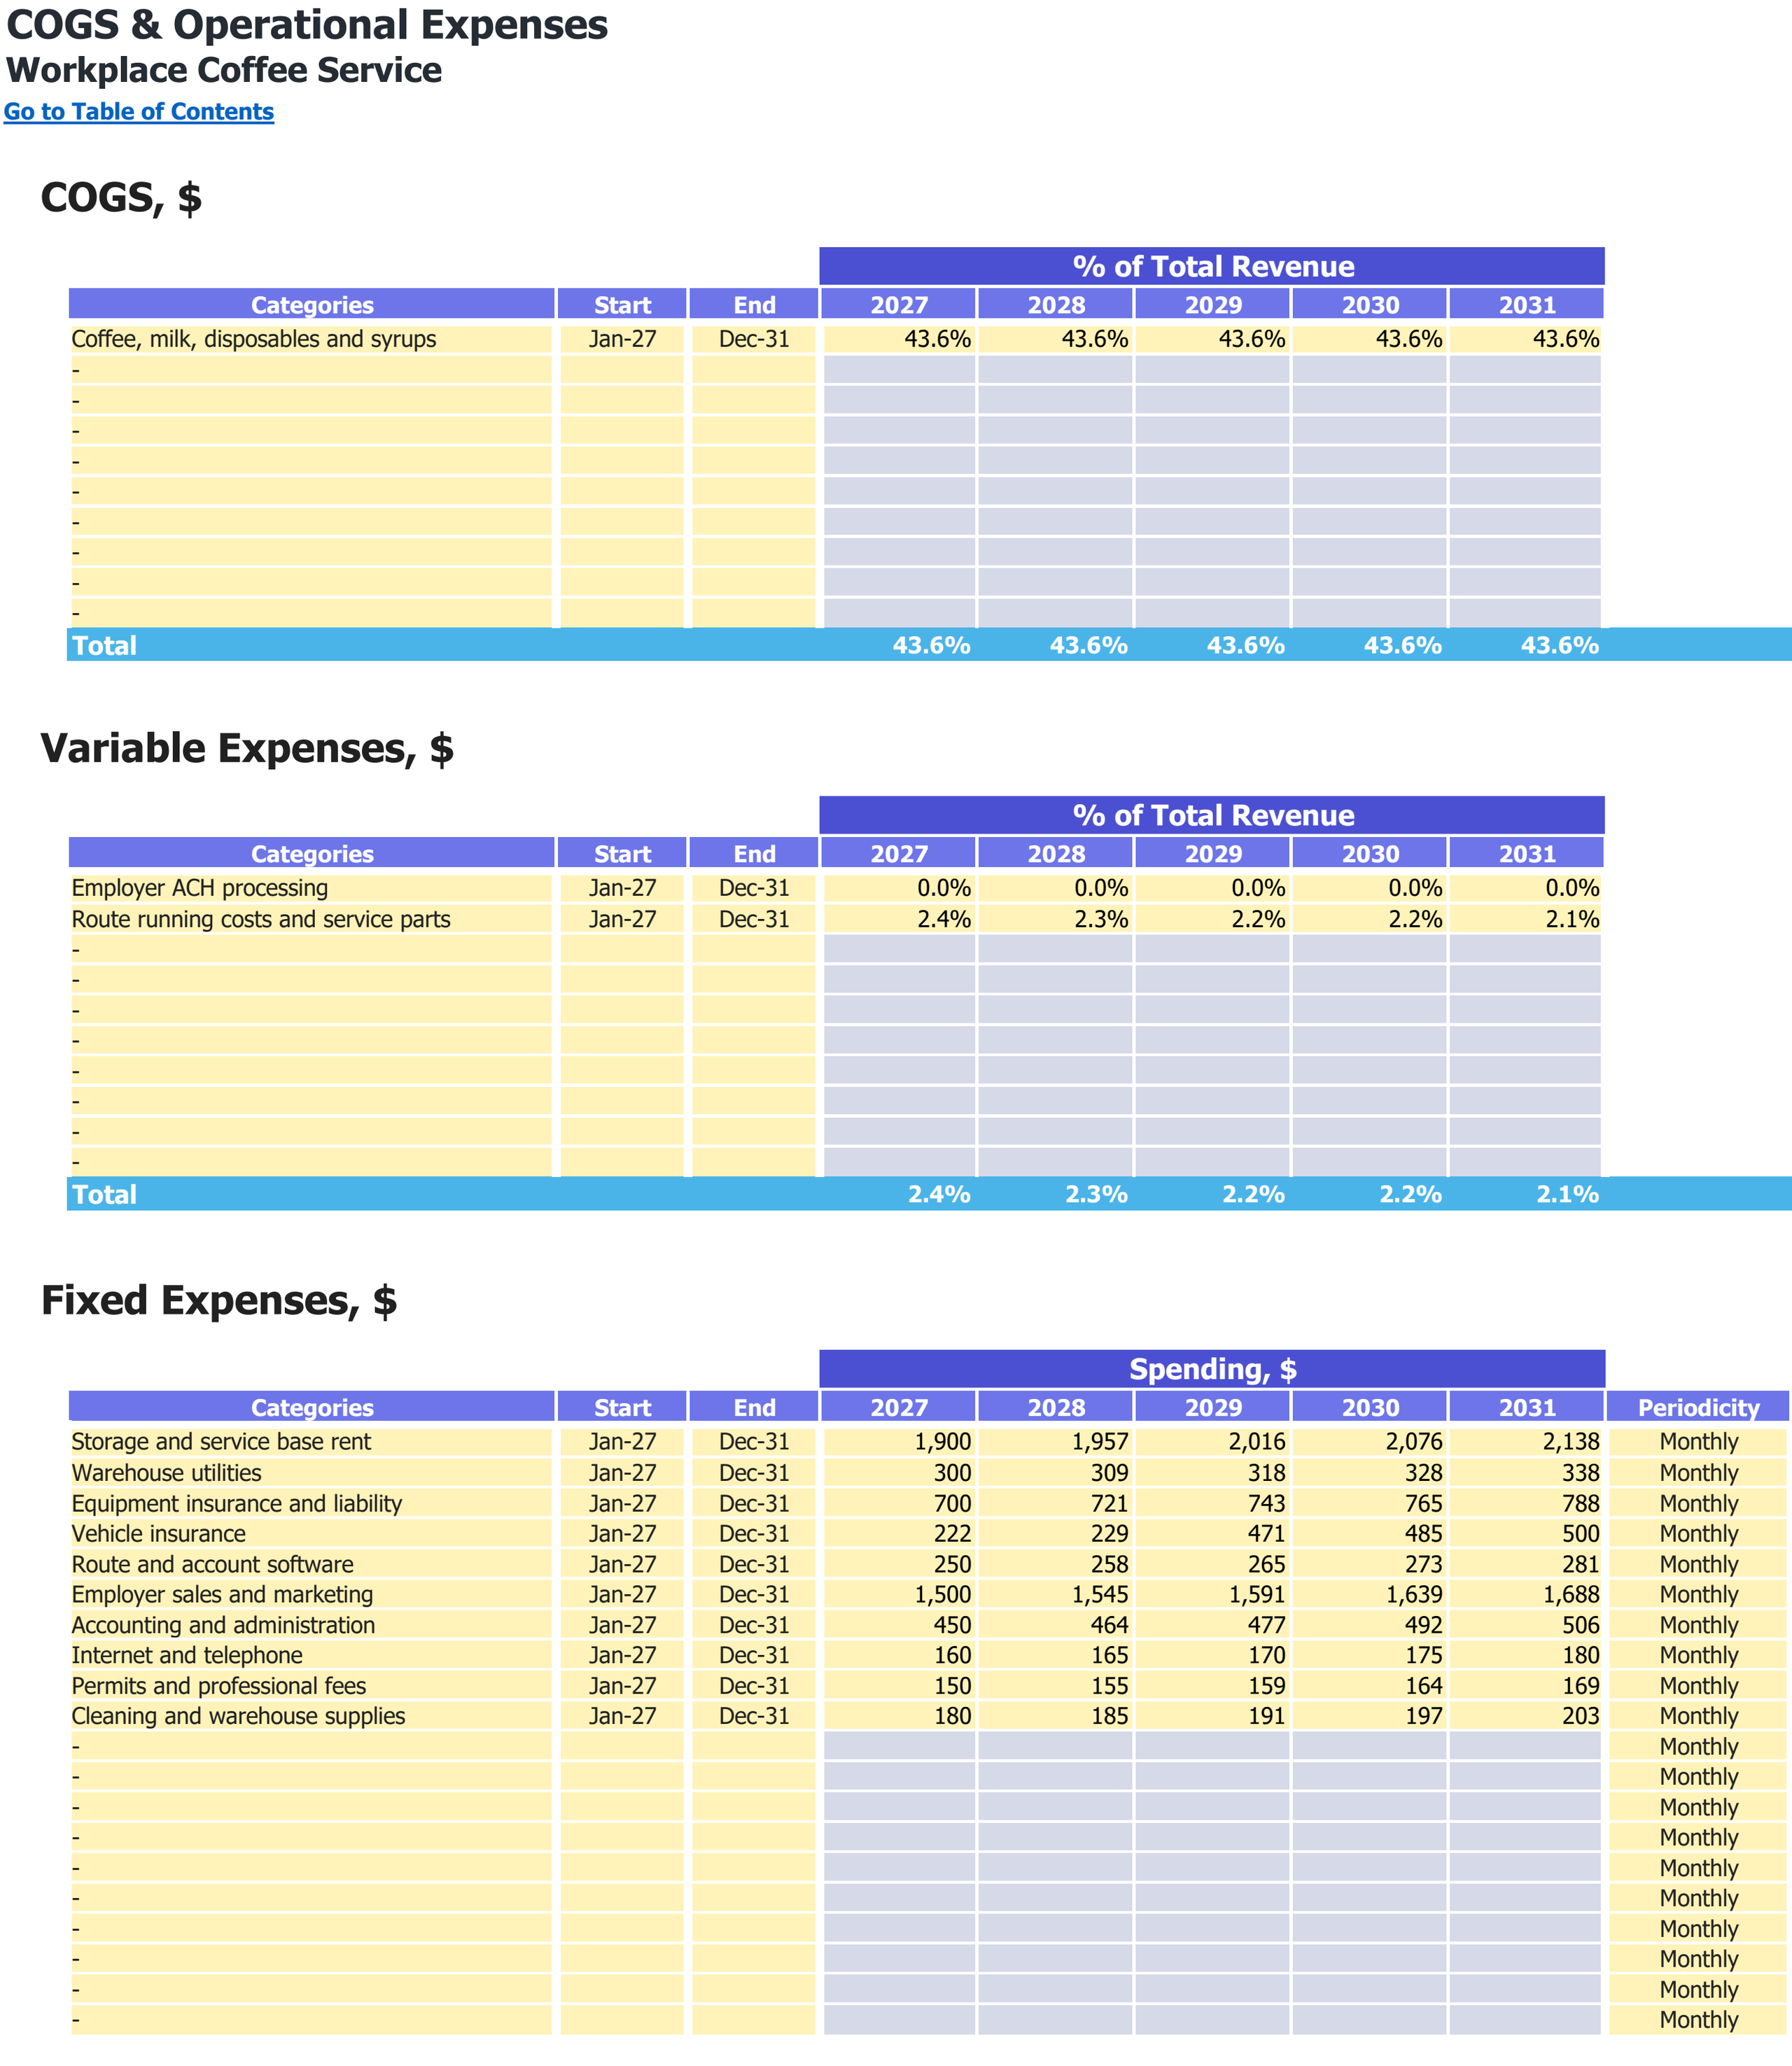
Food and other direct-cost categories, variable expense shares and fixed operating expenses. Monetary inputs are USD; the annual percentage columns are cost shares of revenue.
Enlarge image in a new tab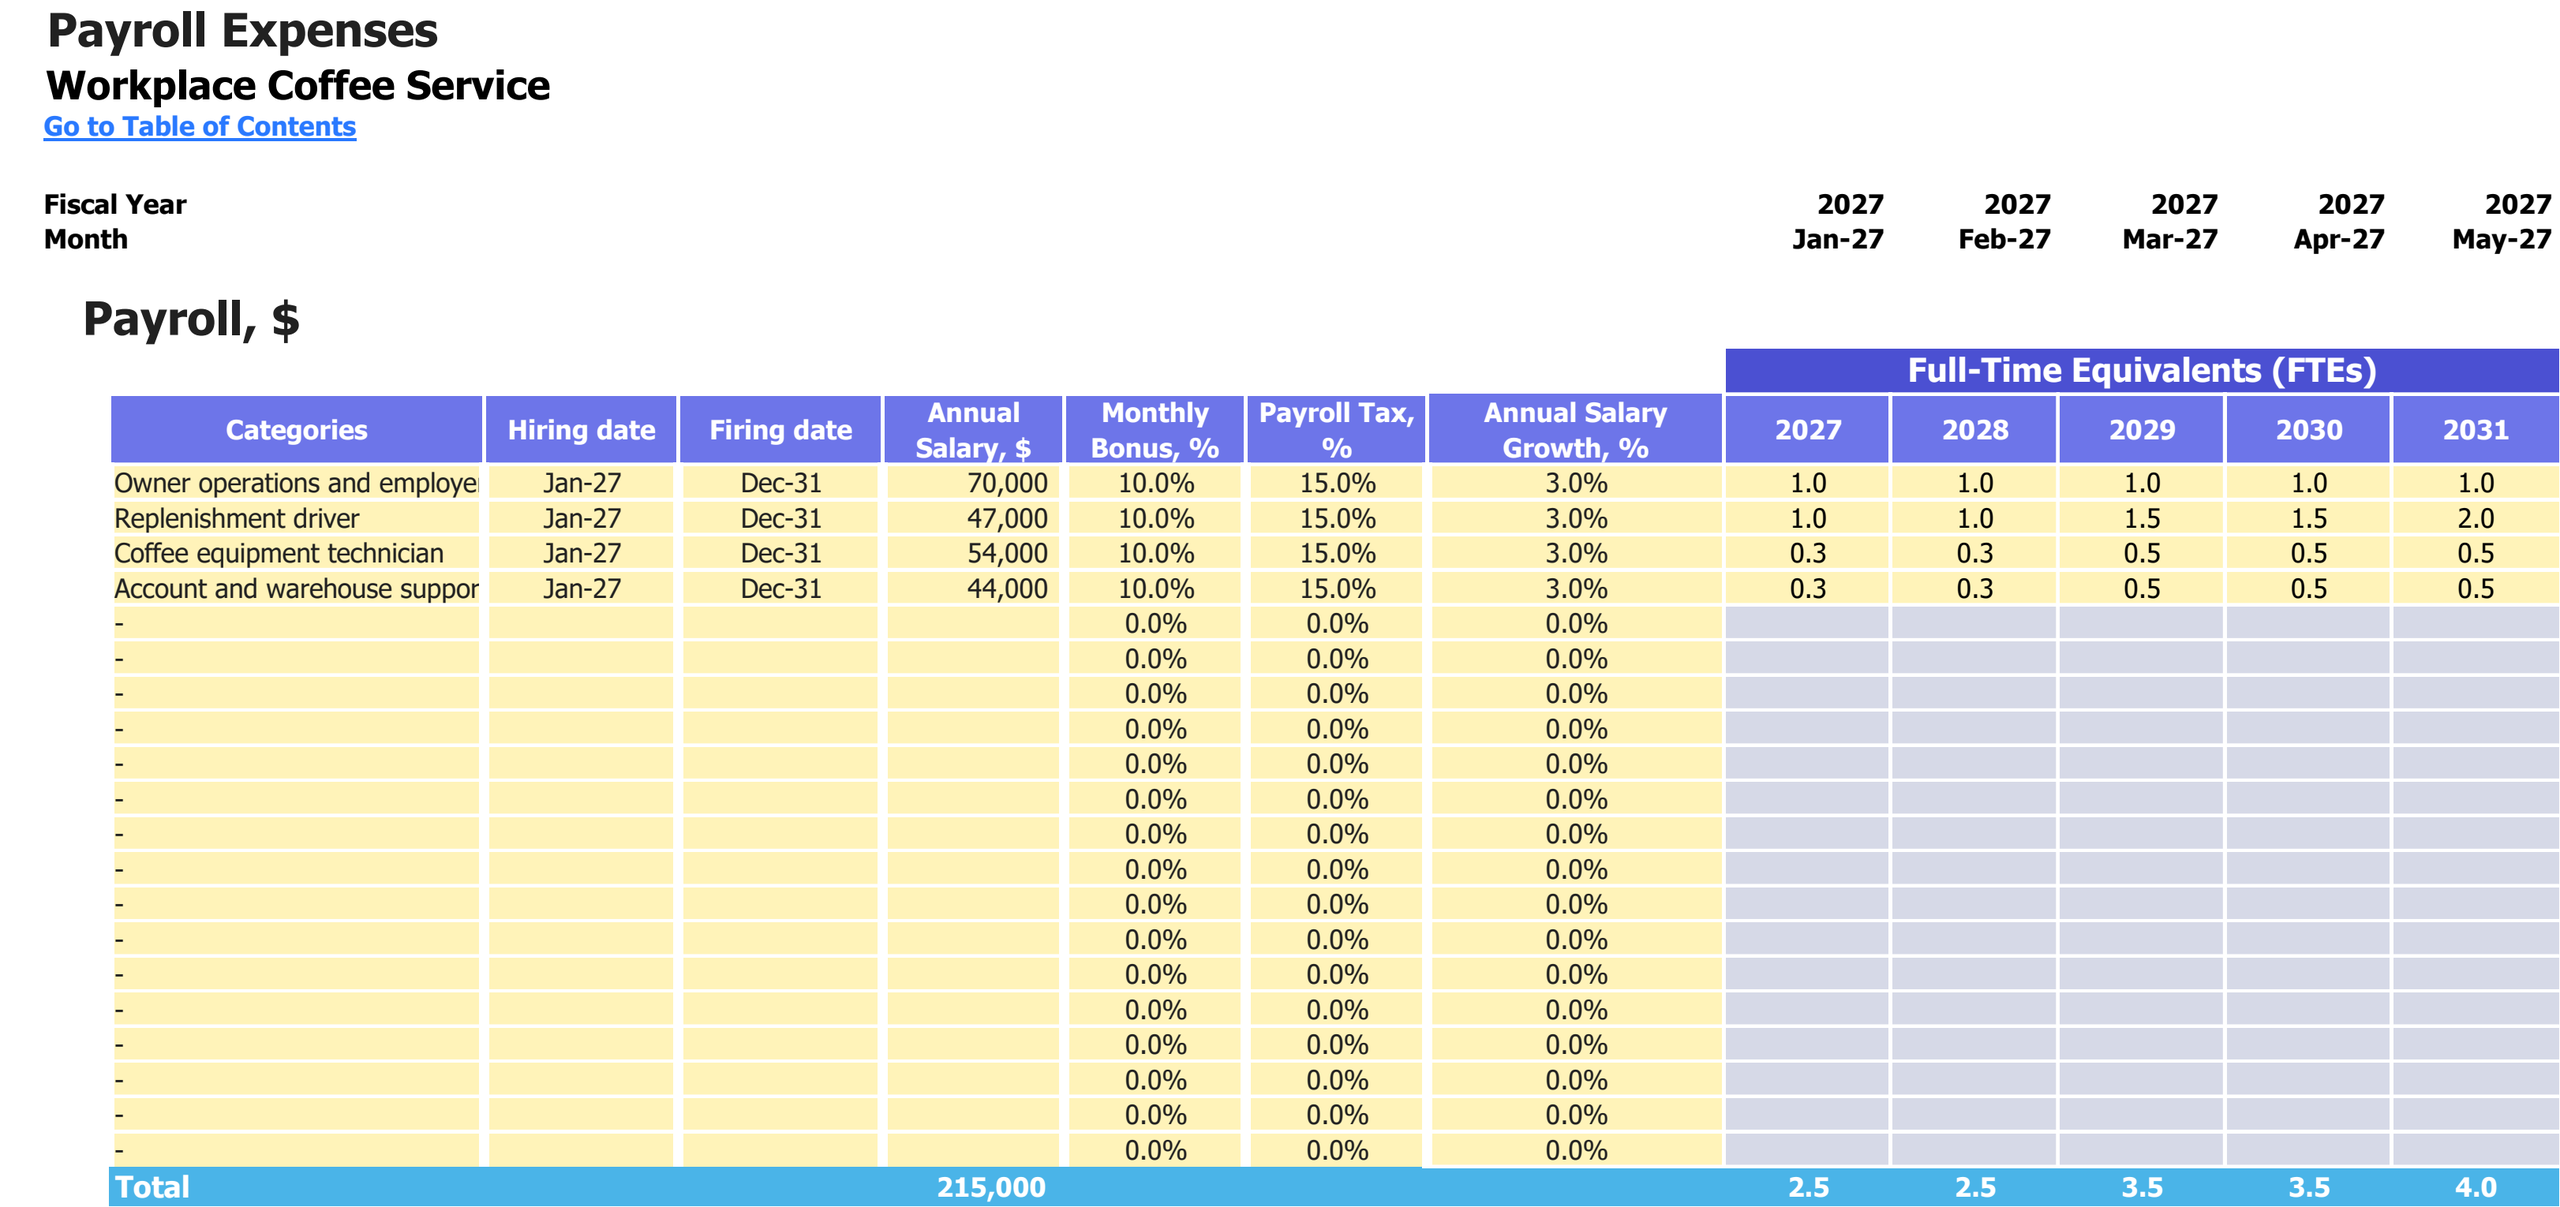
Paid roles, annual salary and employer-load assumptions, with staffing in full-time equivalents for 2027–2031. Salary amounts are USD; percentages and FTEs are labelled separately.
Enlarge image in a new tab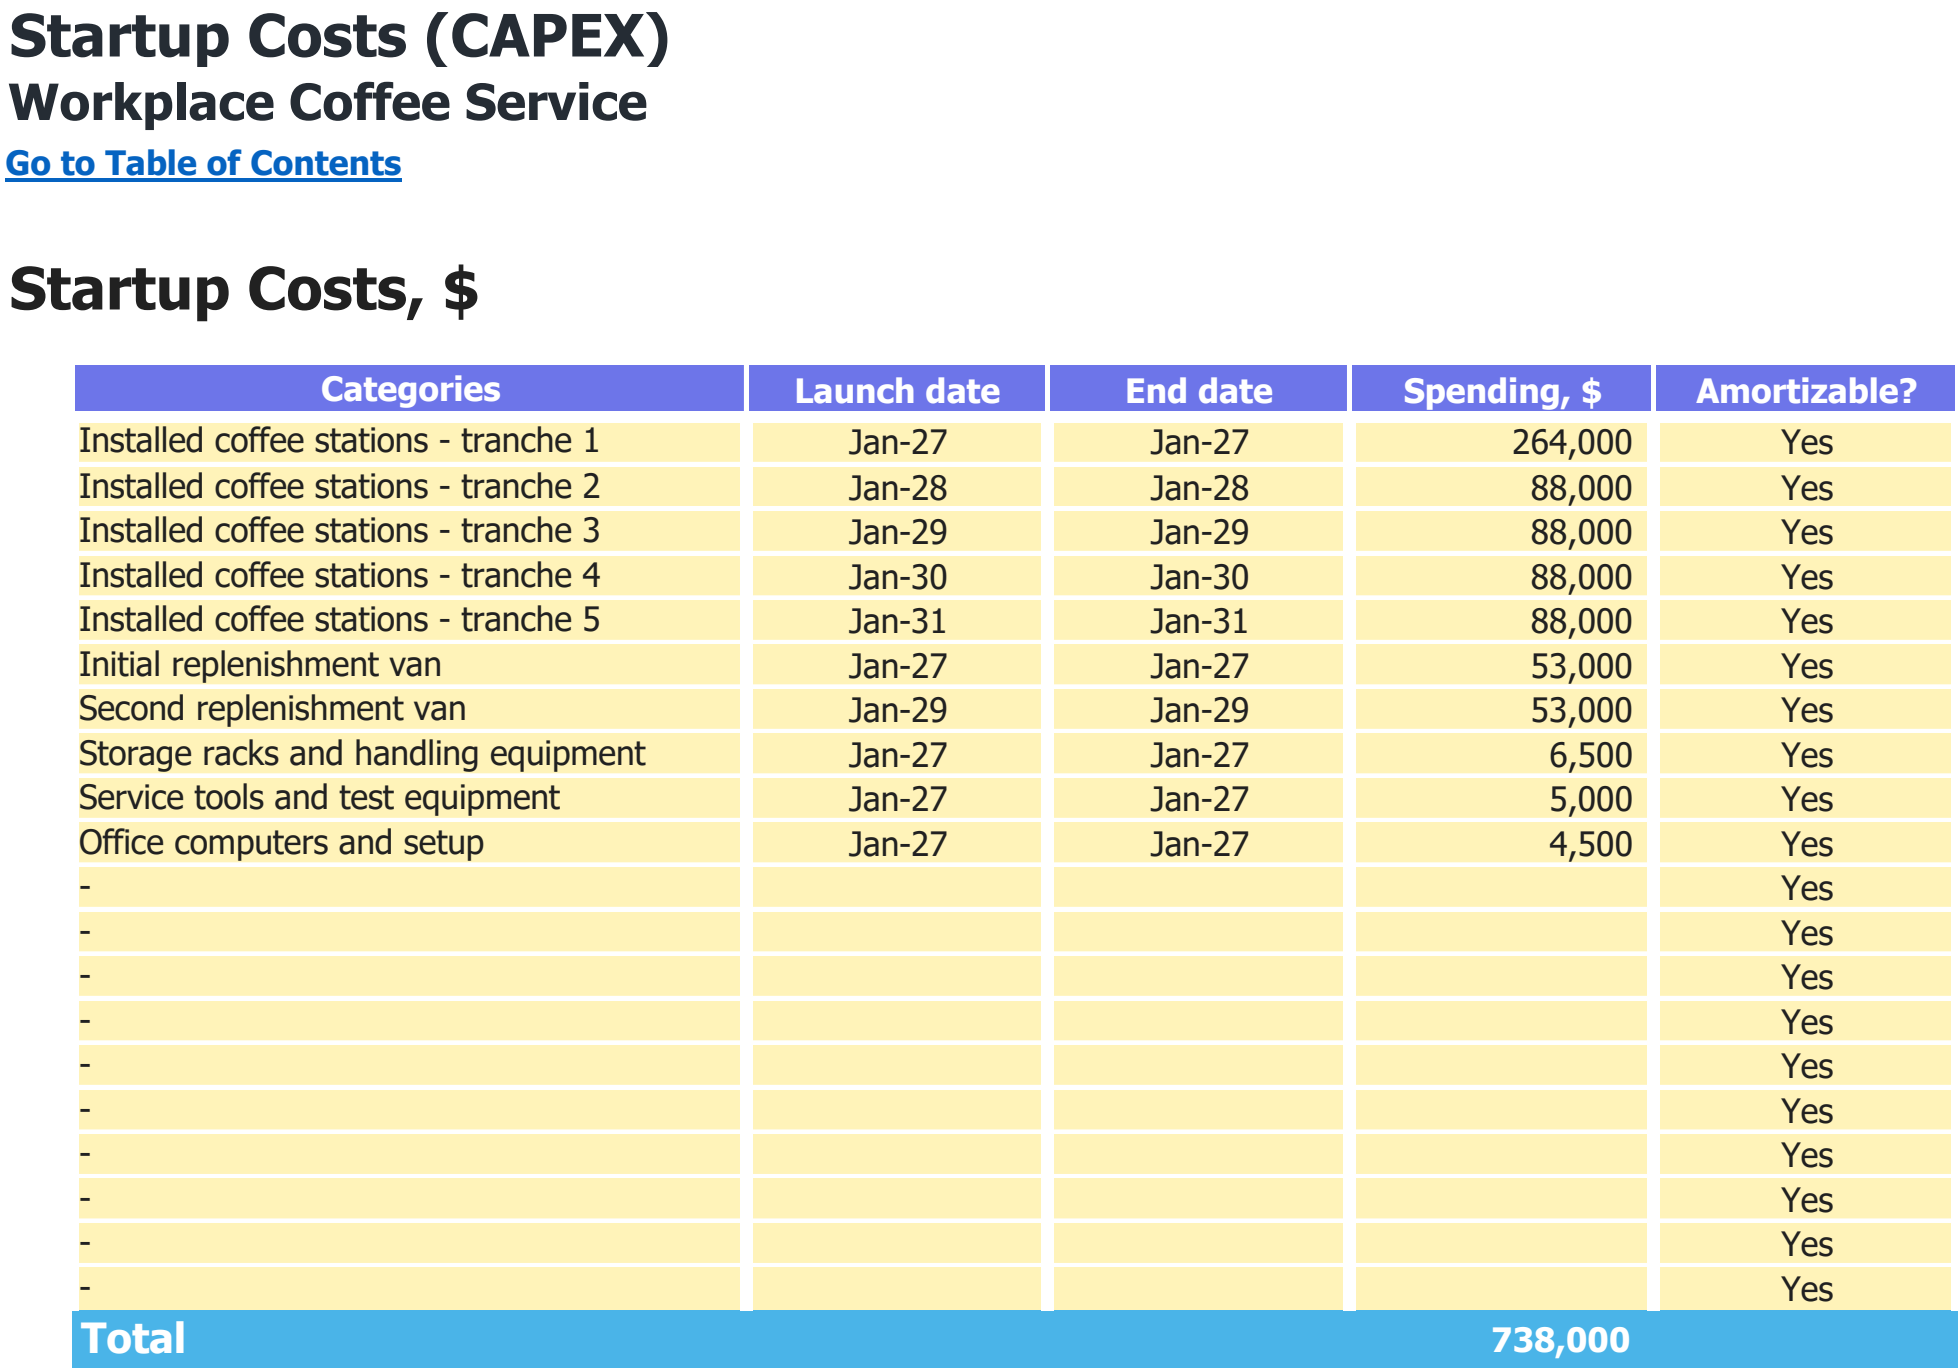
Asset categories, purchase dates and spending assumptions in USD. The total includes every scheduled purchase shown, including later replacements where present.
Enlarge image in a new tab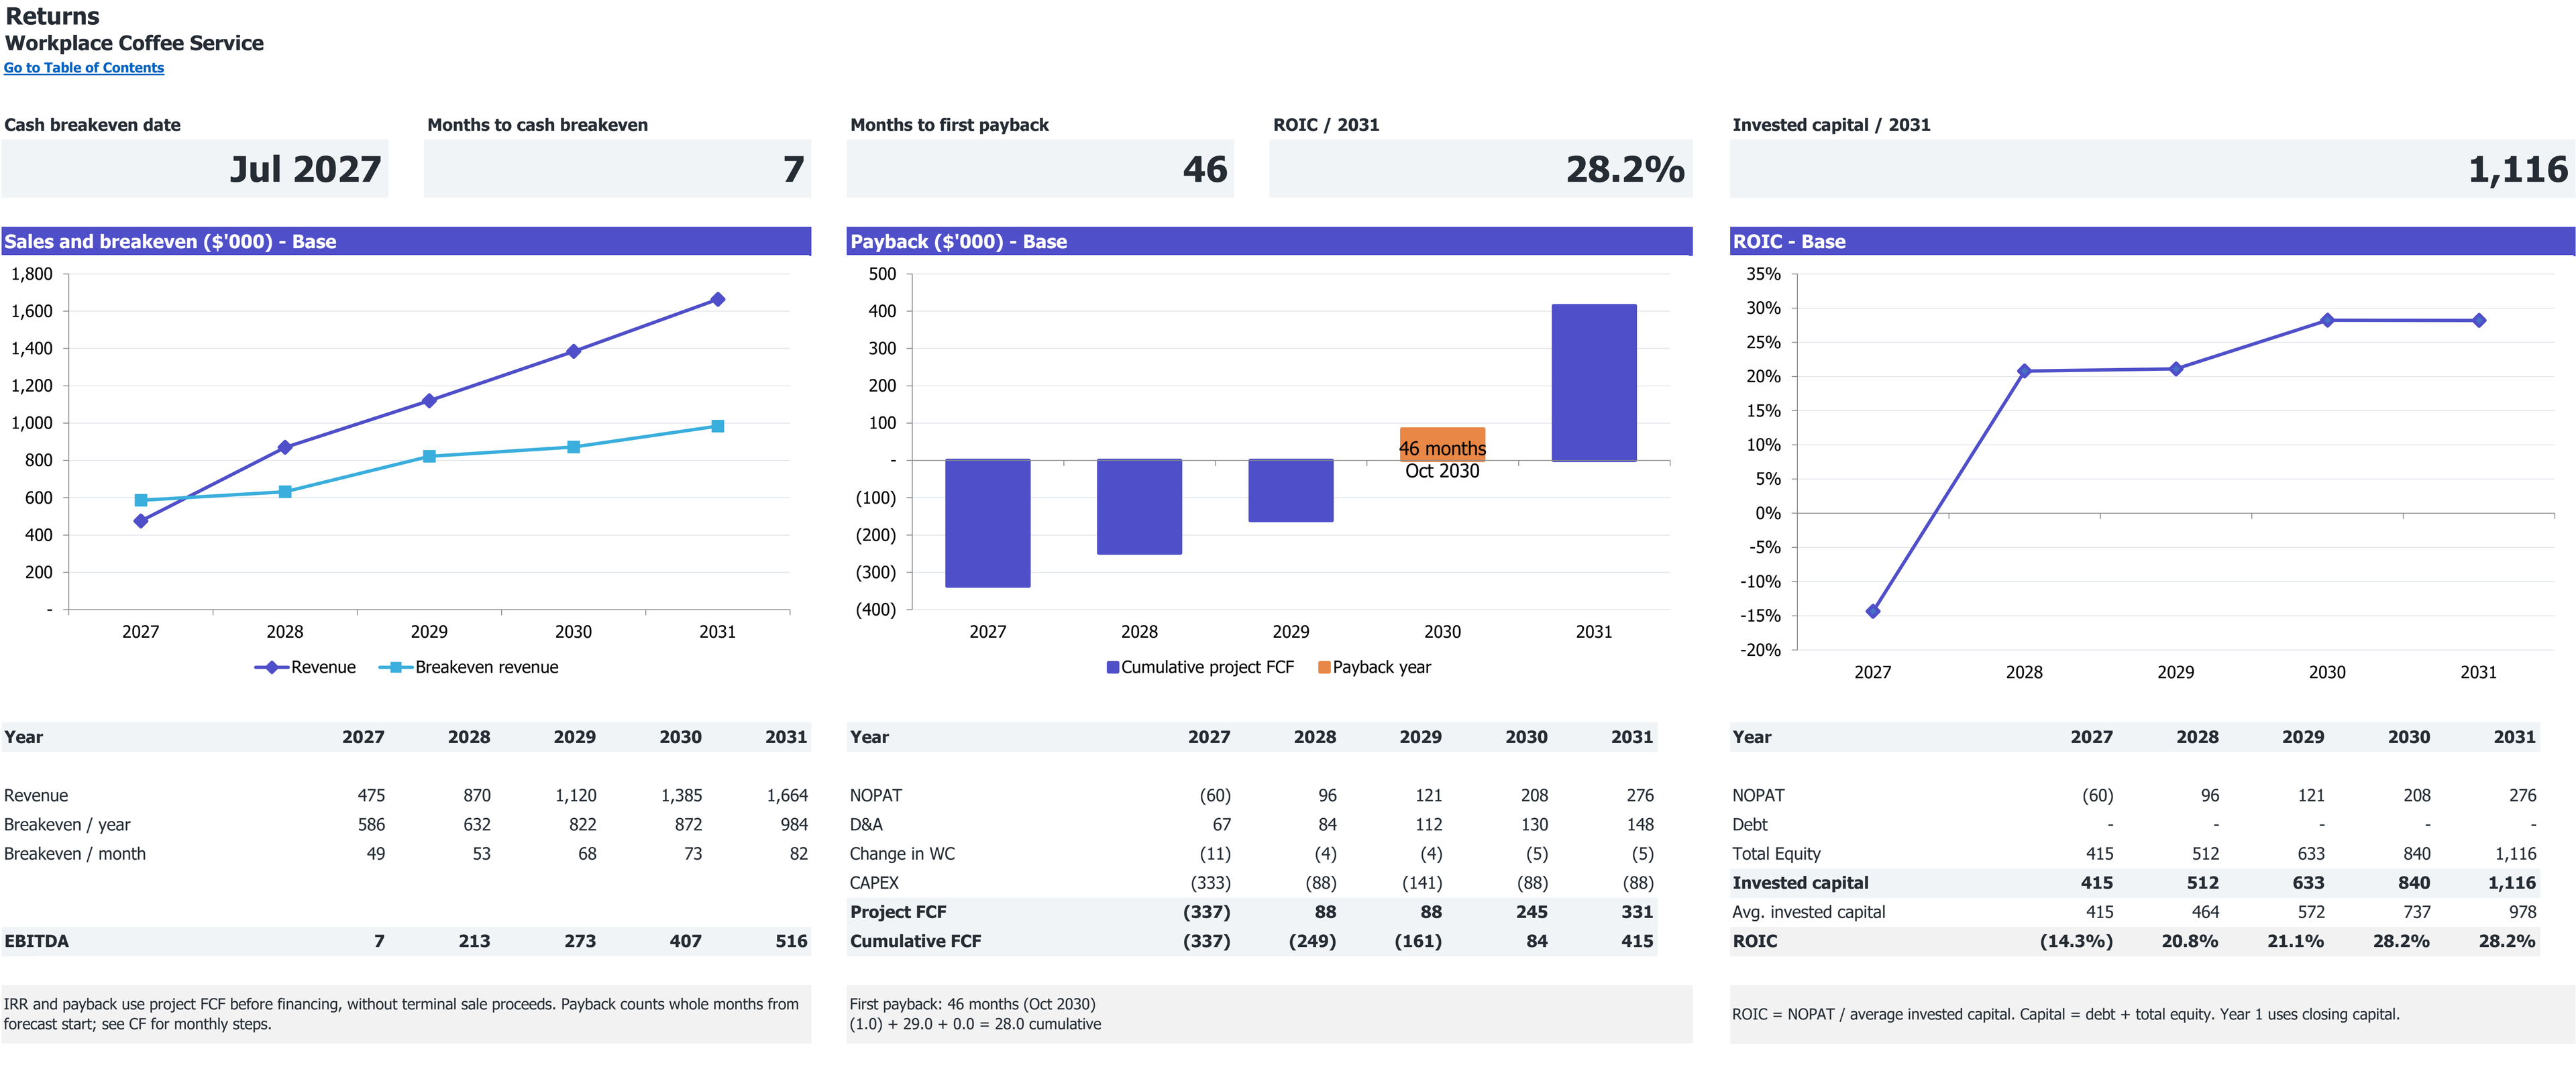
Excerpt from Returns: cumulative project free cash flow and first payback, if reached. 2027–2031 base case; dollar amounts in thousands.
Open full Returns view in a new tabExcerpt from Returns: revenue, annual and monthly break-even revenue, and EBITDA. 2027–2031 base case; dollar amounts in thousands.
Open full Returns view in a new tab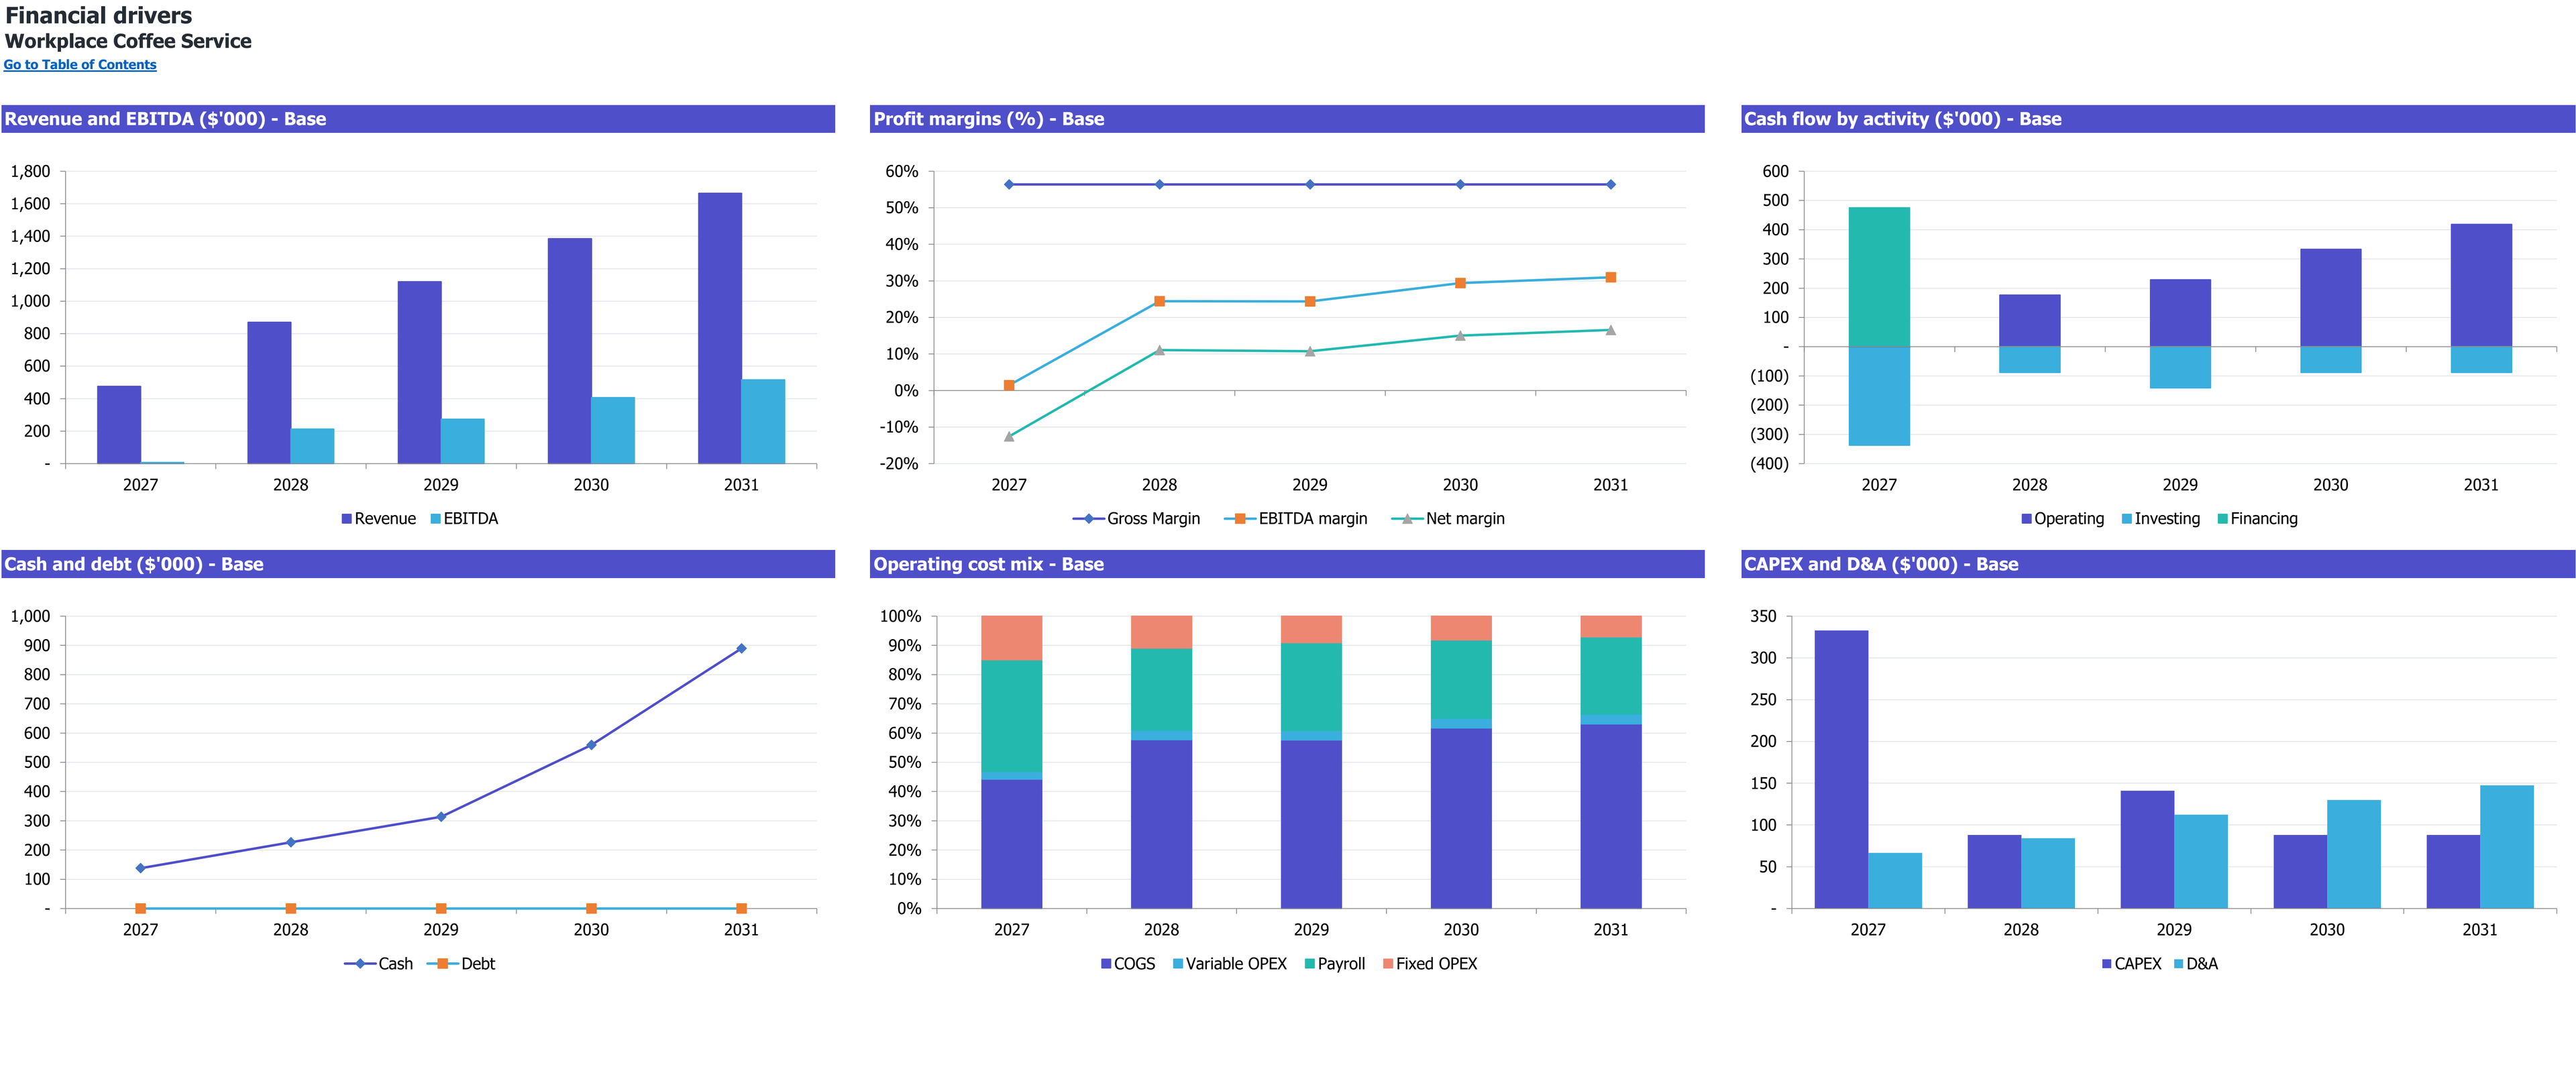
Six annual financial-driver charts for Employer-Paid Workplace Coffee Service, 2027–2031 (Base scenario). Dollar amounts are in thousands; margins and cost mix are percentages.
Enlarge image in a new tab8 selected worksheet views. Figures show this workbook’s starting case.
Workbook availability
What is inside the Excel model
Connect employer contracts to funded automatic stations and paid service routes. Separate employee-based invoices from drink consumption, replenishment work and the cash required for equipment expansion.
Selected worksheets from the documented workbook. Forecast period: January 2027–December 2031. Model reference: PHY002-06.
Inputs you control. Results you can inspect.
On a small screen, scroll within the table to read every column.
| Planning area | Inputs you review | How they connect | Results to inspect |
|---|---|---|---|
| Contract exposure | 24 initial target sites; 50% opening exposure ramping over twelve months. | Limit requested exposure by stations and paid service capacity. | Expected serviced site-months. |
| Billing mix | 60% standard and 40% specialty; 100 employees/site. | Apply eligible employees and the relevant monthly plan price. | Initial blended $22 employee-month invoice. |
| Consumption | 0.8/1.0 drinks per employee-day over 21 workdays. | Calculate supplies with a 200-drink machine-day cap. | 88 baseline drinks per active site-day. |
| Service resources | Two driver visits/site-month and 0.5 technician hour/site-month. | Compare workload with funded productive hours. | Deliverable contracts and route/parts costs. |
| Expansion cash | $333,000 opening CAPEX; $738,000 five-year CAPEX; $475,000 equity. | Include staged stations and a second van in monthly cash needs. | Minimum reserve and project recovery. |
Is this the right model for your business?
Check the starting case before changing the assumptions.
The starting operation
- An operator installing owned automatic stations at employer sites.
- A service business billing per eligible employee-month.
- A planning team evaluating staged equipment and route expansion.
Check the boundary
The case excludes employee-paid cups, retail cafes, leased-in machine subscriptions, customer advances and debt financing.
Compare the other coffee shop typesHow this business makes money
Connect the unit sold to the resources required by this operating case.
Revenue logic
Serviced employer sites are billed monthly for eligible employees under standard and specialty plans.
Employees pay nothing separately; physical drink consumption determines supply use rather than invoice count.
How many employer sites can the business actually service?
Signed demand alone would not set that number. Purchased stations, driver replenishment hours and technician coverage must all support the same portfolio. Equipment expansion can consume cash before its new contracts reach full utilization.
- Installed assets
- Whole purchased station count
- Route workload
- Two visits per active site-month
- Technical support
- 0.5 hour per active site-month
What to establish for your own operation
- Confirm employer willingness to pay the selected premium tiers.
- Test route density and host-side responsibilities.
- Include each expansion tranche in the reserve review.
Follow the plan from demand to cash
Open each section for the assumptions, calculations, and limits of this workbook’s starting case.
Bill the employer while tracking employee consumptionRevenue
The standard plan starts at $20 and specialty at $25 per eligible employee-month. One hundred employees and a 60%/40% mix produce a $2,200 blended monthly site invoice. Employees make no separate drink payment.
Target exposure grows from 24 to 56 sites. Actual serviced exposure is limited by purchased stations, driver hours and technician hours. Fractional site-months represent expected portfolio exposure rather than a fractional machine.
- Disabling one plan does not transfer its demand to the other.
- Included beverage usage is capped by the machine-day limit.
- Demand and premium-price acceptance remain uncontracted planning assumptions.
Separate employer duties from operator servicePayroll
Employers provide power, water, daily cleaning, refilling and host-side milk handling. The operator replenishes stock and performs periodic technical maintenance. Two visits and 0.5 technician hour per active site-month are explicit service assumptions.
Beans, milk, syrup and disposables follow beverage consumption. Paid drivers, technicians, support and owner operations/sales are budgeted separately; the owner’s starting annual salary is $70,000. Usable service hours are 70% of paid hours.
- Supplies do not follow employee counts alone.
- The selected effective employer wage load is 26.5%.
- Route mileage, parts and vehicle insurance are separate costs.
Include the next station purchase in the cash testCAPEX
Launch capital is $333,000, including 24 stations at $11,000 installed each, a van and supporting assets. Eight stations are added at months 13, 25, 37 and 49; a second van arrives in month 25. Five-year purchases total $738,000.
Initial equity is $475,000 with no later financing. The full cash curve includes those later purchases and retains a $60,000 reserve. Minimum cash is $60,746 in January 2028, when the first expansion tranche is purchased.
- Equipment expansion is not funded a second time outside the cash forecast.
- All assets use the preserved five-year book depreciation method.
- Fifteen inventory days are modeled; AR, AP and advances are zero.
Compare launch utilization with expansion recoveryCF
Base 2027 revenue is $475,200 and EBITDA is $6,995, at 18 average serviced site-equivalents. Net income is −$59,605 after depreciation. The first monthly nonnegative EBITDA occurs in July 2027.
Project payback is October 2030, month 46, and remains nonnegative thereafter. It includes all after-tax project cash and staged capital purchases, excluding owner financing and any business sale. No distributions are assumed.
- Year-one static operating break-even is about 17.51 active site-equivalents.
- That threshold changes with prices, mix, salaries and route costs.
- Repeated investment cash-flow sign changes make IRR supplementary to cash and payback.
Selected results from the starting case
Modeled results in USD unless stated otherwise. These describe the selected inputs, not an estimate for your location or a guaranteed outcome.
- 2027 revenue
- $475,200USD, Base; employee-month contracts across 18 average serviced sites.
- 2027 EBITDA
- $6,995USD, Base; paid owner compensation included.
- Opening CAPEX
- $333,000USD in month one; five-year equipment purchases total $738,000.
- Minimum cash
- $60,746USD, funded Base balance in January 2028.
- Project payback
- October 2030 / month 46Cumulative after-tax unlevered project cash, including staged CAPEX; no later reversal.
Make the case your own
Work from the operating plan toward the cash requirement.
Set employee counts, plan mix and expected site exposure.
Validate beverage consumption and employer responsibilities.
Align station purchases with paid driver and technician coverage.
Review staged cash troughs, monthly break-even and project recovery.
Interpretation and scope
- The national analytical plan is not supported by signed employer contracts.
- Fractional exposure does not replace a machine-level deployment schedule.
- Route trials, downtime and actual benefit quotes may materially change capacity or costs.
- Same-month ACH settlement omits month-end receivables.
- The 25% tax allowance has no selected jurisdiction or interyear loss carryforward; severe stress can expose native IRR convergence limits.
The workbook is an Excel file for local planning. Learn how to interpret assumptions and evidence.
Other coffee shop types
Each operating type calls for its own financial structure.
Questions
Do employees pay per drink?
No. The employer pays a monthly charge per eligible employee.
Does every target site earn revenue?
No. Stations and paid service resources limit serviced exposure.
Who handles daily cleaning and milk?
The host employer provides daily cleaning, refilling and host-side milk handling in this case.
Are later station purchases included in funding?
Yes. The cash test includes all $738,000 of five-year capital purchases.
Does payback include a sale of the business?
No. It excludes terminal sale proceeds and owner distributions.
Can I buy this model now?
No. Purchasing and workbook downloads are not available on this site.
Which software does the workbook use?
The documented file is an Excel workbook (.xlsx). Compatibility with other spreadsheet applications is not established by the file extension.
Read the planning guides
Explore the relevant operating questions and how to interpret a workbook’s assumptions.
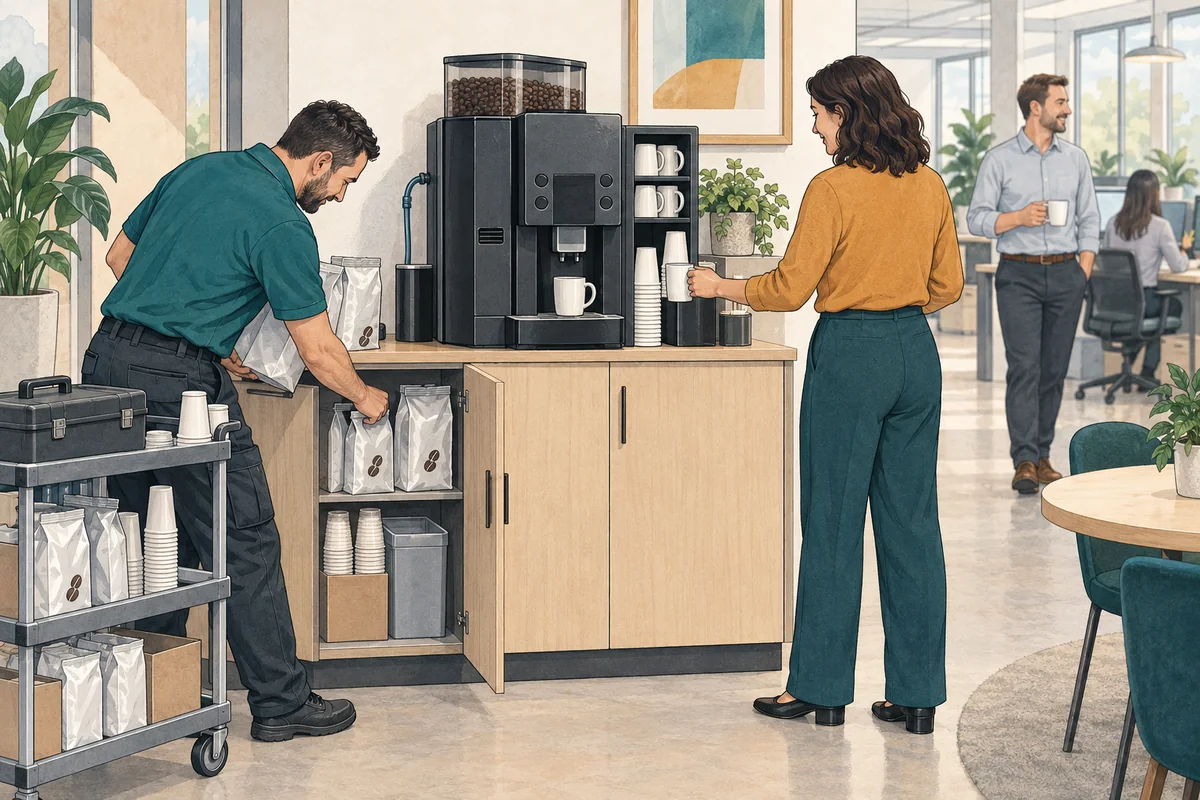
How many employer coffee sites can purchased stations and paid service staff support?
Separate employer invoices from included drink consumption, then compare purchased coffee stations, driver visits, and technician time before expanding a workplace portfolio.
Read the guide
Which coffee business fits your customers and working day?
Compare a seated coffee shop, takeaway kiosk, mobile truck, and employer-paid service by customer, location, daily work, and the evidence each idea needs.
Read the guide
How to read financial assumptions before editing an Excel model
Follow the chain from operating assumptions to calculated results, check units and timing, and keep a useful record of changes to a financial workbook.
Read the guideEvidence and scope
A related category or operator is referenced. Do not interpret the link as independent proof of this exact configuration or its viability.
The links below provide operating-format context; they do not verify the workbook’s selected inputs or calculated returns.
The workbook guide and figures describe model PHY002-06, revision r01, for January 2027–December 2031. These are a documented planning case, not observed results for a particular business.