
Coffee Shop Financial Model: Drive-Through Coffee Shop
Plan beverage-only drive-through sales with peak vehicle demand, paid order-taking, preparation, handover and site investment.
- Excel (.xlsx)
- Kiosk: 664 sq ft / one lane / two espresso groups
- Service: Twelve hours daily / all seven weekdays
- Opening: March 2027 after two preopening months
Planning several types? Compare 8 coffee shop formats
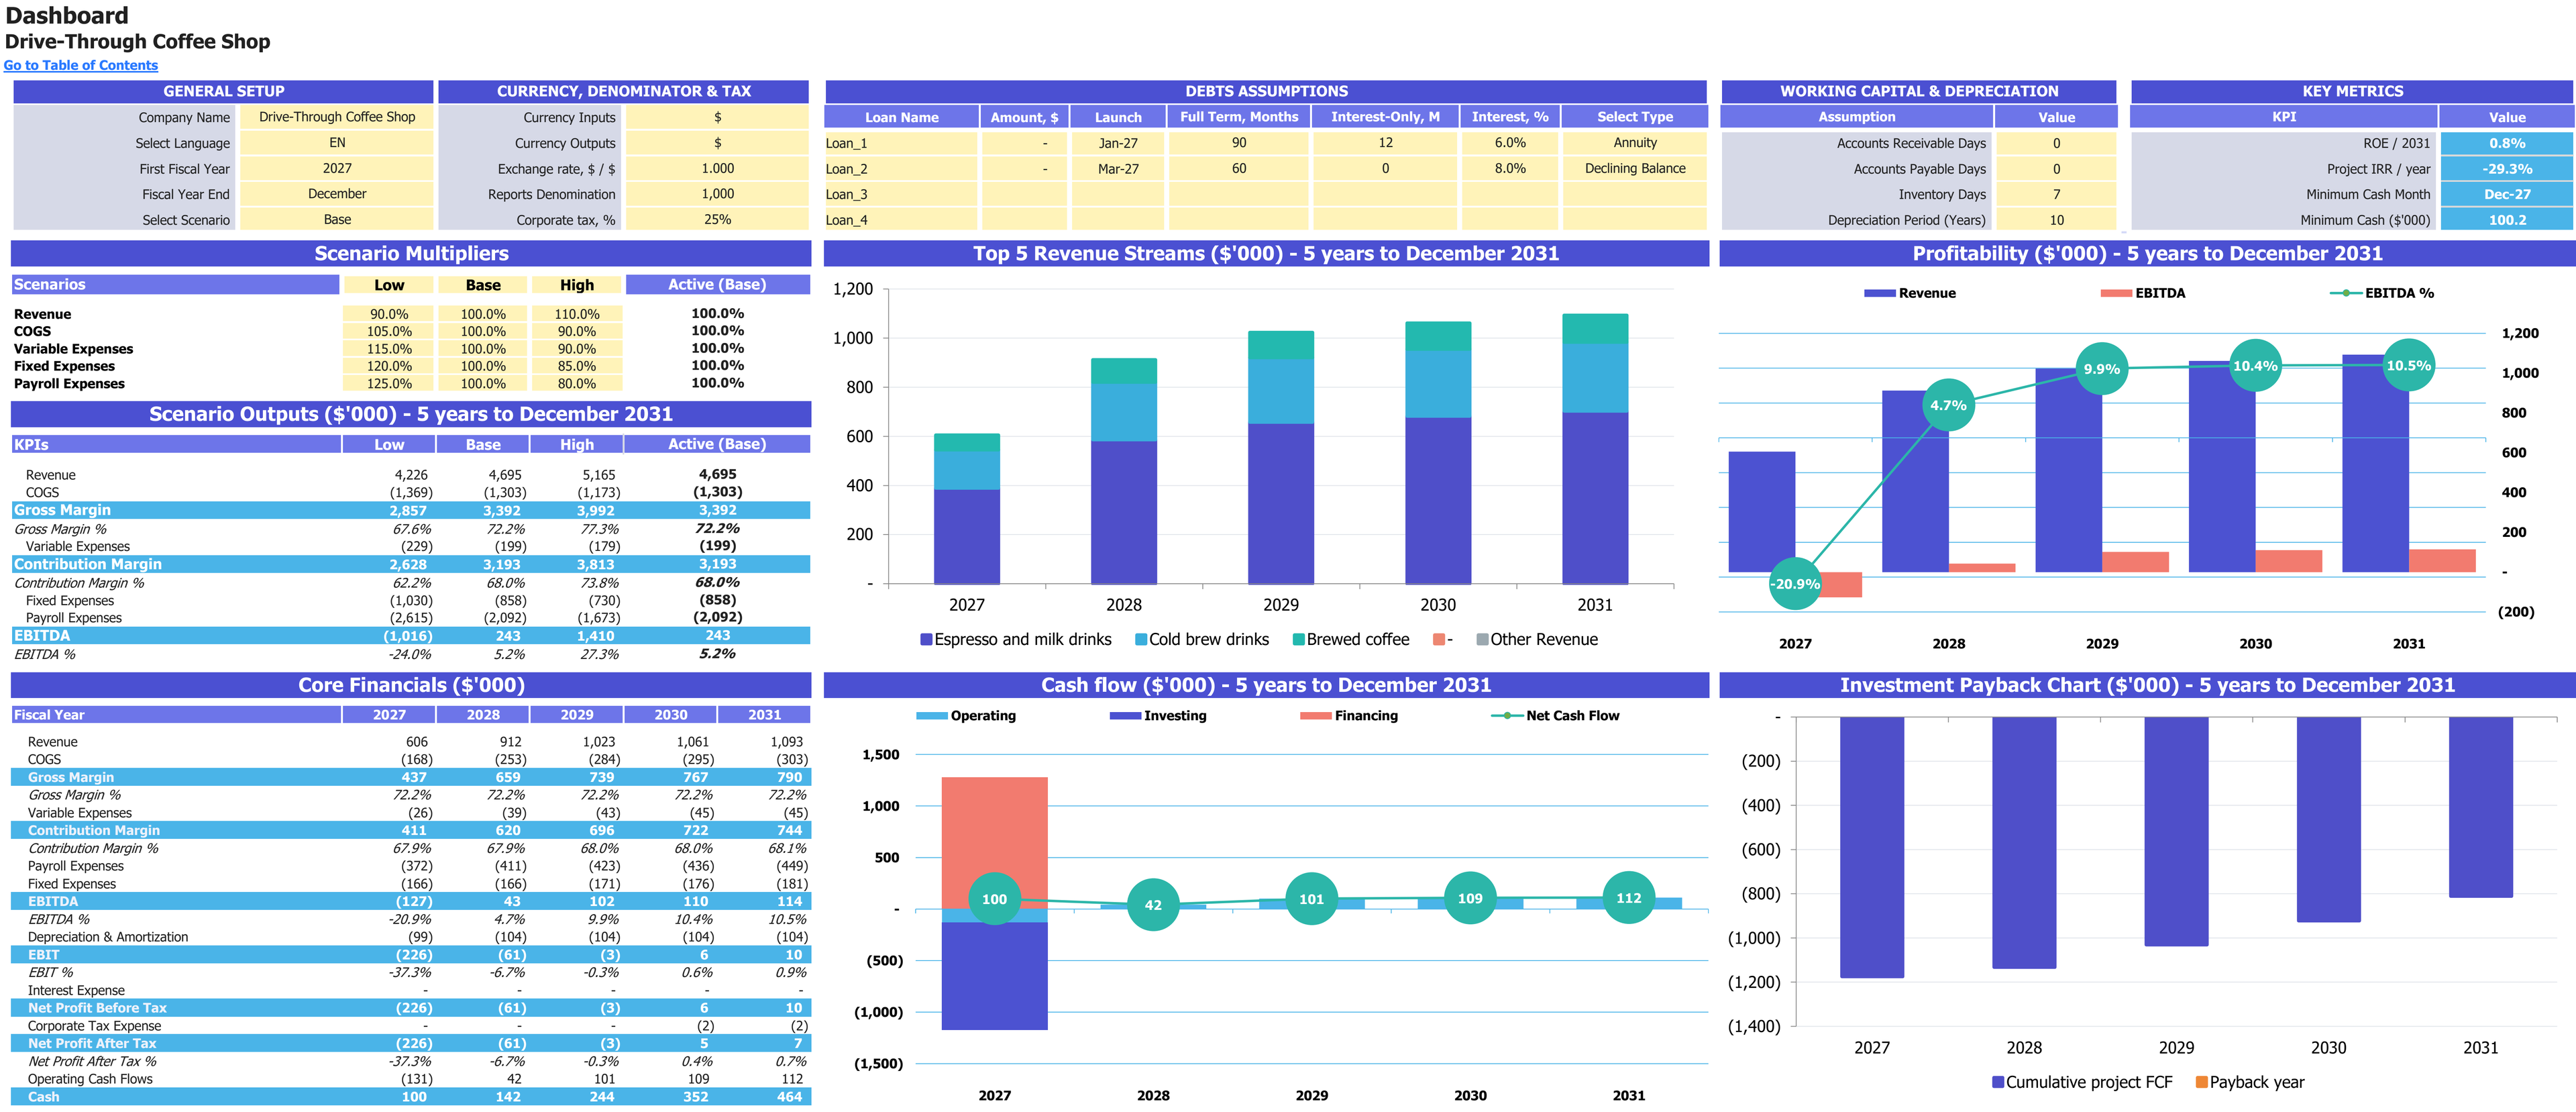
Base-case scenario controls, annual financial results and charts for 2027–2031. Financial report amounts are shown in thousands of USD; percentage measures retain their own units.
Enlarge image in a new tab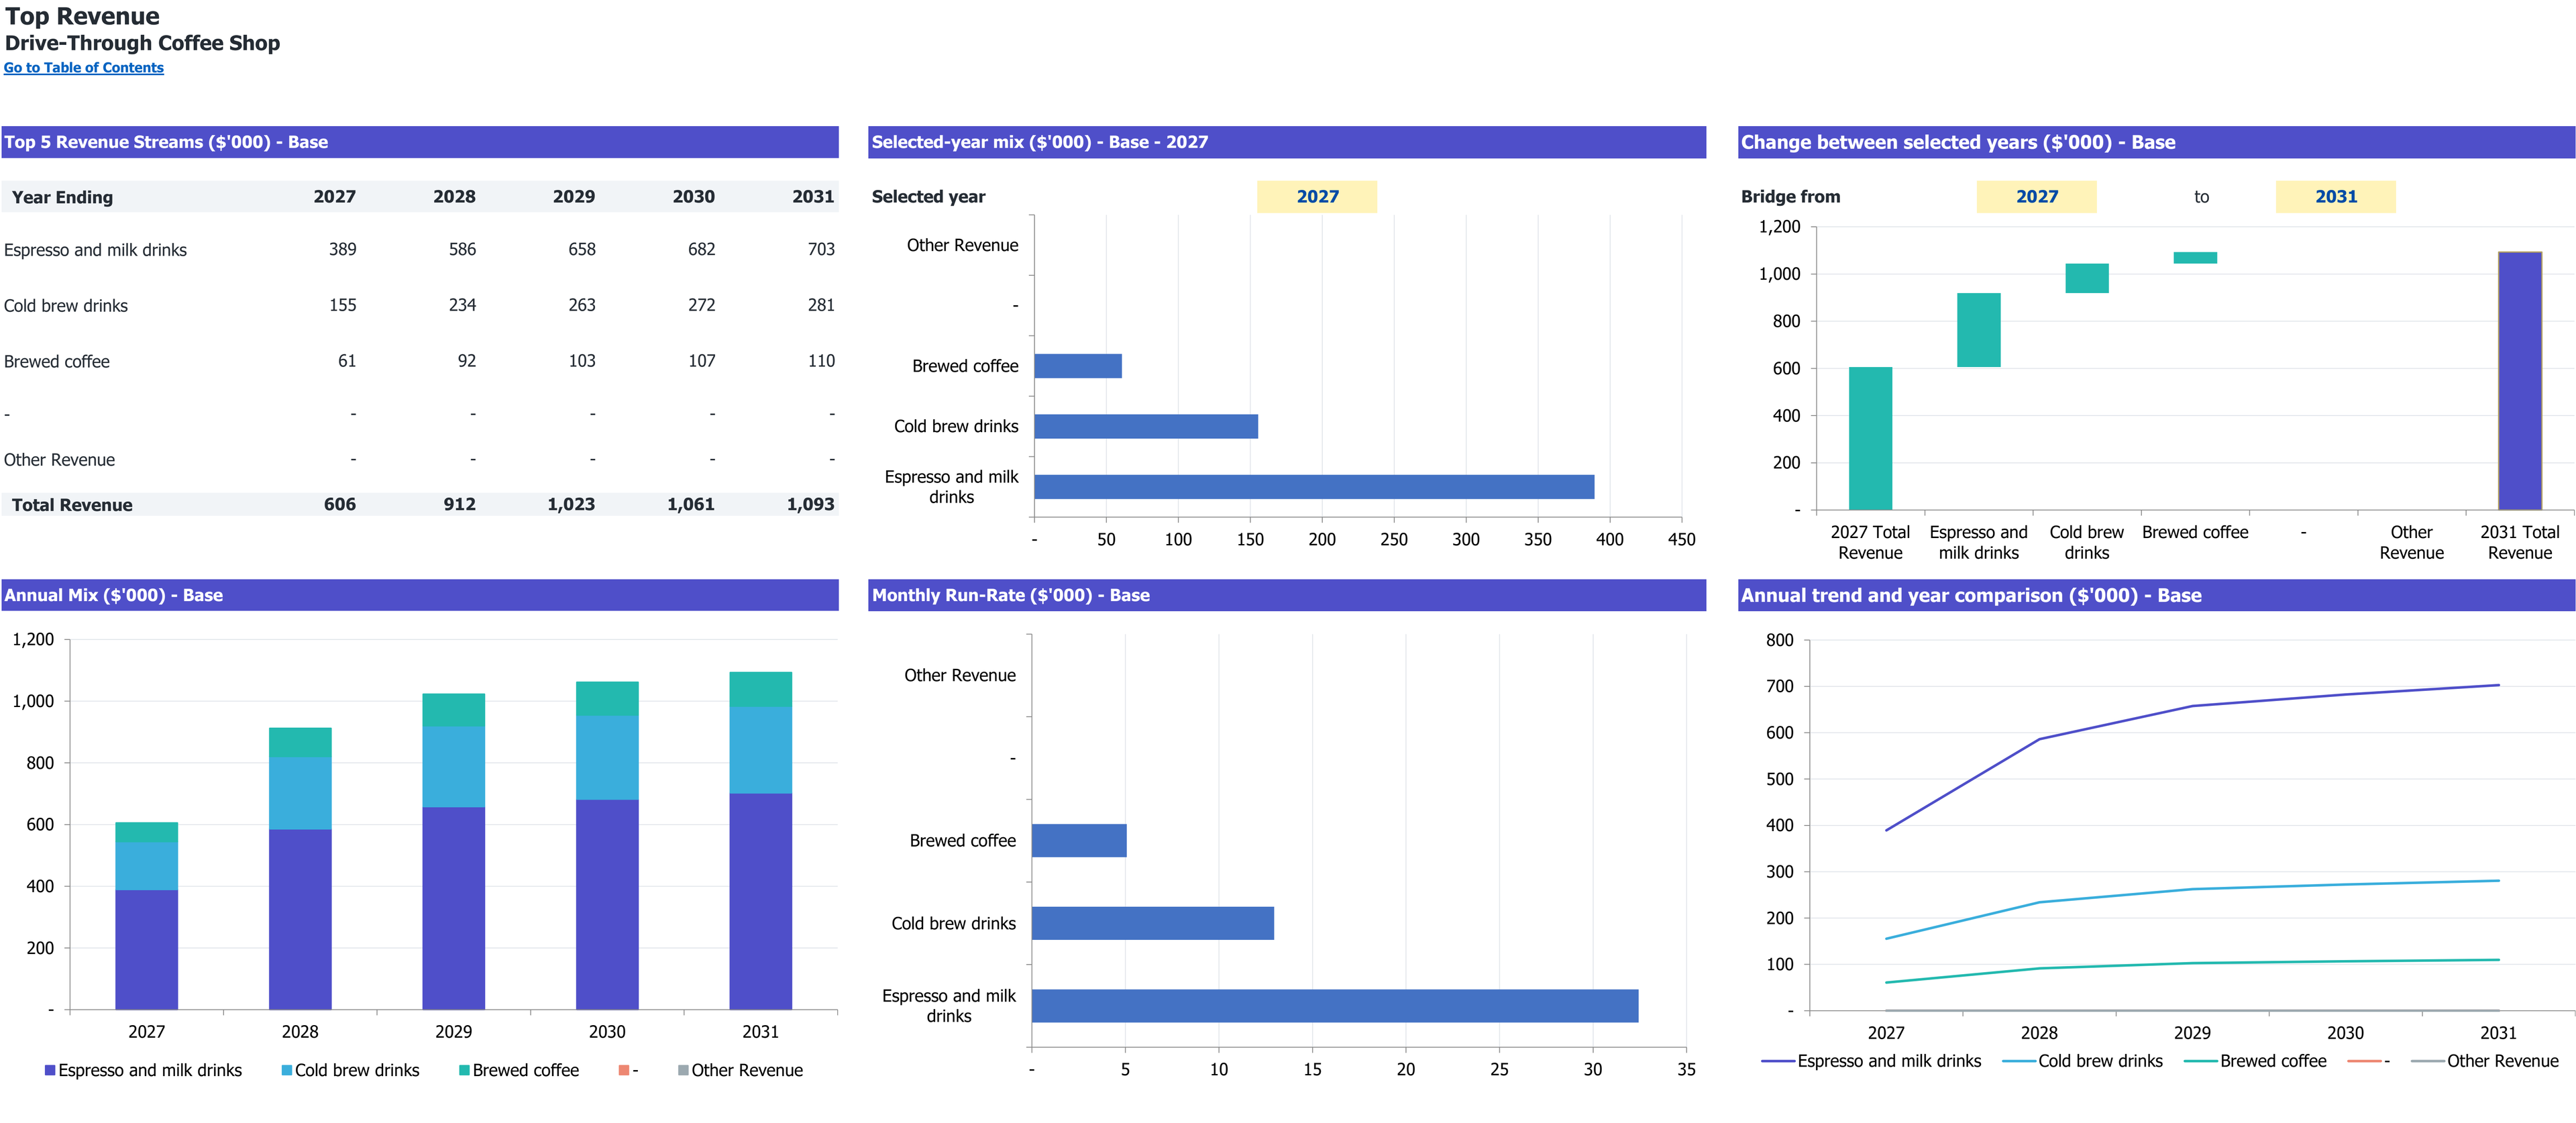
Revenue summary for 2027–2031 and selected-year comparison, in thousands of USD.
Enlarge image in a new tab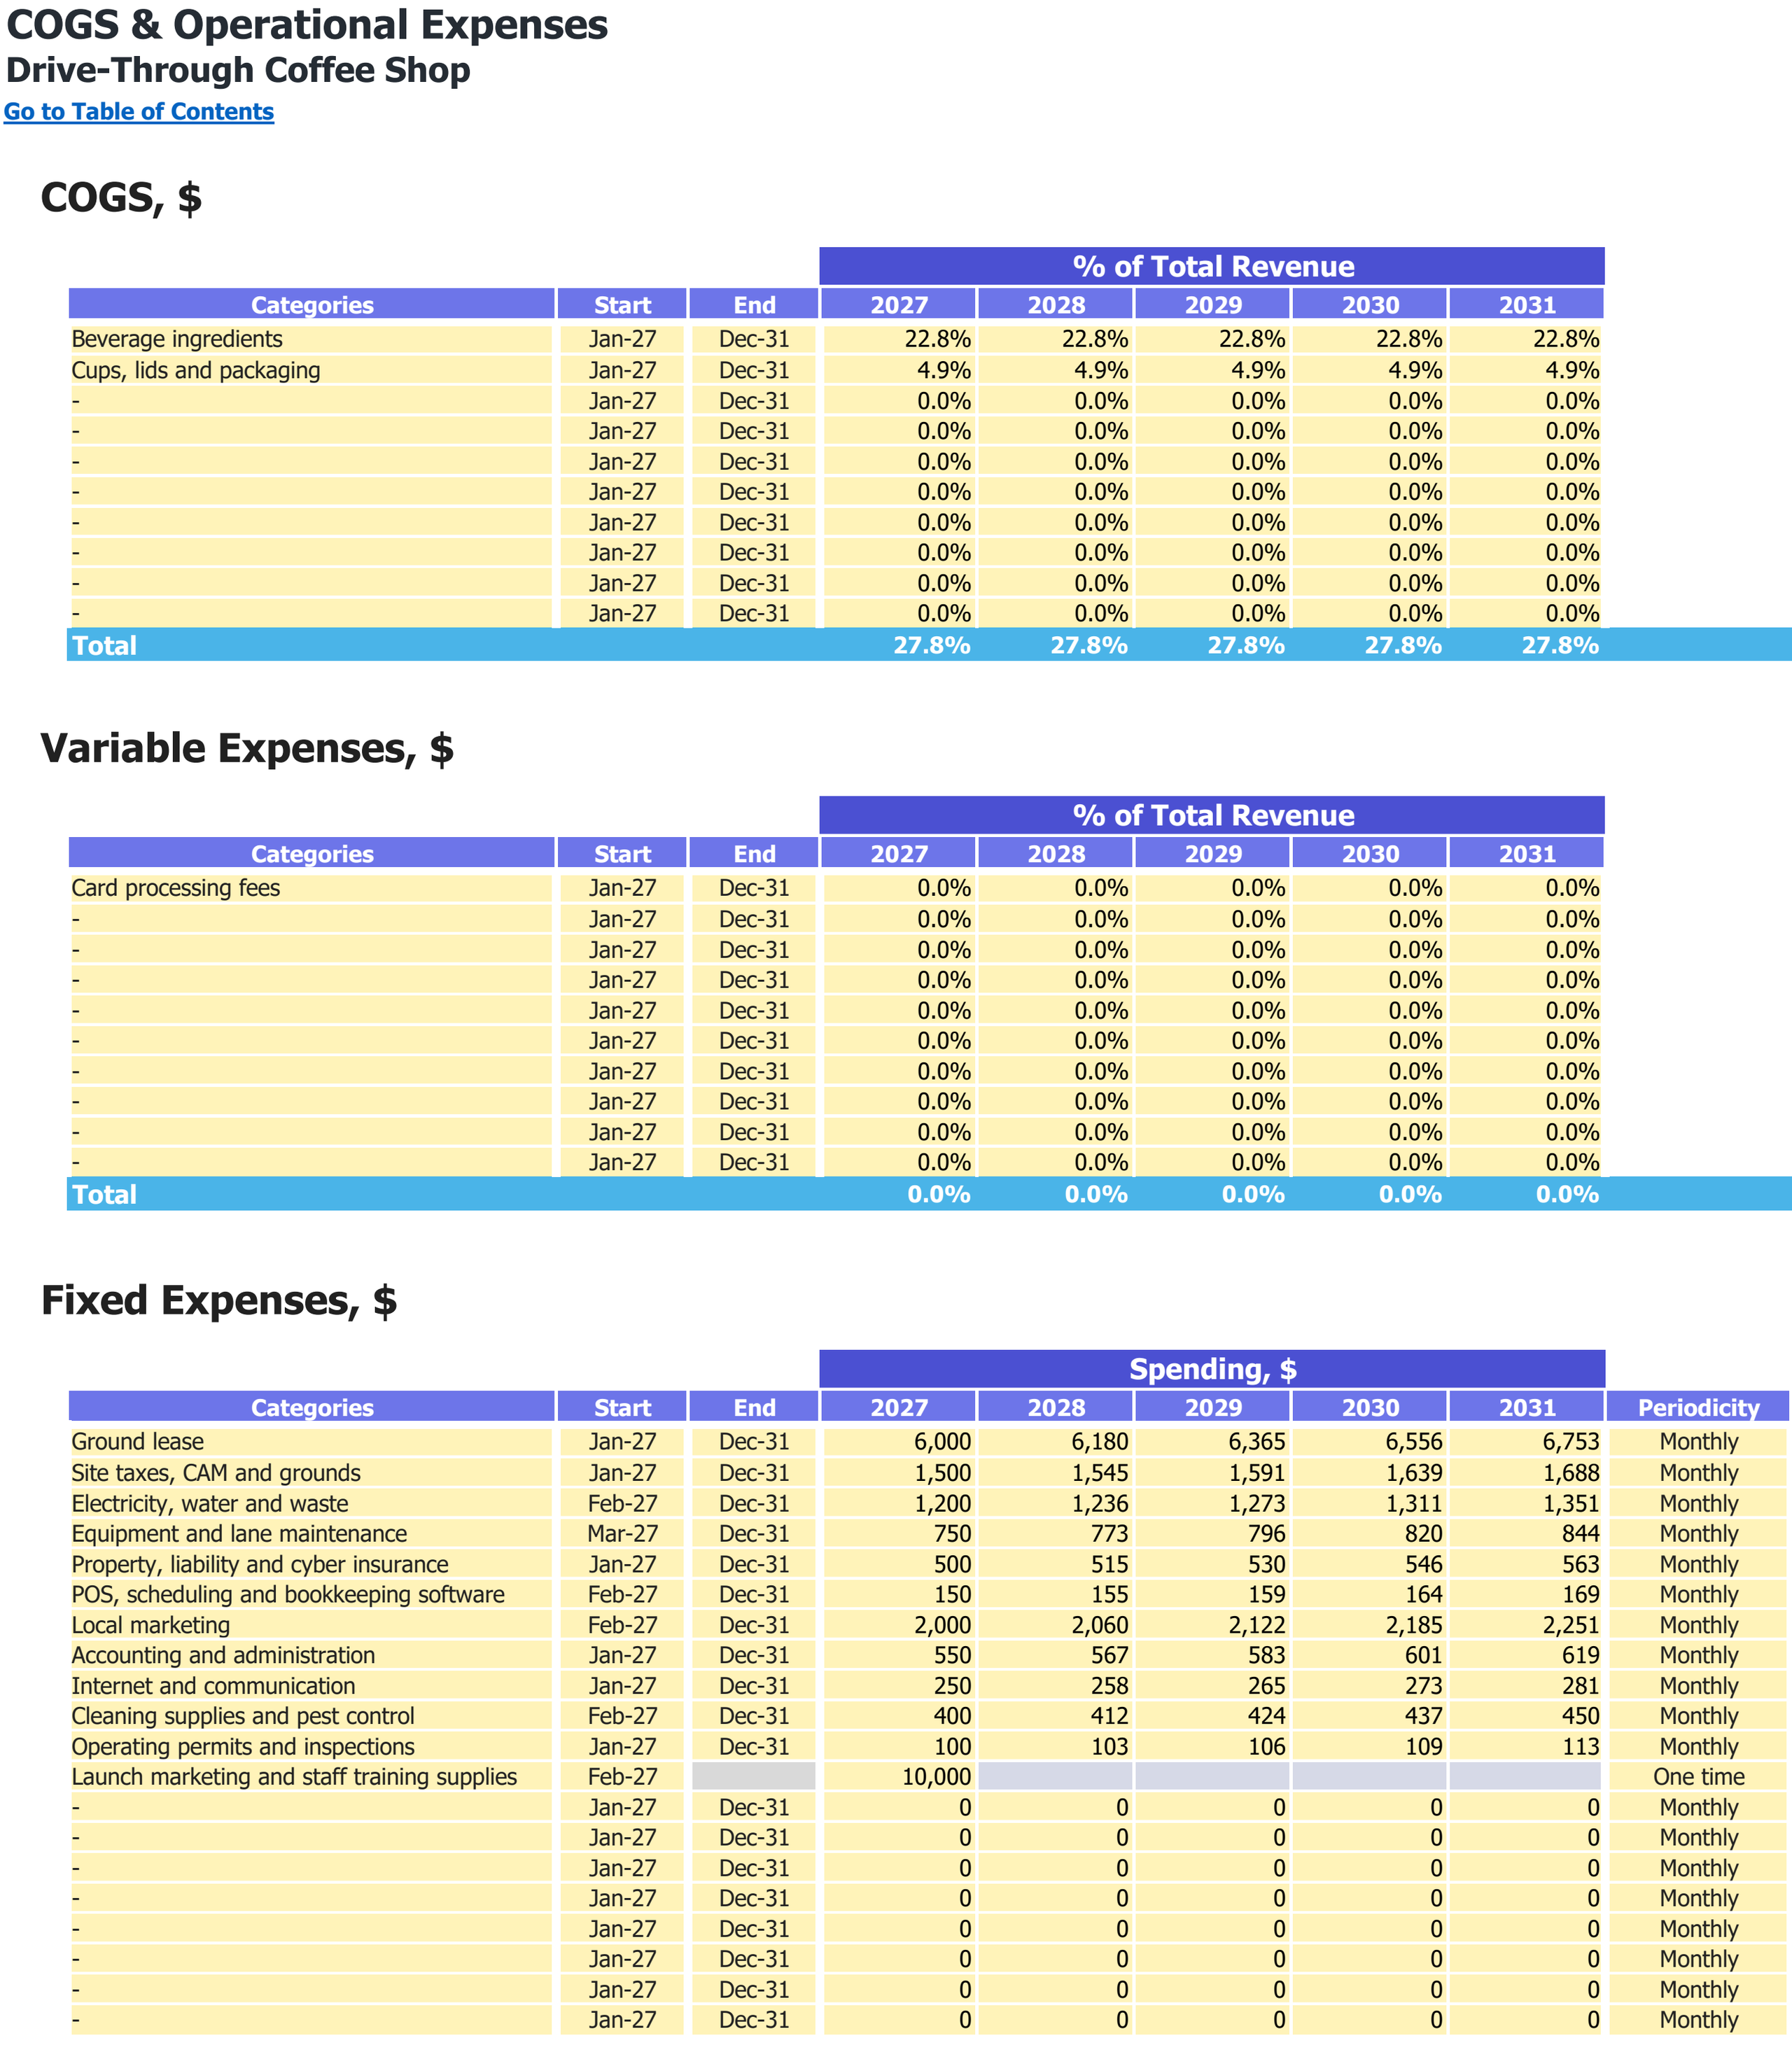
Food and other direct-cost categories, variable expense shares and fixed operating expenses. Monetary inputs are USD; the annual percentage columns are cost shares of revenue.
Enlarge image in a new tab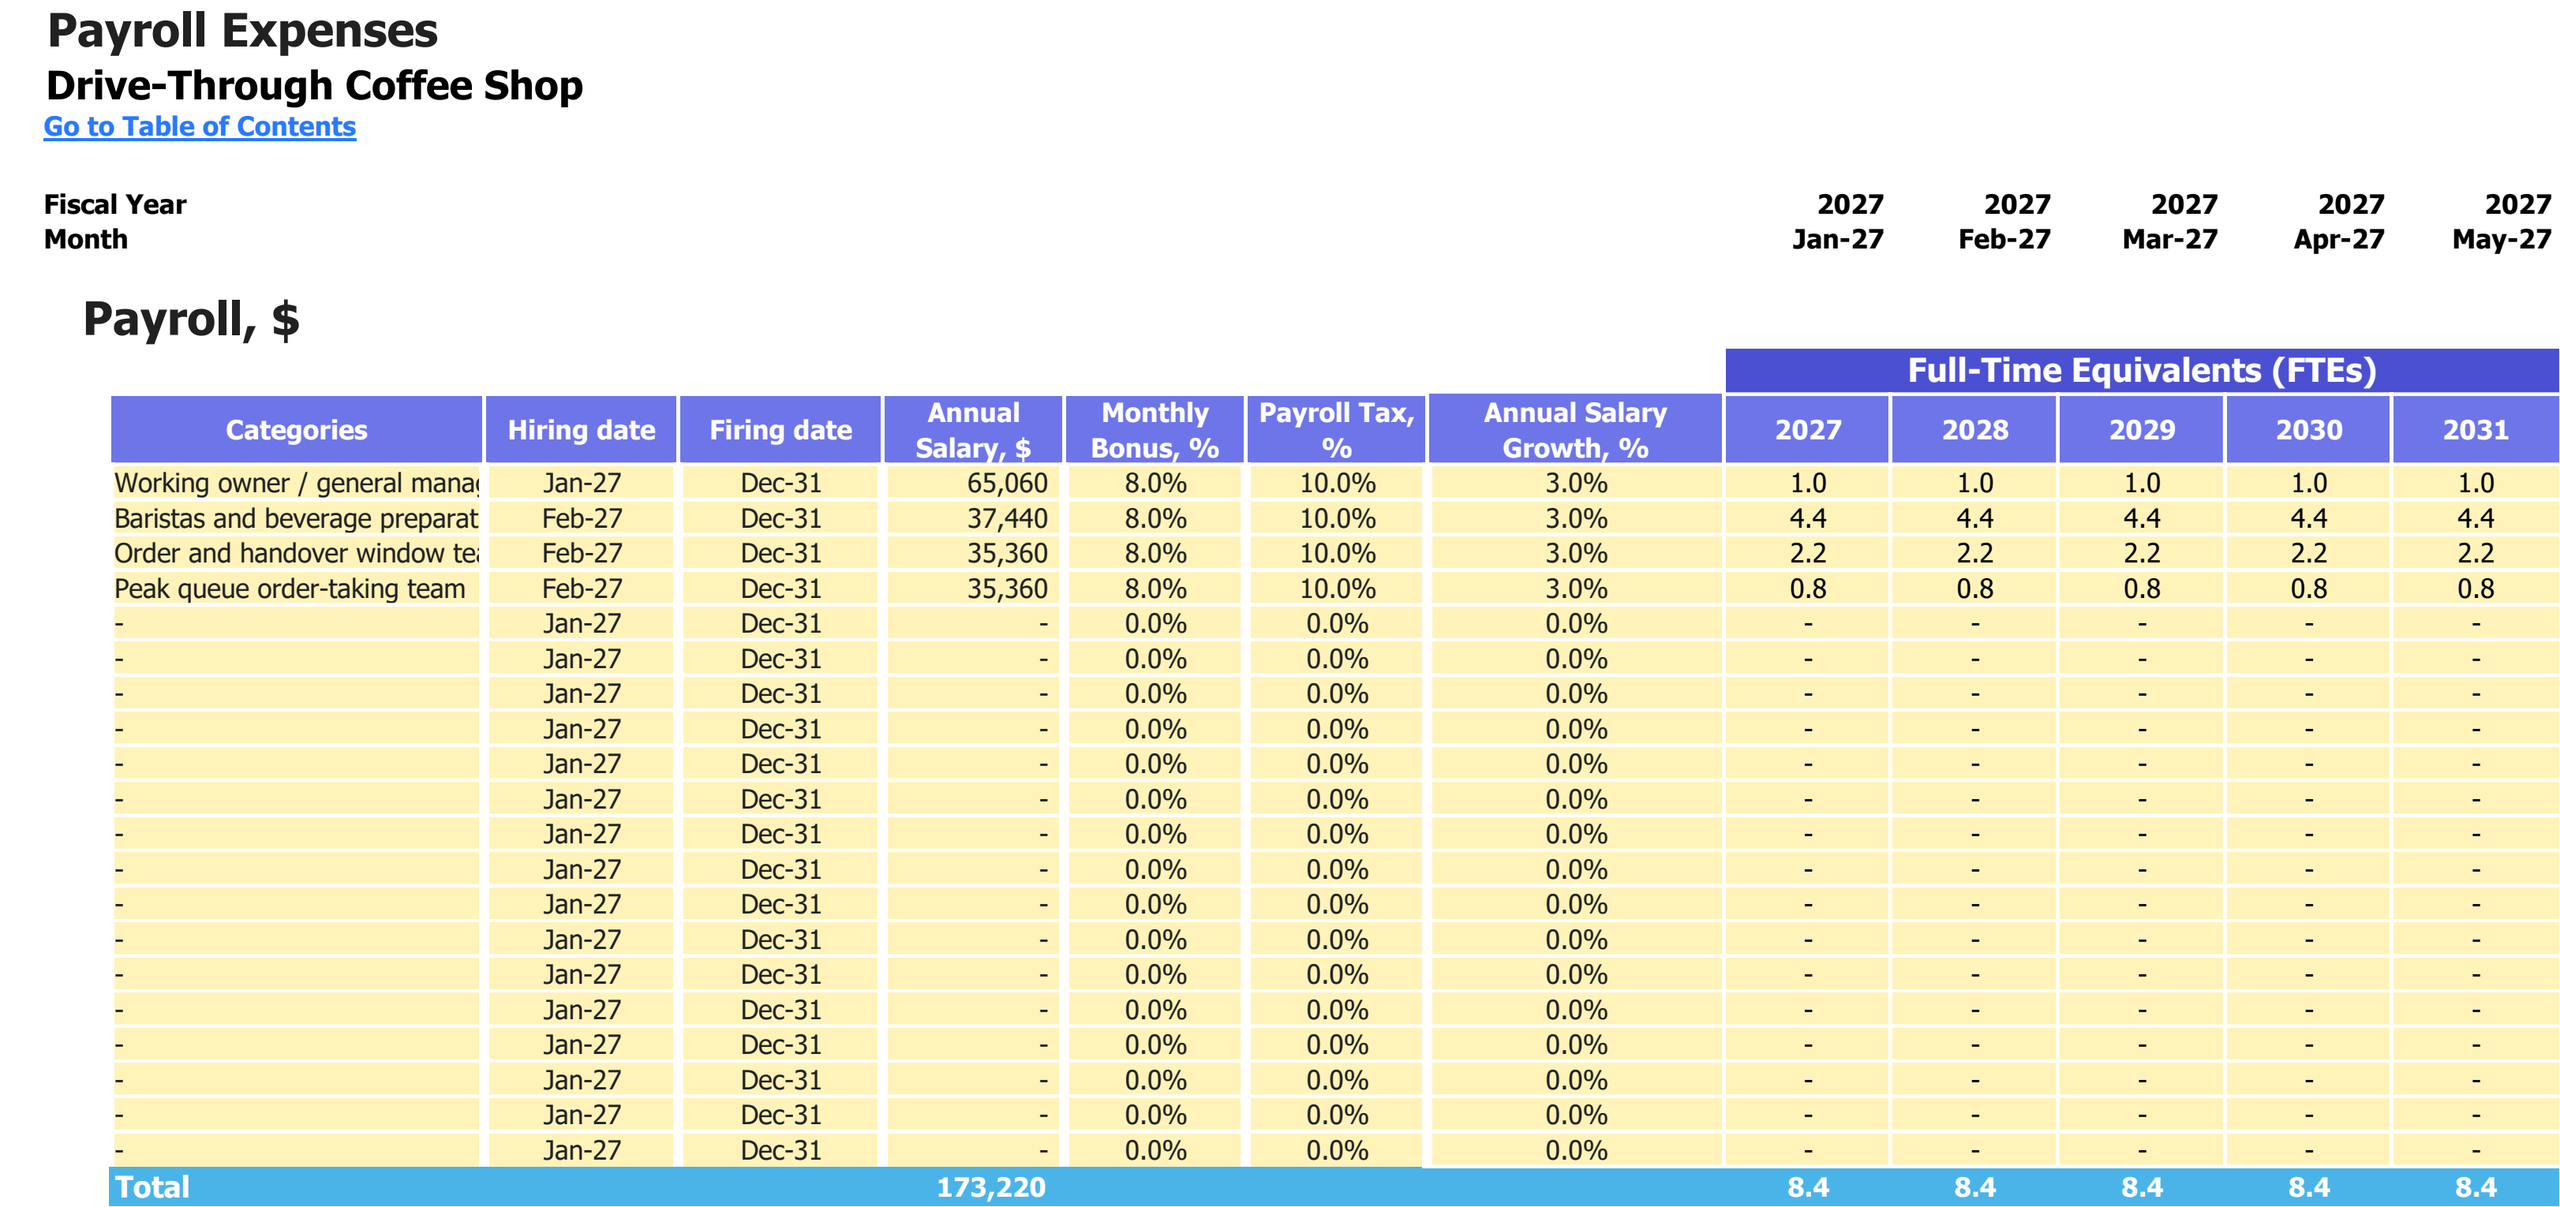
Paid roles, annual salary and employer-load assumptions, with staffing in full-time equivalents for 2027–2031. Salary amounts are USD; percentages and FTEs are labelled separately.
Enlarge image in a new tab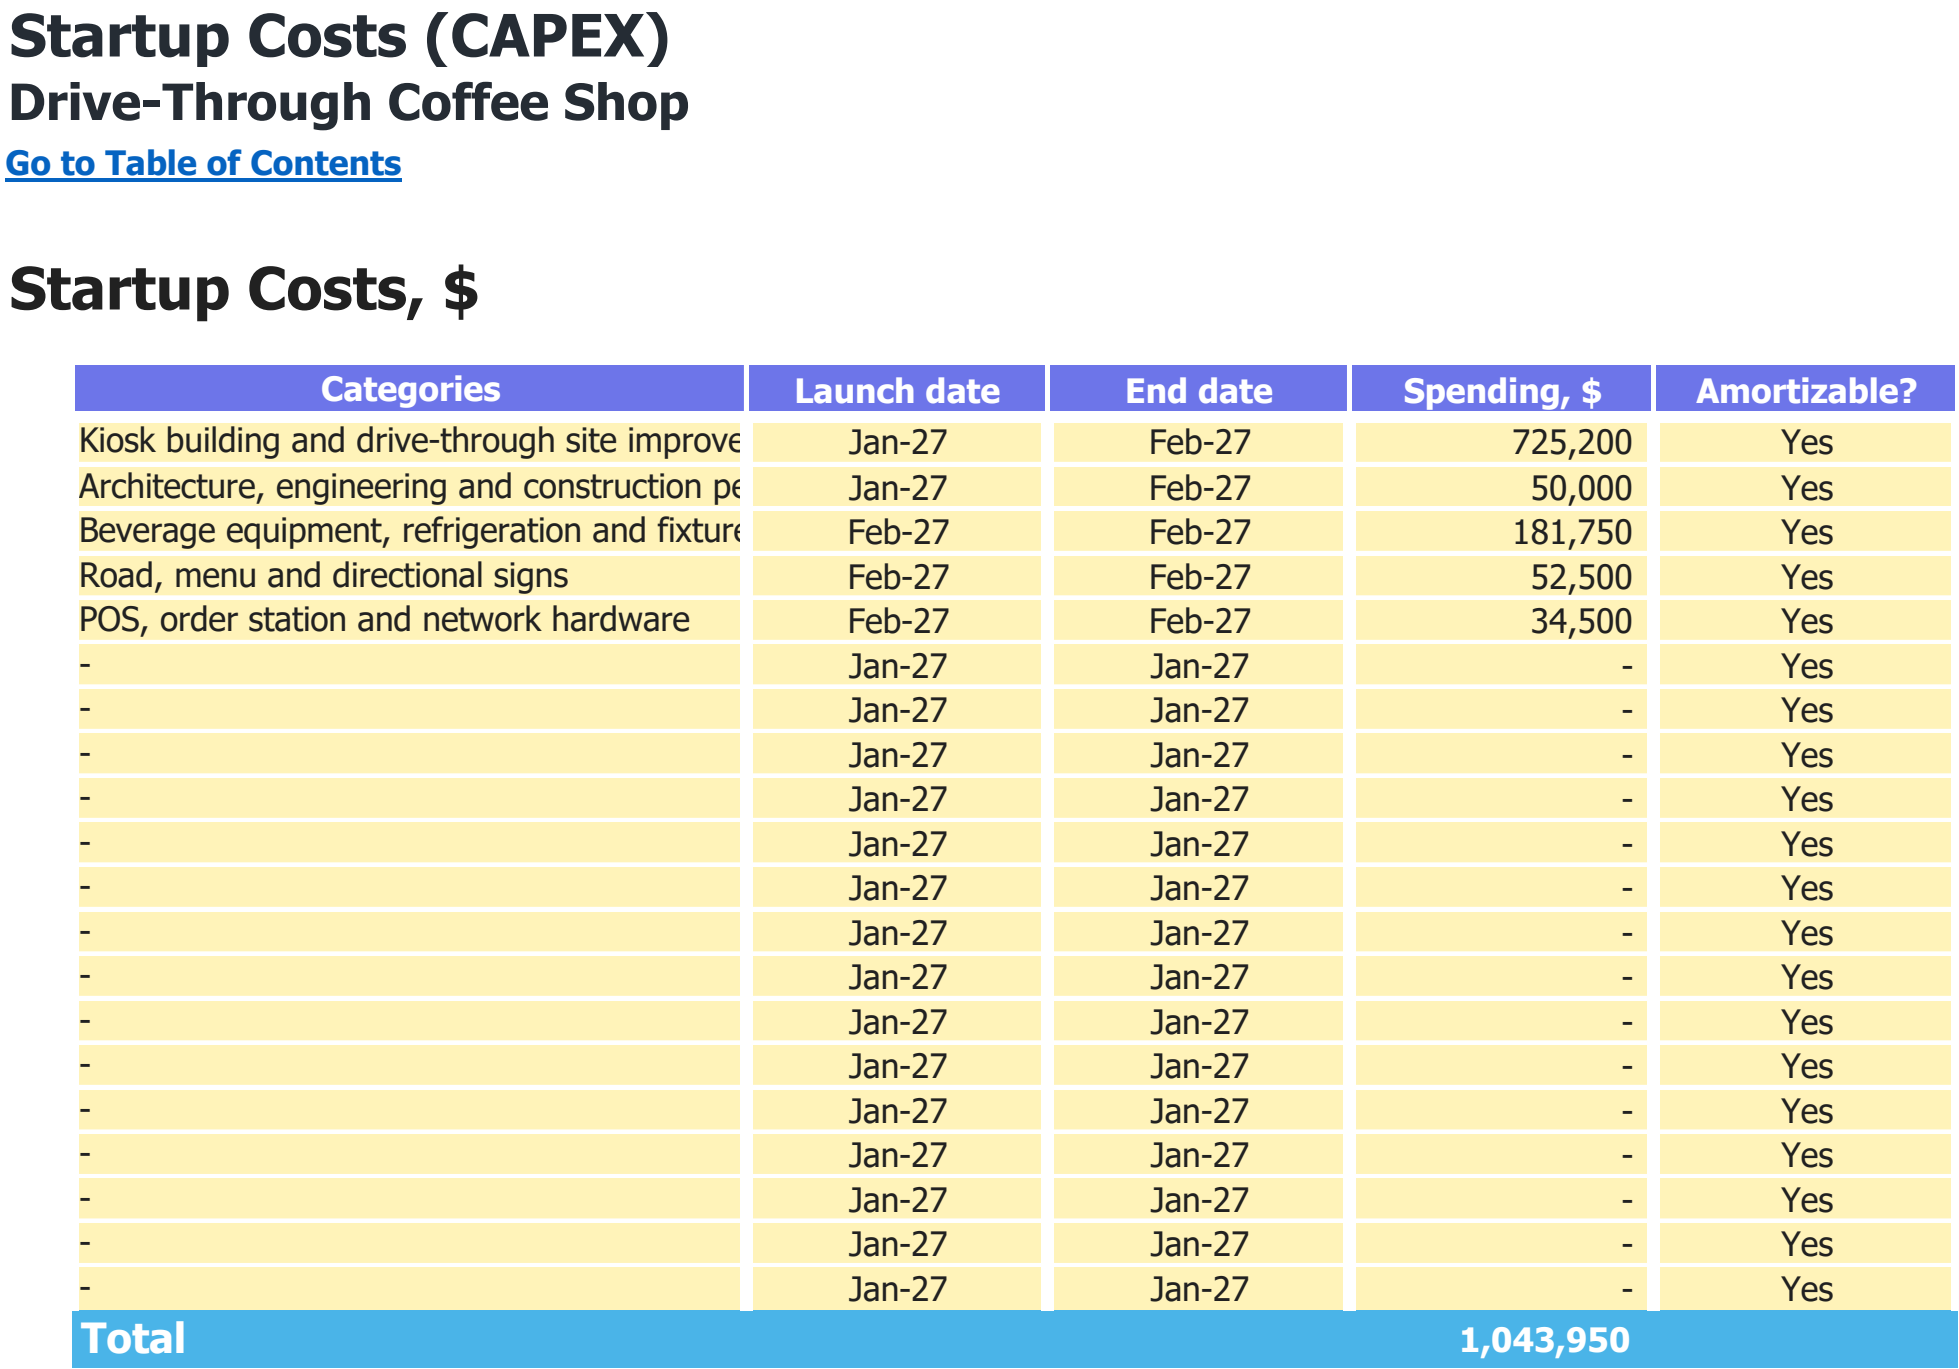
Asset categories, purchase dates and spending assumptions in USD. The total includes every scheduled purchase shown, including later replacements where present.
Enlarge image in a new tab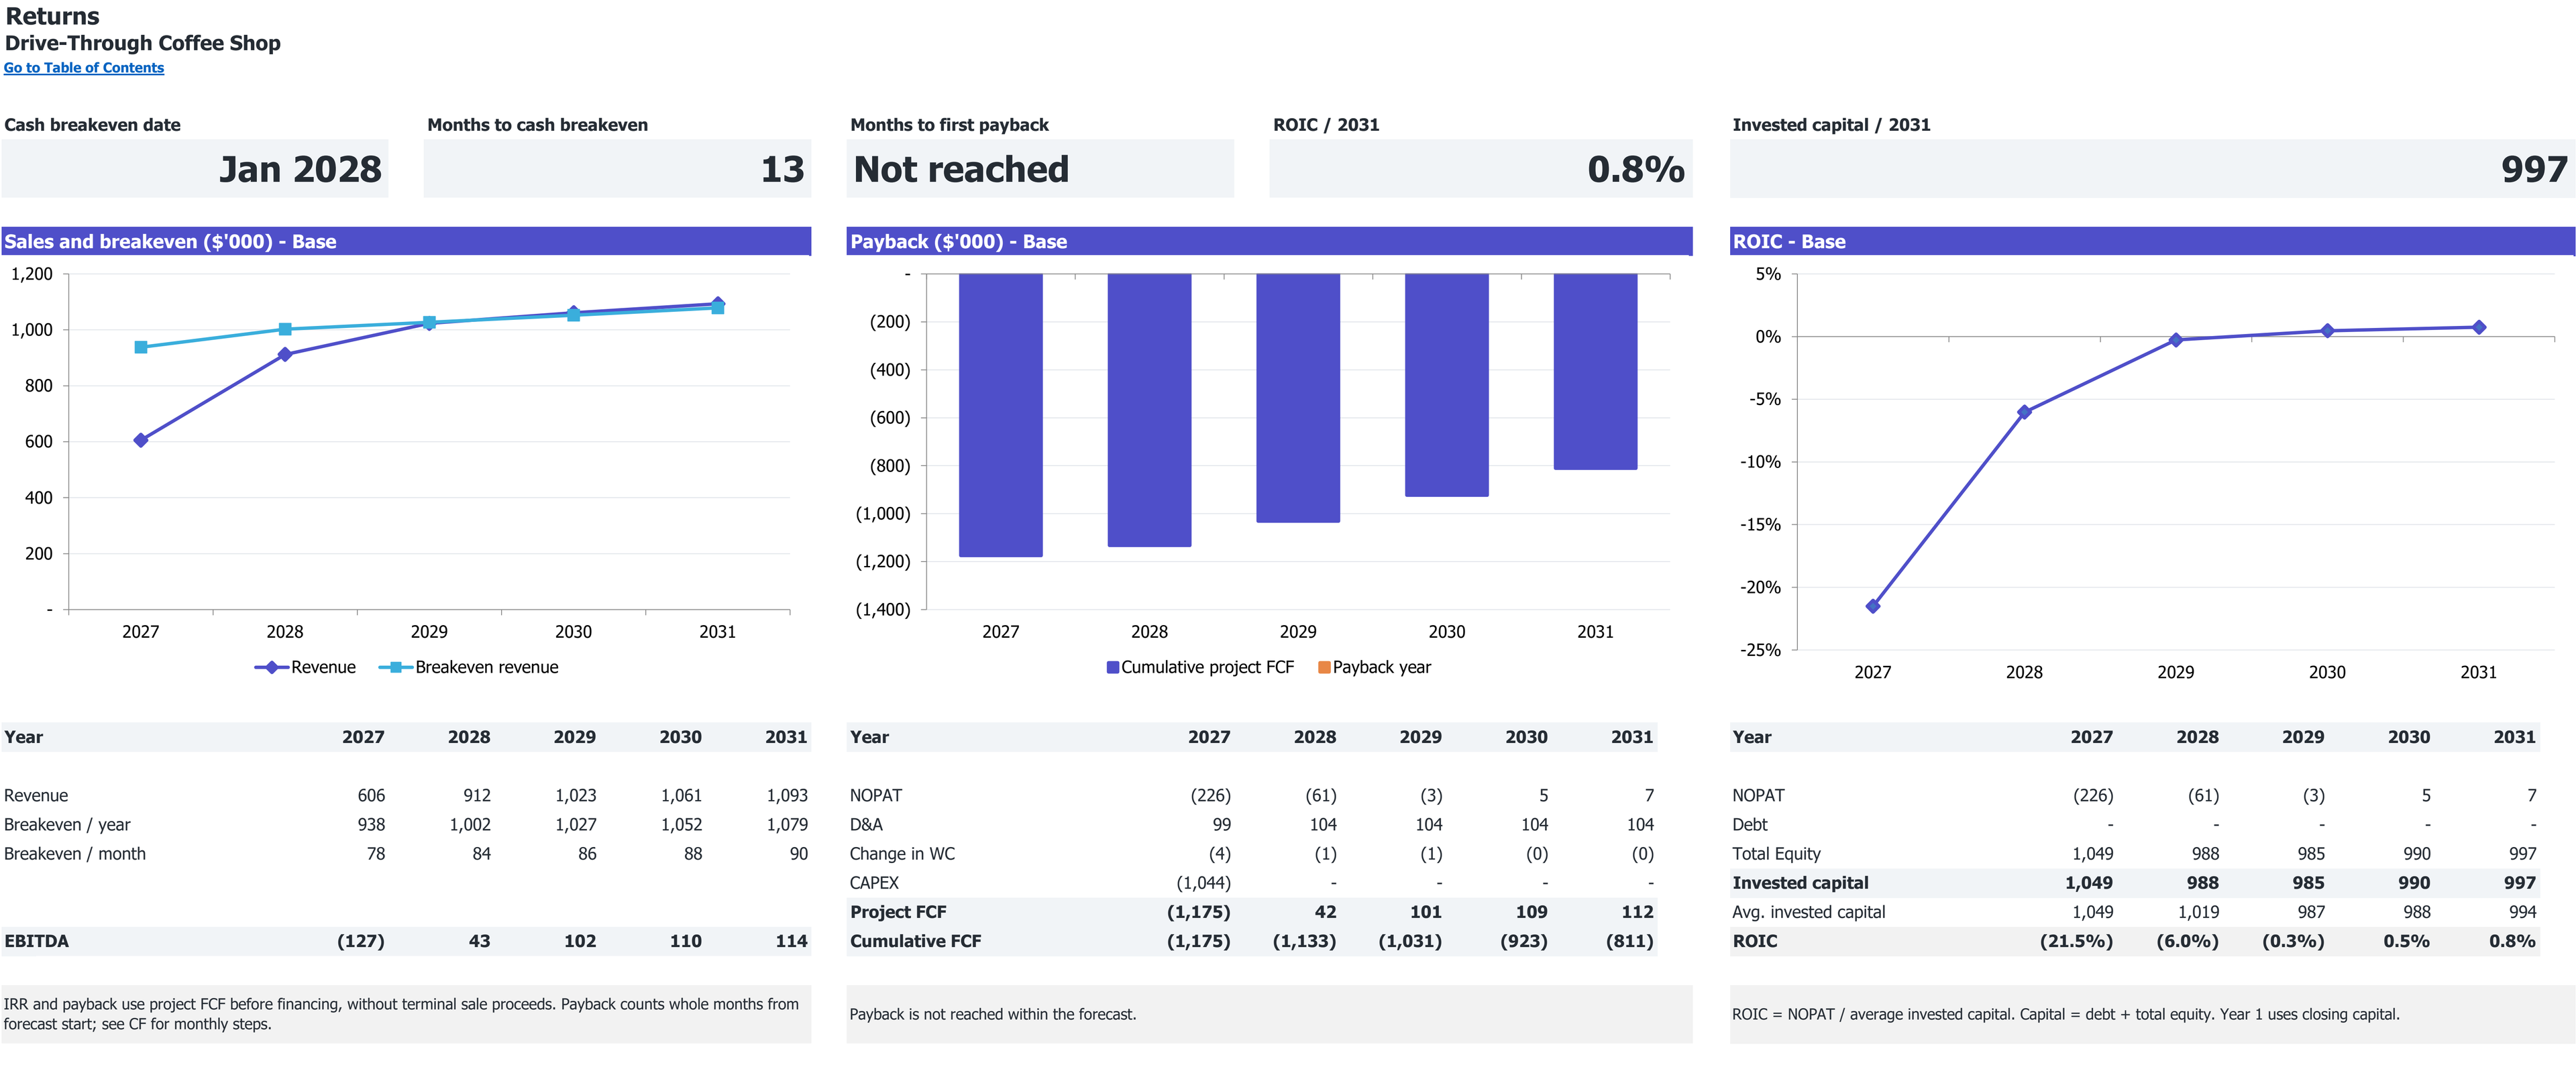
Excerpt from Returns: cumulative project free cash flow and first payback, if reached. 2027–2031 base case; dollar amounts in thousands.
Open full Returns view in a new tabExcerpt from Returns: revenue, annual and monthly break-even revenue, and EBITDA. 2027–2031 base case; dollar amounts in thousands.
Open full Returns view in a new tab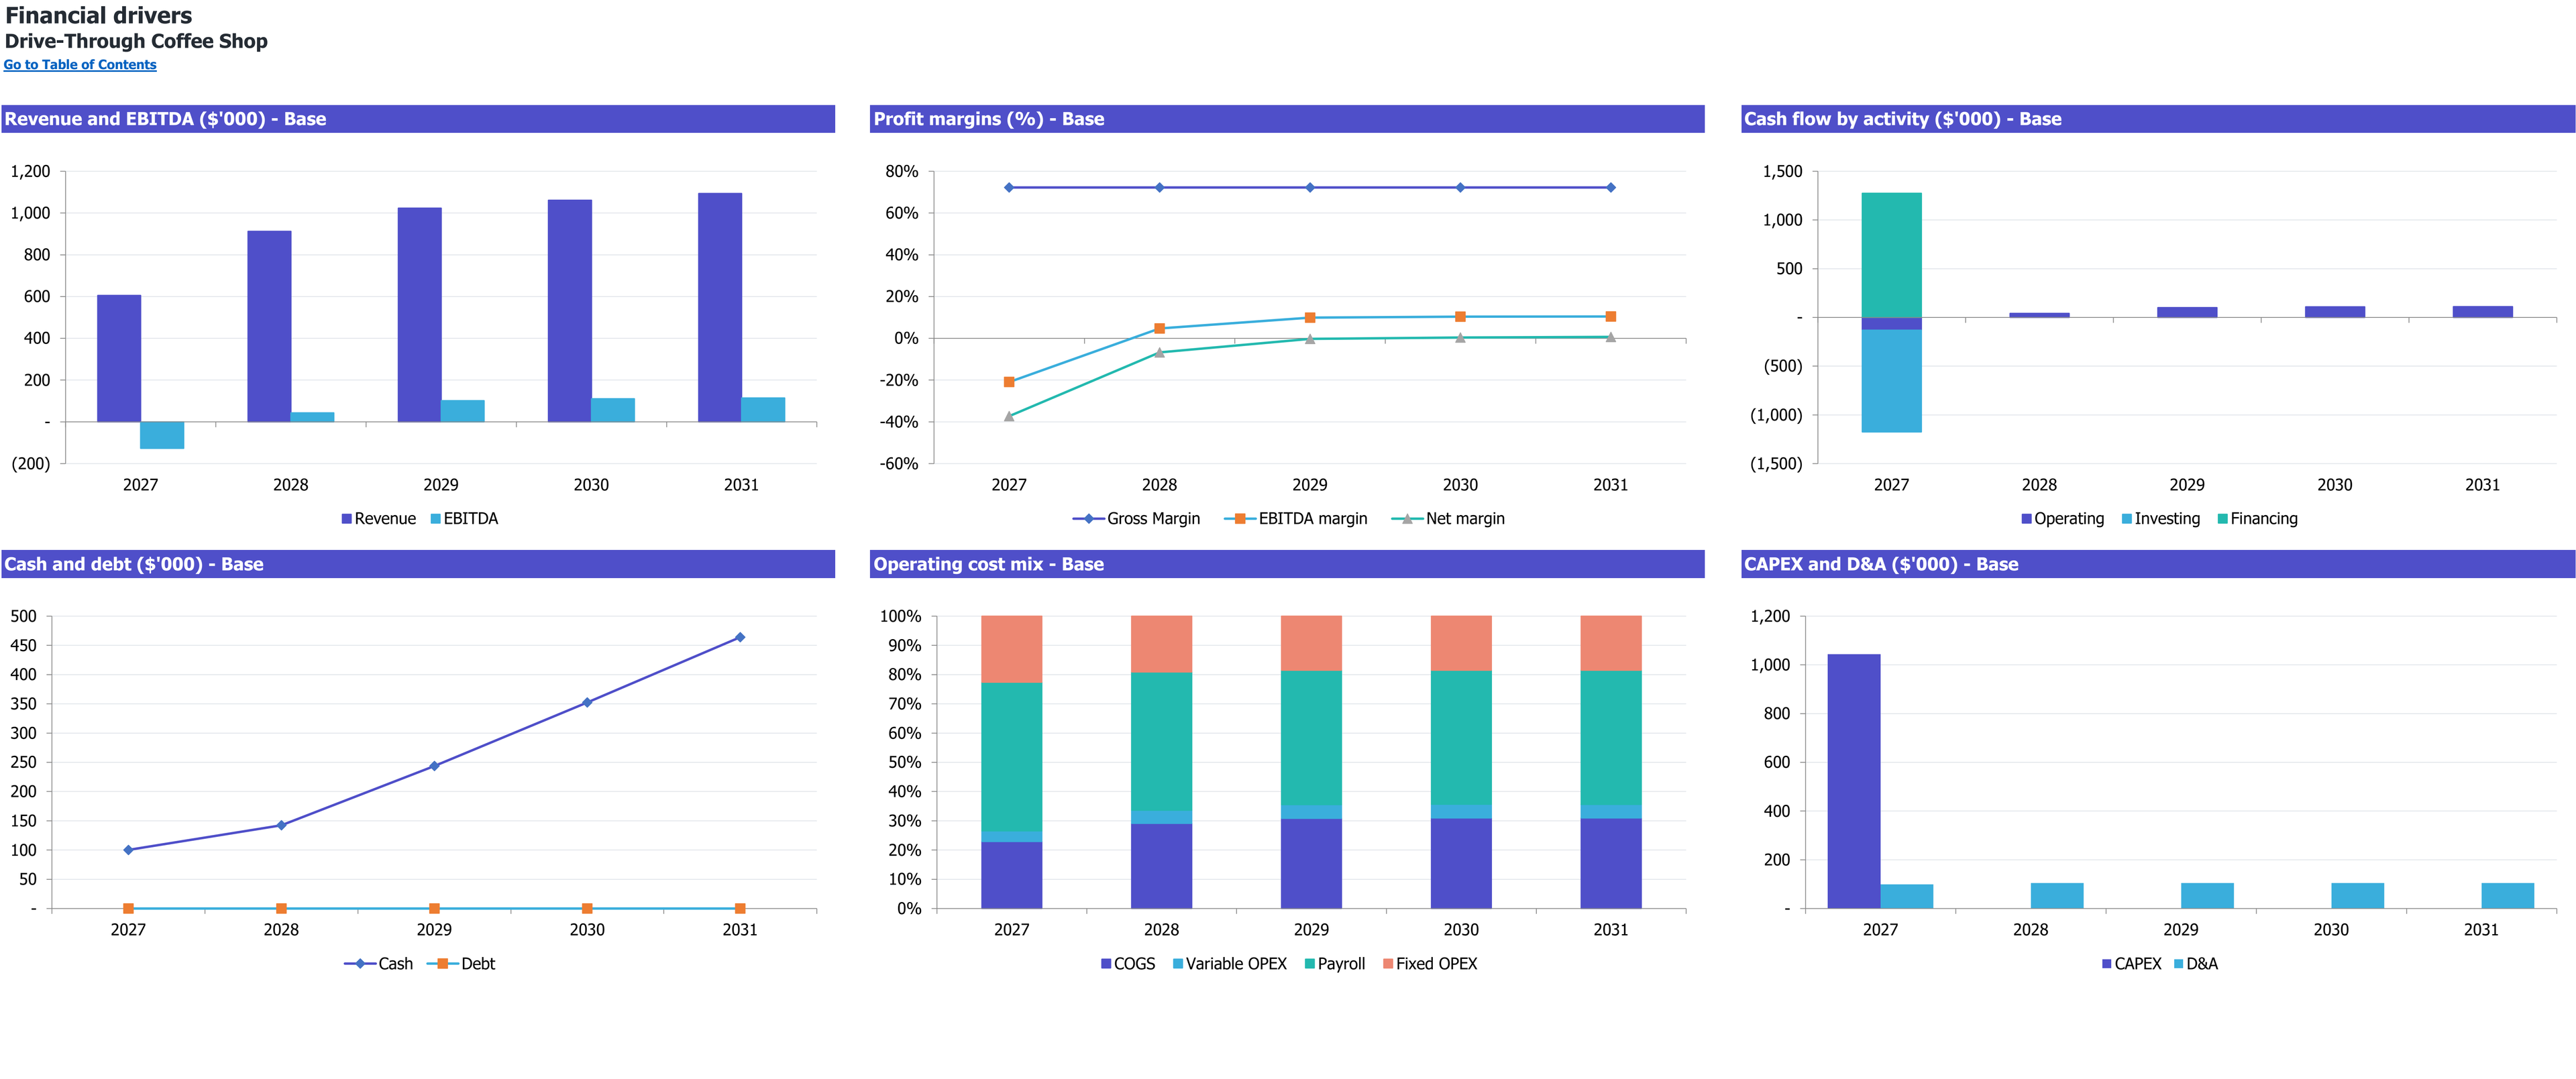
Six annual financial-driver charts for Drive-Through Coffee Shop, 2027–2031 (Base scenario). Dollar amounts are in thousands; margins and cost mix are percentages.
Enlarge image in a new tab8 selected worksheet views. Figures show this workbook’s starting case.
Workbook overview
What is inside the Excel model
Test peak and off-peak vehicle demand against the crew, lane and espresso equipment. Connect beverage recipes and a new kiosk/site budget to the cash required before and after opening.
Selected worksheets from the documented workbook. Forecast period: January 2027–December 2031. Model reference: PHY002-03.
Inputs you control. Results you can inspect.
On a small screen, scroll within the table to read every column.
| Planning area | Inputs you review | How they connect | Results to inspect |
|---|---|---|---|
| Vehicle demand | 280 initial potential vehicles/day; 45% in four peak hours. | Apply calendar/ramp and constrain peak and off-peak separately. | Fulfilled vehicles and lost demand. |
| Drink basket | 1.35 drinks/vehicle; 60% espresso, 25% cold brew, 15% brewed. | Apply prices and work per drink to each completed vehicle. | Servings, sales and preparation workload. |
| Paid capacity | 8.4 FTE with distinct prep, window and peak queue roles. | Remove closing work and apply role/equipment limits. | Funded throughput without free owner production time. |
| Recipes | Bean, milk and syrup quantities; 94% yield; packaging by drink. | Calculate ingredient/packaging costs independently from revenue scenarios. | Beverage contribution before payroll and site costs. |
| Capital and equity | $1,043,950 CAPEX; $1,275,000 initial equity. | Fund the project cash deficit plus a $100,000 reserve. | Monthly liquidity and unrecovered investment. |
Is this the right model for your business?
Check the starting case before changing the assumptions.
The starting operation
- A beverage-only independent drive-through kiosk on leased land.
- An operator testing distinct peak and off-peak staffing.
- A founder evaluating a substantial building/site investment against beverage sales.
Check the boundary
The saved case excludes food, indoor seating revenue, subscriptions, delivery, franchise fees, land purchase and debt.
Compare the other coffee shop typesHow this business makes money
Connect the unit sold to the resources required by this operating case.
Revenue logic
Fulfilled vehicle orders buy an expected drink basket across espresso, cold brew and brewed coffee.
Vehicles are payment transactions; drink servings are separate product volumes.
Why does a drive-through need separate peak and off-peak capacity?
A daily average can hide the vehicles arriving when preparation or handover is already full. This case constrains the two periods independently, so unused quiet-hour capacity cannot recover a lost peak order.
- Peak demand
- 45% of vehicles in four hours
- Basket workload
- 1.35 drinks per completed vehicle
- Site exposure
- Building/site costs precede sustained operating cash
What to establish for your own operation
- Obtain actual traffic and peak-period observations.
- Time ordering, full drink preparation and handover separately.
- Stress the construction schedule and monthly reserve.
Follow the plan from demand to cash
Open each section for the assumptions, calculations, and limits of this workbook’s starting case.
Keep unserved peak vehicles out of off-peak salesRevenue
Four peak hours receive 45% of demand. Peak queue staff take orders, while off-peak window staff perform both ordering and handover. Preparation, lane handover and espresso equipment each limit fulfilled vehicles. Unserved demand is lost.
Each vehicle buys 1.35 drinks on average. The starting basket uses $6 espresso/milk drinks, $5.75 cold brew and $3.75 brewed coffee. Stacking space is a site requirement, not extra drink-production capacity.
- The opening ramp is 65%, 80%, 90% and 100%.
- Physical vehicle counts do not change with a monetary revenue multiplier.
- Full beverage work includes more than espresso extraction alone.
Fund a twelve-hour operationPayroll
The 8.4-FTE team includes paid management, 4.4 preparation FTE, 2.2 window FTE and 0.8 peak queue FTE. The owner receives $65,060 annual starting pay and adds no free production capacity. Operating hires start in February.
Recipes use beans, milk, syrup and other ingredients divided by 94% yield. Packaging is charged per drink without a second waste uplift. Card transactions follow vehicles, not every drink. Wages and recurring costs rise 3% annually.
- Initial ground lease is $6,000/month plus $1,500 site taxes/CAM.
- The loaded payroll factor is 1.188 under the selected benefits/charge convention.
- Local lease, utility and insurance amounts remain planning allowances.
Separate building and site costs from operating fundingCAPEX
Initial CAPEX is $1,043,950, covering the kiosk/site, design, beverage equipment, signs and ordering hardware. Land is leased. The case assumes two months of preparation; this is a selected model input, not a confirmed construction or approval schedule.
January equity of $1,275,000 covers a $1,174,771 peak project cash shortfall plus a $100,000 reserve, rounded upward. Minimum cash is $100,229 in December 2027. No debt or subsequent equity is assumed.
- Assets use one ten-year book life from purchase.
- Seven inventory days are funded through working capital, not duplicated in CAPEX.
- Actual deposits or a longer construction period would change funding.
Read later operating profit against the initial investmentCF
Base 2027 revenue is $605,511 and EBITDA is −$126,707. EBITDA and operating cash first become nonnegative in January 2028 and remain so. EBIT first crosses zero in January 2029 but later negative months recur.
Project payback is not reached within 60 months. Cumulative undiscounted project free cash flow ends at −$810,907 despite positive later operating cash. No terminal property or equipment sale is assumed.
- Annual net income remains negative through 2029.
- The five-year cash balance includes the original equity contribution.
- Changed demand, staffing or construction inputs require a new funding review.
Selected results from the starting case
Modeled results in USD unless stated otherwise. These describe the selected inputs, not an estimate for your location or a guaranteed outcome.
- 2027 revenue
- $605,511USD, Base; ten service months after March opening.
- 2027 EBITDA
- −$126,707USD, Base; includes two preopening months.
- Initial CAPEX
- $1,043,950USD; kiosk and site investment on leased land.
- Minimum cash
- $100,229USD, funded Base balance in December 2027.
- Project payback
- Not reached within 60 monthsCumulative undiscounted project FCF ends at −$810,907; no terminal sale.
Make the case your own
Work from the operating plan toward the cash requirement.
Enter site traffic, peak share and vehicle basket.
Match paid role coverage to both trading periods.
Replace construction, lease and installed equipment budgets.
Review operating crossings, accounting reversals and unrecovered project cash.
Interpretation and scope
- This national case does not establish traffic engineering, permits or local demand.
- Queue stacking is not a queue simulation or throughput guarantee.
- Same-month settlement and zero receivables/payables simplify cash timing.
- The 25% tax allowance has no selected jurisdiction or loss carryforward.
- The single asset life and two-month construction schedule require project-specific review.
The workbook is an Excel file for local planning. Learn how to interpret assumptions and evidence.
Other coffee shop types
Each operating type calls for its own financial structure.
Questions
Can unused off-peak time serve missed peak orders?
No. Unserved peak demand expires in the model.
Is one vehicle one drink?
No. Each fulfilled vehicle buys 1.35 drinks on average.
Is land purchased?
No. The operation leases the land and funds the kiosk/site improvements.
Does positive EBITDA mean accounting profit?
No. Depreciation keeps annual accounting profit negative through 2029.
Does the saved case recover startup investment?
No. Cumulative project cash remains negative at the end of 60 months.
What if a purchased file is damaged or cannot be downloaded?
See the refund and replacement policy for file correction, replacement and download assistance. Keep the product name and your order reference when requesting help.
Which software does the workbook use?
The documented file is an Excel workbook (.xlsx). Compatibility with other spreadsheet applications is not established by the file extension.
Read the planning guides
Explore the relevant operating questions and how to interpret a workbook’s assumptions.
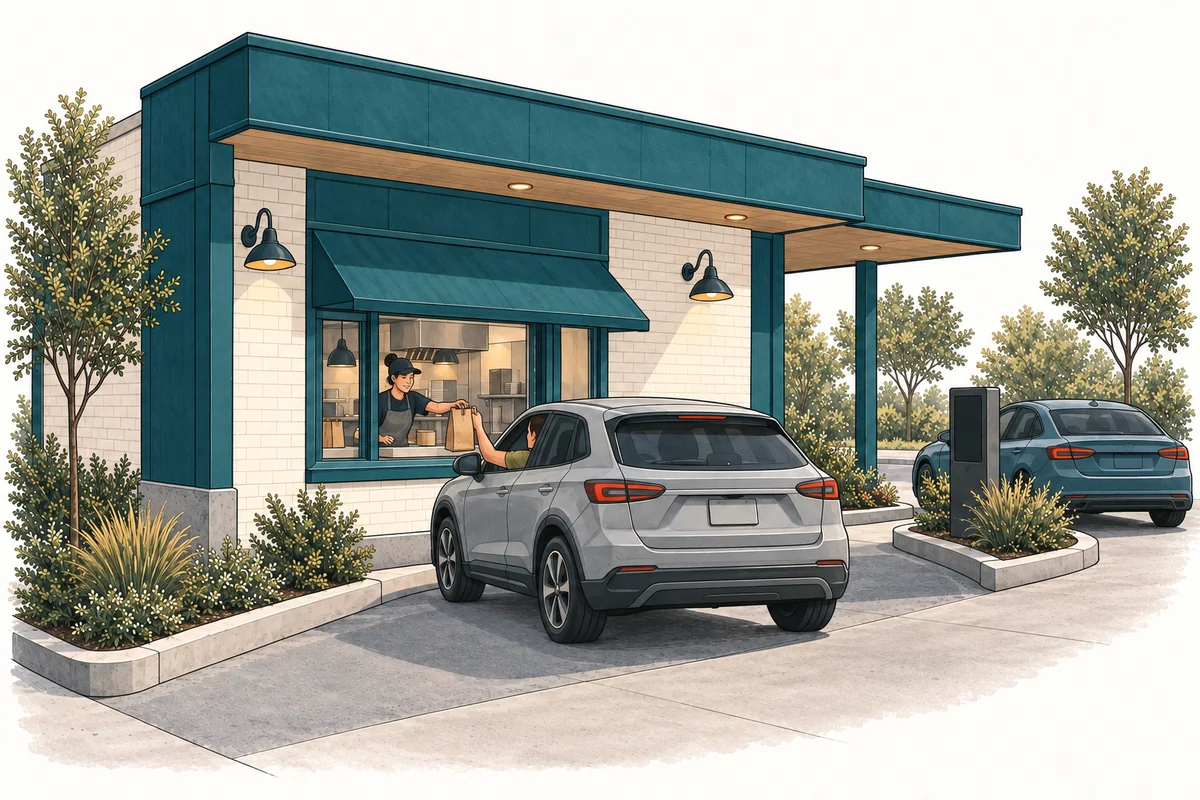
What limits drive-through sales: the lane, the crew, or production?
Compare two drive-through planning cases to see how peak demand, ordering, handover, and paid production capacity determine fulfilled vehicle orders.
Read the guide
How to read financial assumptions before editing an Excel model
Follow the chain from operating assumptions to calculated results, check units and timing, and keep a useful record of changes to a financial workbook.
Read the guideEvidence and scope
A related category or operator is referenced. Do not interpret the link as independent proof of this exact configuration or its viability.
The links below provide operating-format context; they do not verify the workbook’s selected inputs or calculated returns.
The workbook guide and figures describe model PHY002-03, revision r01, for January 2027–December 2031. These are a documented planning case, not observed results for a particular business.