
Two U.S. Base planning cases show the distinction: a drive-through burger restaurant in an existing building and a drive-through coffee shop in a new kiosk. Both forecast January 2027–December 2031 in USD and open in March 2027. Their selected operating assumptions explain different workflows, not measured industry performance.
Why split peak and off-peak demand?
Each case limits fulfilled orders within separate periods. Unserved peak demand is lost rather than moved into spare off-peak hours. That prevents a quiet afternoon from being treated as capacity that was available during a busy morning or lunch rush.
The burger case assigns half its requests to three peak hours within a ten-hour service day. The coffee case assigns 45% to four peak hours within a twelve-hour day. Those shares and windows are inputs to validate locally; neither model’s pattern should be copied into the other without an operating reason.
On a narrow screen, scroll within the table to read both cases.
| Planning question | Burger restaurant | Coffee shop |
|---|---|---|
| What does one vehicle buy? | 1.5 meal equivalents. | 1.35 drinks across the selected beverage mix. |
| When is demand concentrated? | 50% in three peak hours; ten hours open. | 45% in four peak hours; twelve hours open. |
| How are orders handled? | Separate ordering and handover crews; 1.5 minutes at each station. | Peak queue order-taker; off-peak window staff combine ordering and handover. |
| What constrains production? | Meal equipment output and productive cook hours. | Drink preparation hours and espresso equipment. |
| What happens to excess demand? | Lost within the constrained period. | Lost within the constrained period. |
The table is a workflow comparison, not a profitability ranking. One case refurbishes an existing restaurant and the other budgets a new kiosk and site improvements. Their construction scope, menus, staffing, and financing differ, so their returns would not isolate the effect of choosing burgers or coffee.
What does the burger lane calculation reveal?
At the selected mature 2027 demand of 280 vehicles per open day, the peak receives 140 requests: 280 × 50%. A single fully available 1.5-minute station has a physical ceiling of 40 vehicles per hour, or 120 during three peak hours. Even before paid coverage or kitchen constraints, that ceiling is 20 orders below the requested peak volume.
This is an isolated station calculation, not a rerun of the monthly forecast. The actual model also checks productive ordering hours, separate handover coverage, and kitchen output, then applies its calendar and whole-order rules. Those checks can reduce fulfillment further; the theoretical 120 is not a guaranteed daily sales figure.
The 1.5-minute inputs describe each station’s operating cycle, with overlapping food preparation and vehicle processing. Adding the ordering and handover times is not how the model derives the pipeline’s hourly rate. Total customer waiting time and station cycle time answer different questions.
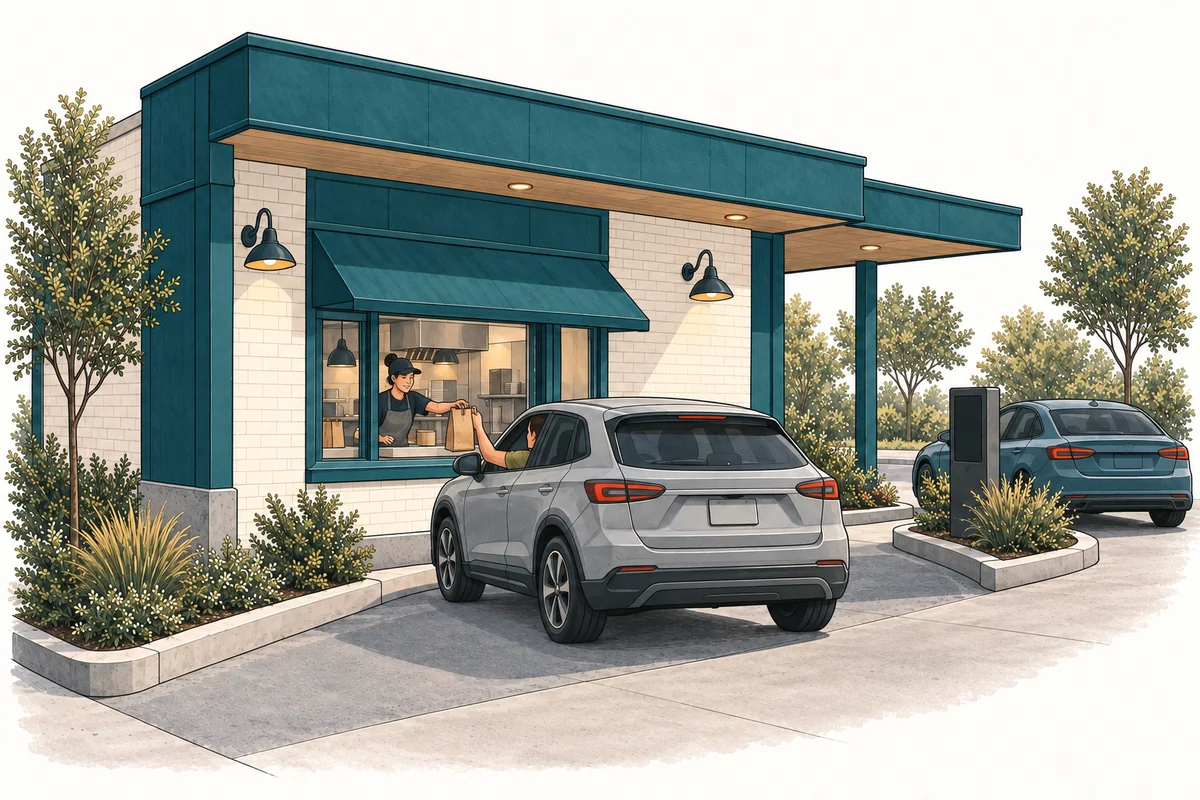
Why can the coffee crew become the limit?
The coffee case gives the window team different work in different periods. A queue order-taker handles orders during the peak, while off-peak window staff perform both ordering and handover. Treating those two tasks as independently staffed all day would overstate the capacity the payroll funds.
Preparation depends on drink mix and drinks per vehicle. Espresso, cold brew, and brewed coffee have different selected preparation times, while espresso equipment has its own capacity. Convert both equipment and labor limits into vehicle orders before comparing them with lane demand; a drink per hour is not a vehicle per hour.
Closing work also consumes paid hours in this case. The owner/manager’s paid role supports the business but is not added as extra beverage-production capacity. A longer service day therefore needs a staffing review as well as a change to the hours input.
Which change should a growth scenario test first?
Identify the constrained stage and period, then change one supported operating input. Additional cook or barista time helps only when preparation is limiting; a faster handover does not help if ordering coverage or production is already slower. More paid coverage also changes costs, even when demand fails to use it.
- Validate the peak share and service windows against the intended site.
- Distinguish station cycle time from the customer’s complete journey.
- Preserve each role’s task allocation and paid non-service time.
- Recheck fulfilled orders, payroll, and cash after the operating change.
Use the relevant burger model or coffee model for that workflow. The assumptions review guide helps keep a physical capacity scenario distinct from a monetary sales multiplier.
