
Burger Restaurant Financial Model: Drive-Through Burger Restaurant
Plan a drive-through burger restaurant around peak demand, ordering and handover crews, kitchen output, meal costs and startup cash.
- Excel (.xlsx)
- Forecast: 60 months · March 2027 opening
- Lane: One ordering station · one handover window
- Case: U.S. · USD · Base
Planning several types? Compare 6 burger restaurant formats
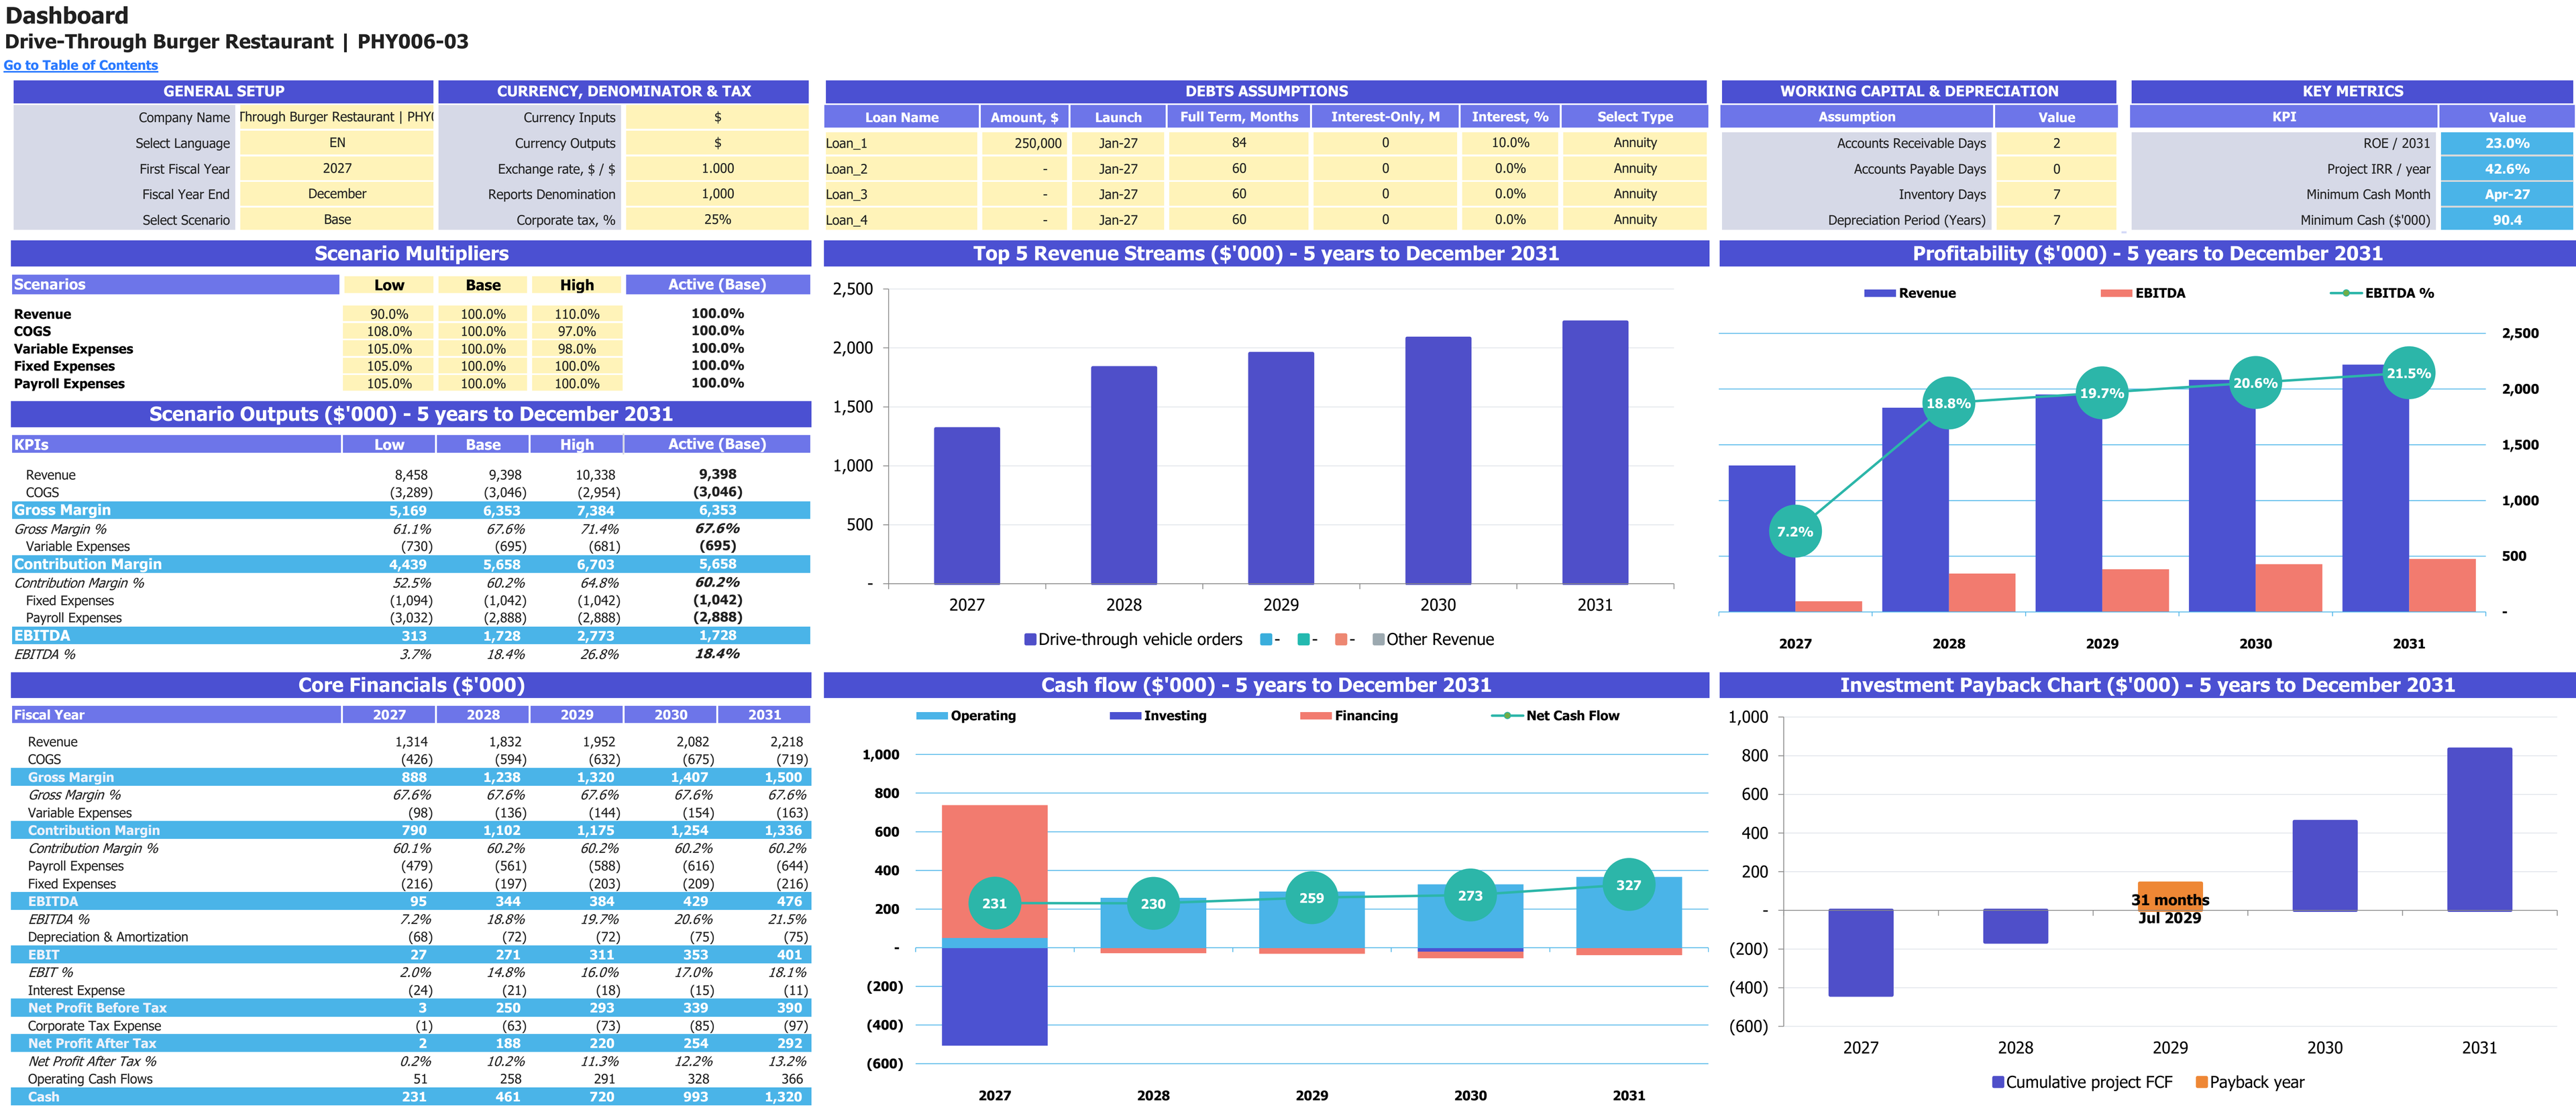
Base-case scenario controls, annual financial results and charts for 2027–2031. Financial report amounts are shown in thousands of USD; percentage measures retain their own units.
Enlarge image in a new tab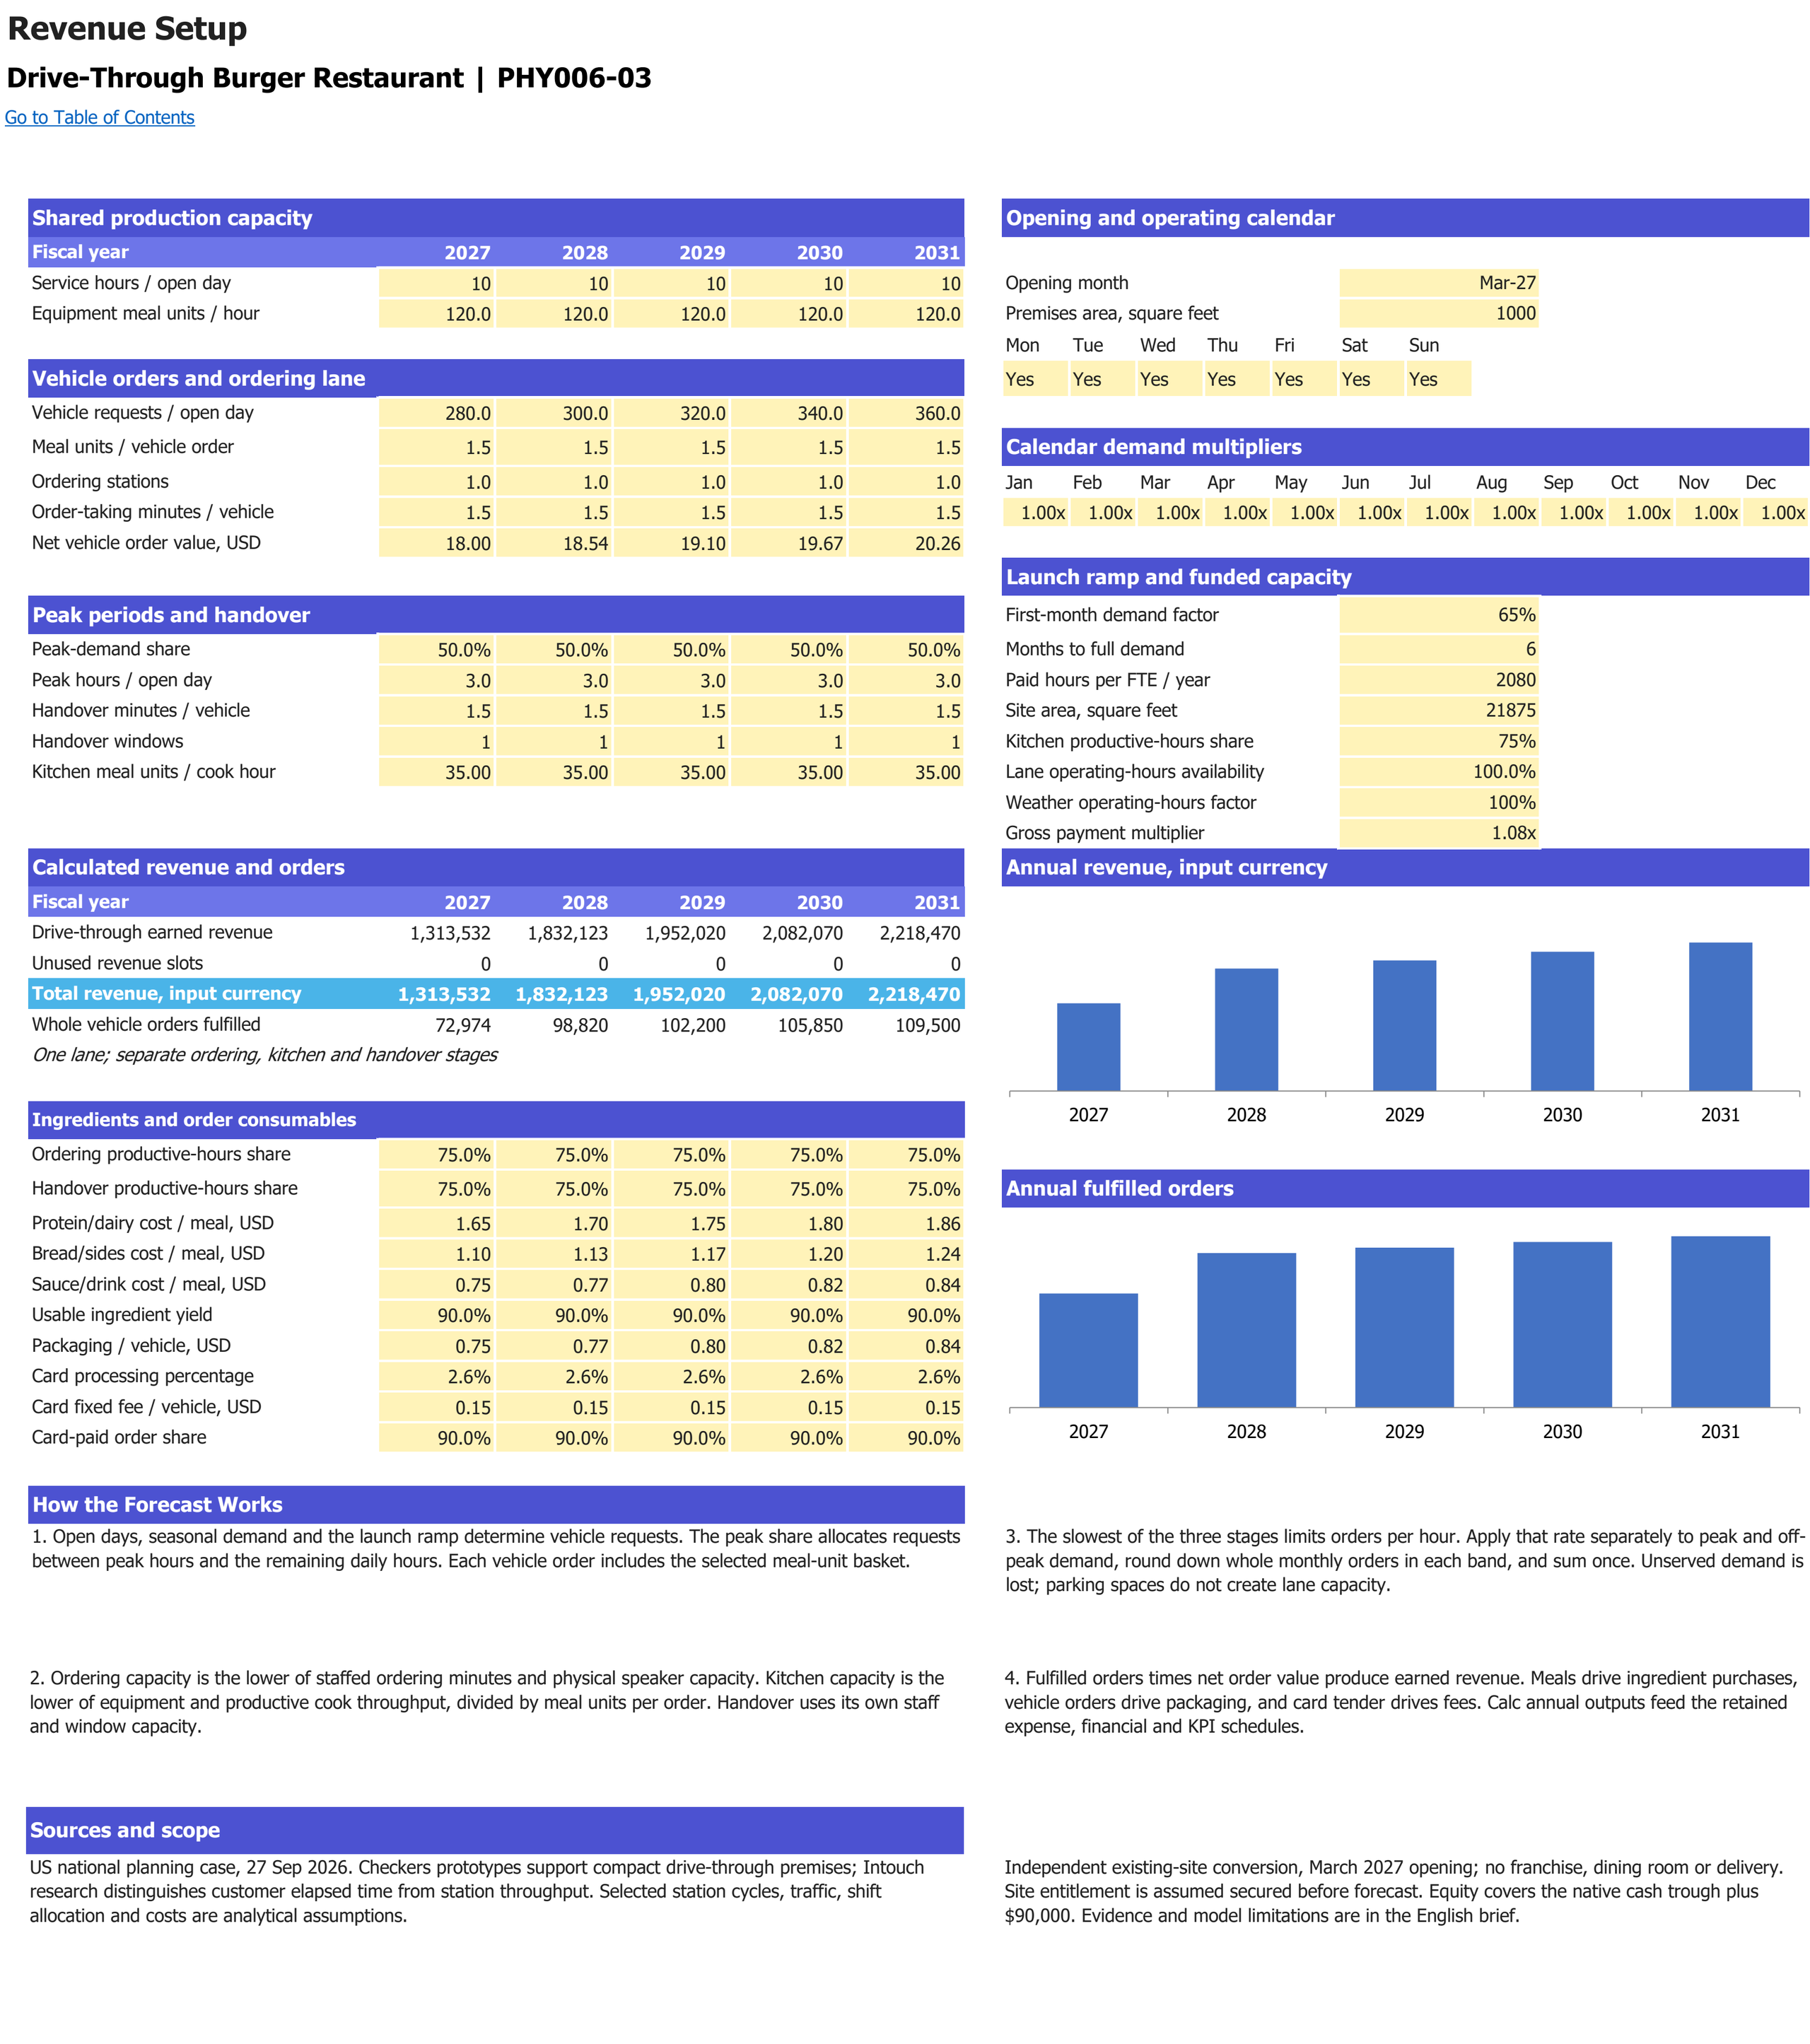
Peak and off-peak vehicle demand, ordering, preparation and handover capacity with annual sales results. Monetary inputs and sales use USD; operating volumes retain their labelled units. Forecast years are 2027–2031.
Enlarge image in a new tab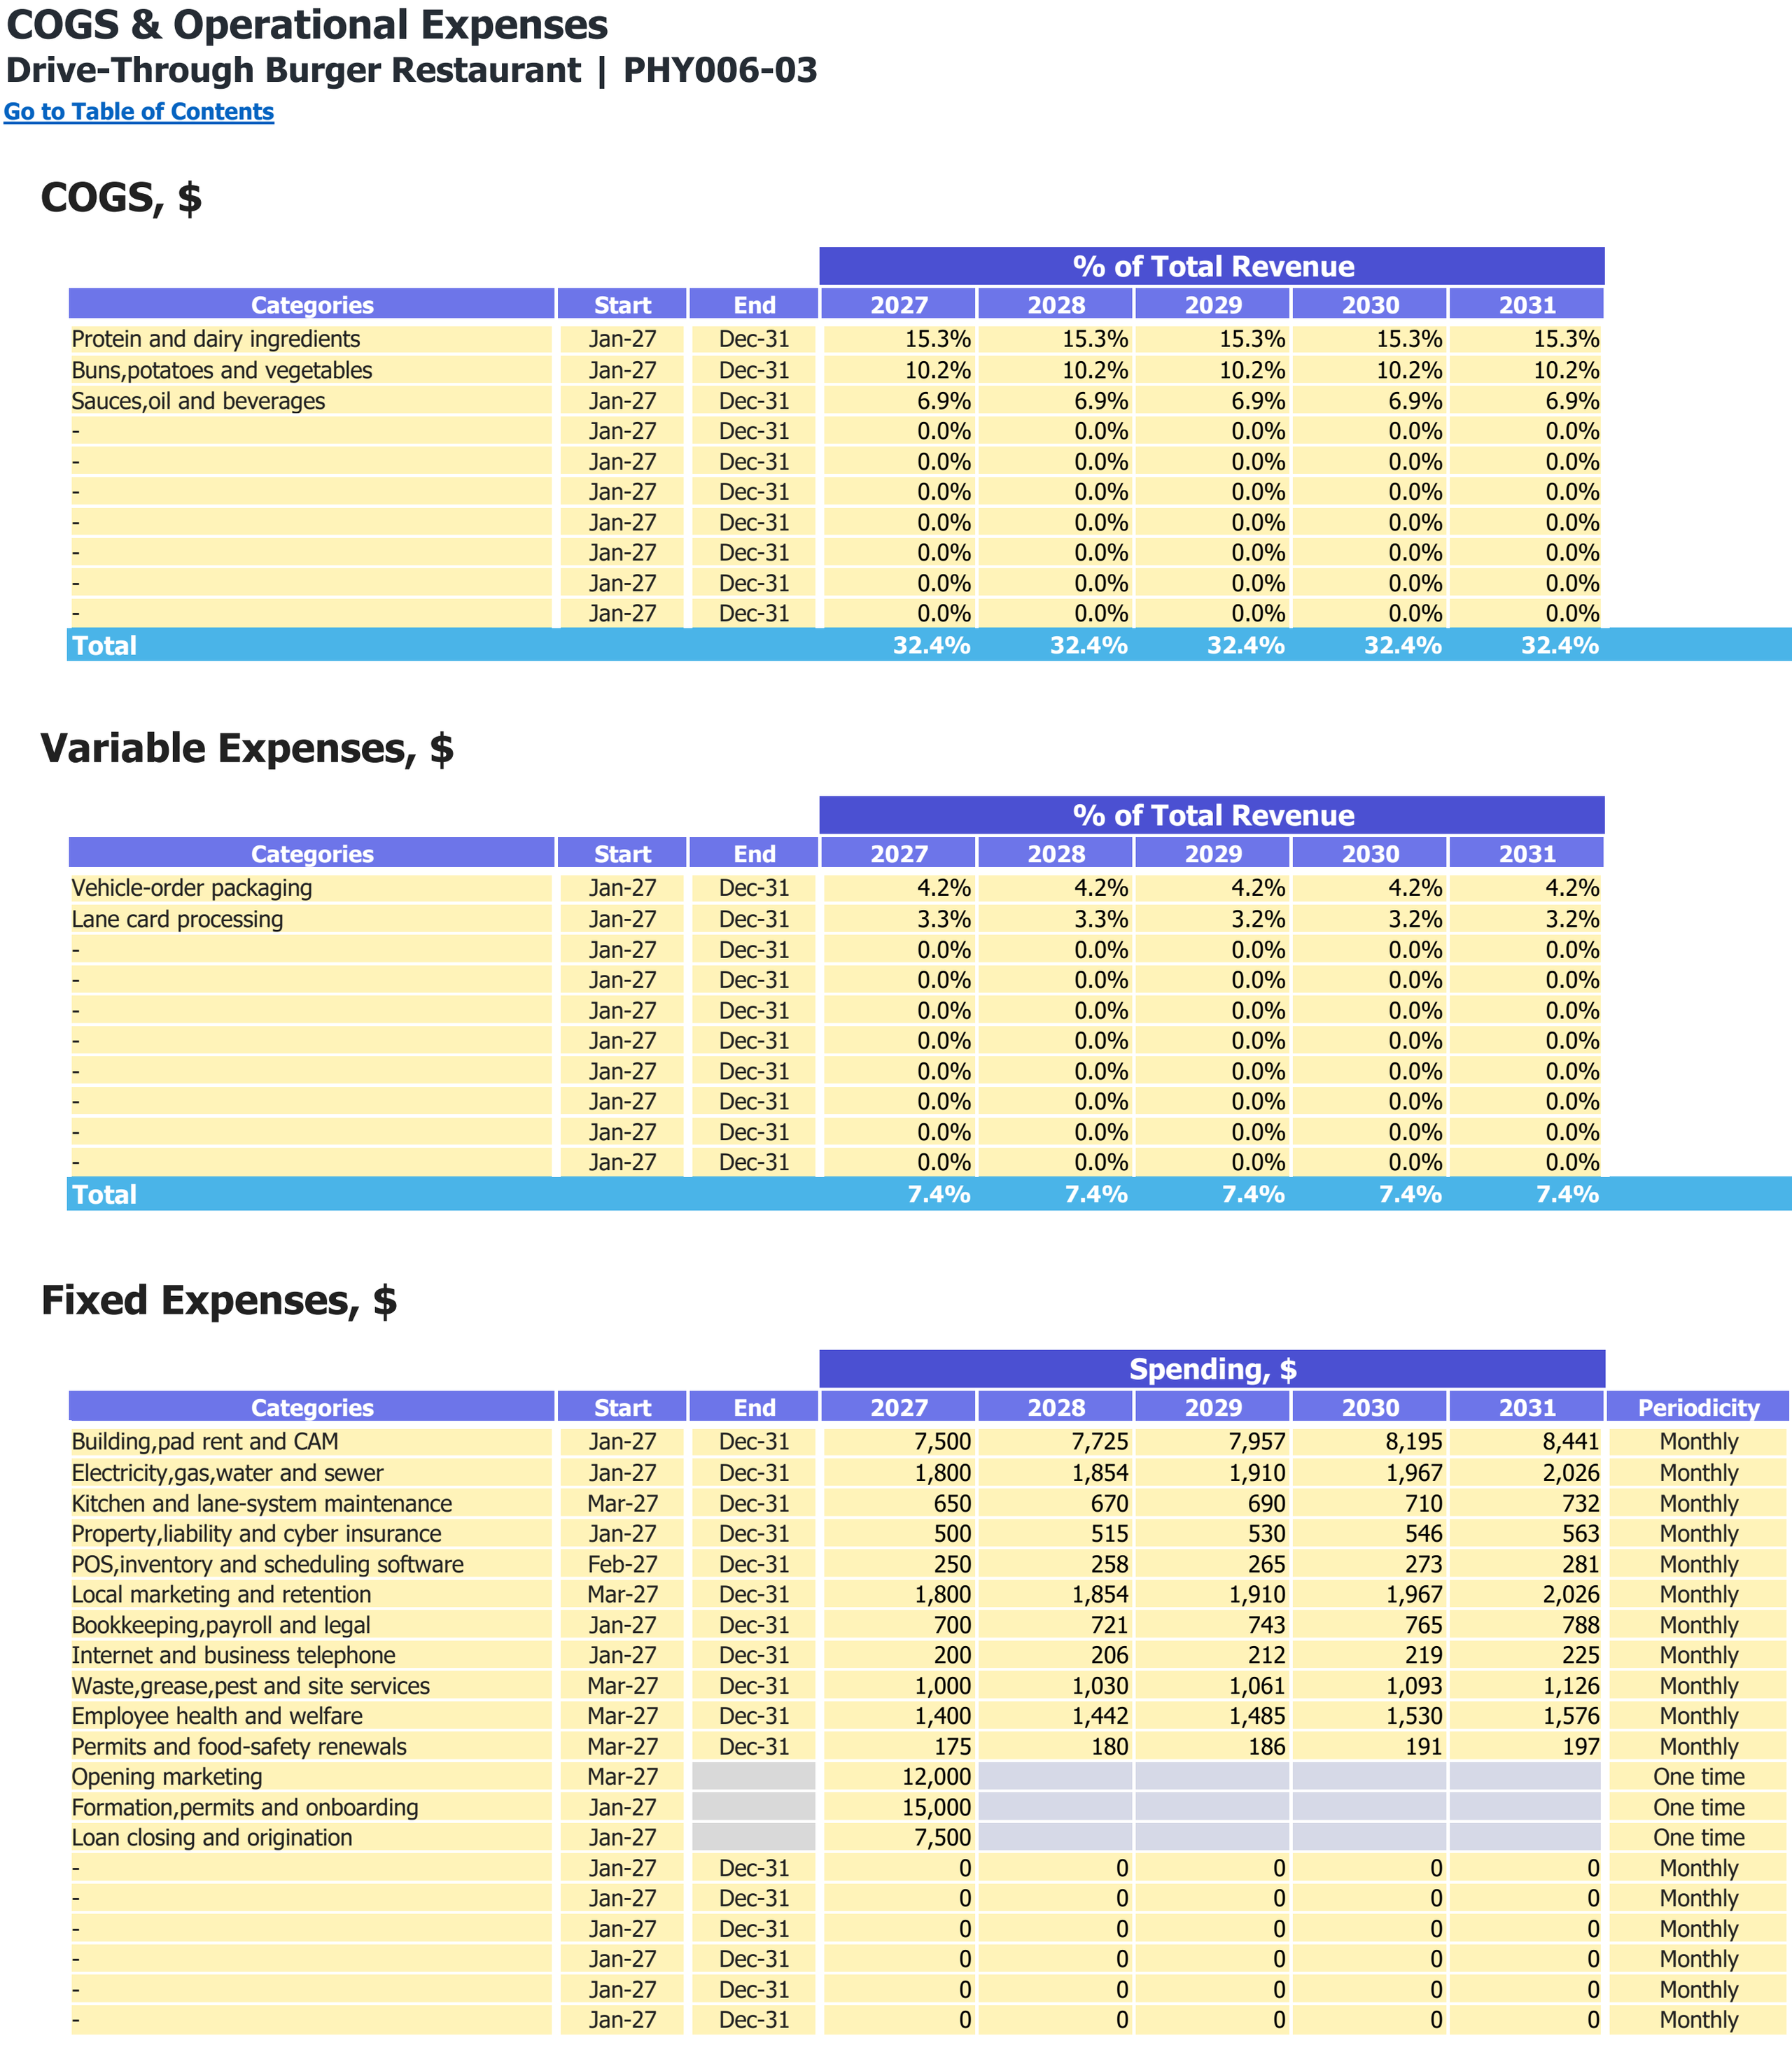
Food and other direct-cost categories, variable expense shares and fixed operating expenses. Monetary inputs are USD; the annual percentage columns are cost shares of revenue.
Enlarge image in a new tab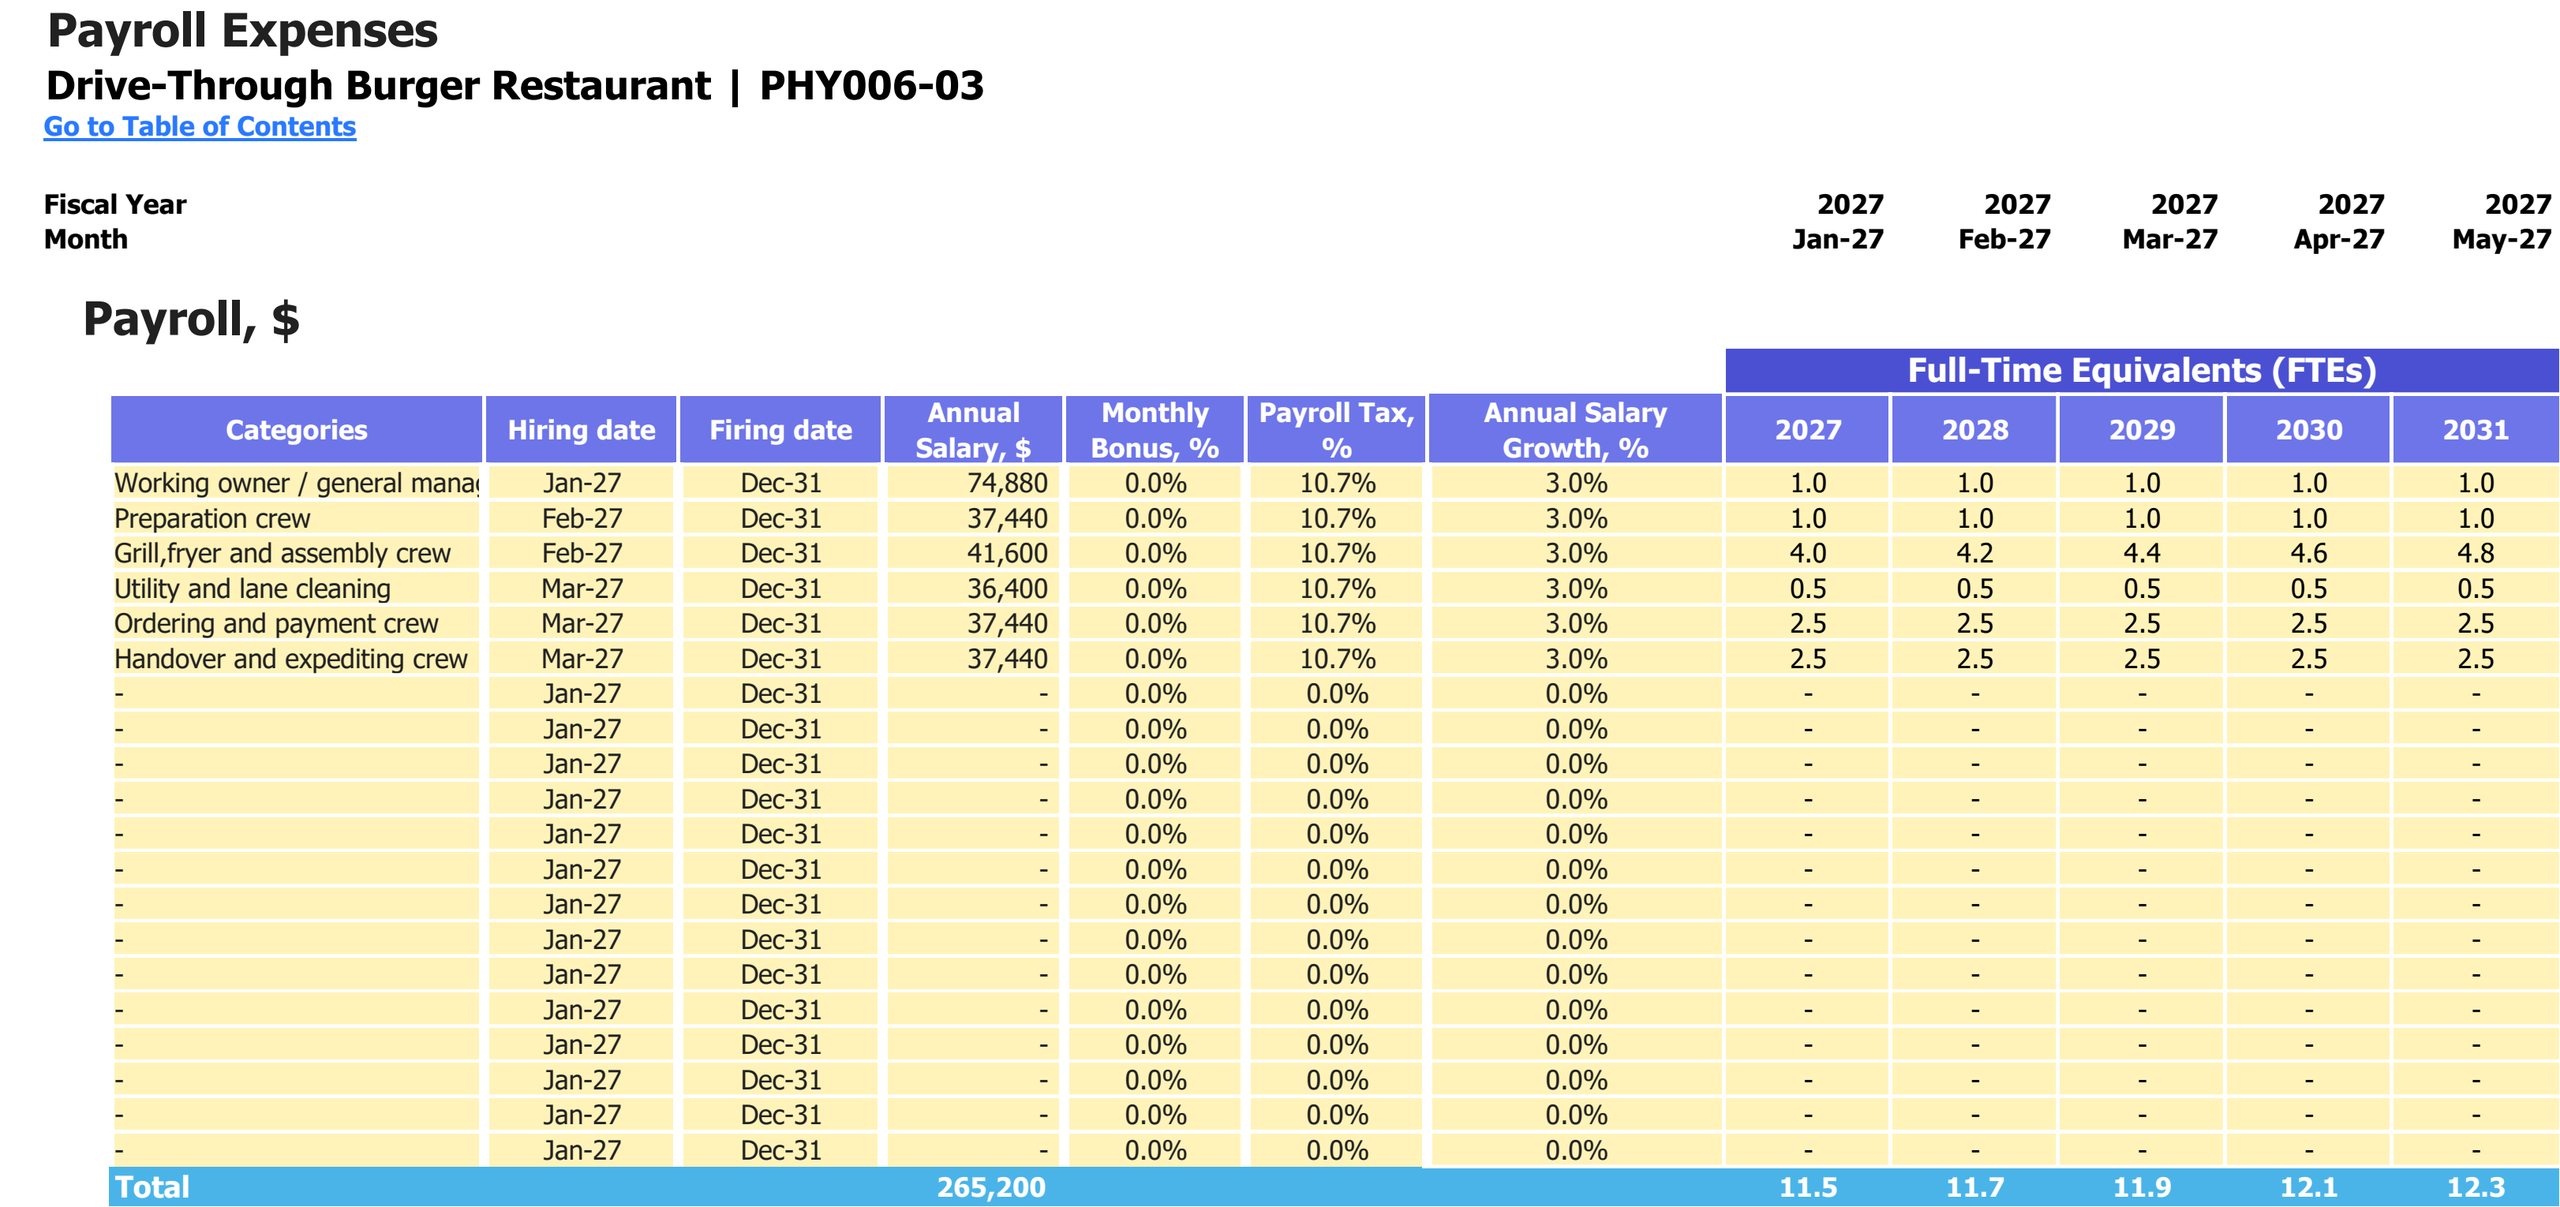
Paid roles, annual salary and employer-load assumptions, with staffing in full-time equivalents for 2027–2031. Salary amounts are USD; percentages and FTEs are labelled separately.
Enlarge image in a new tab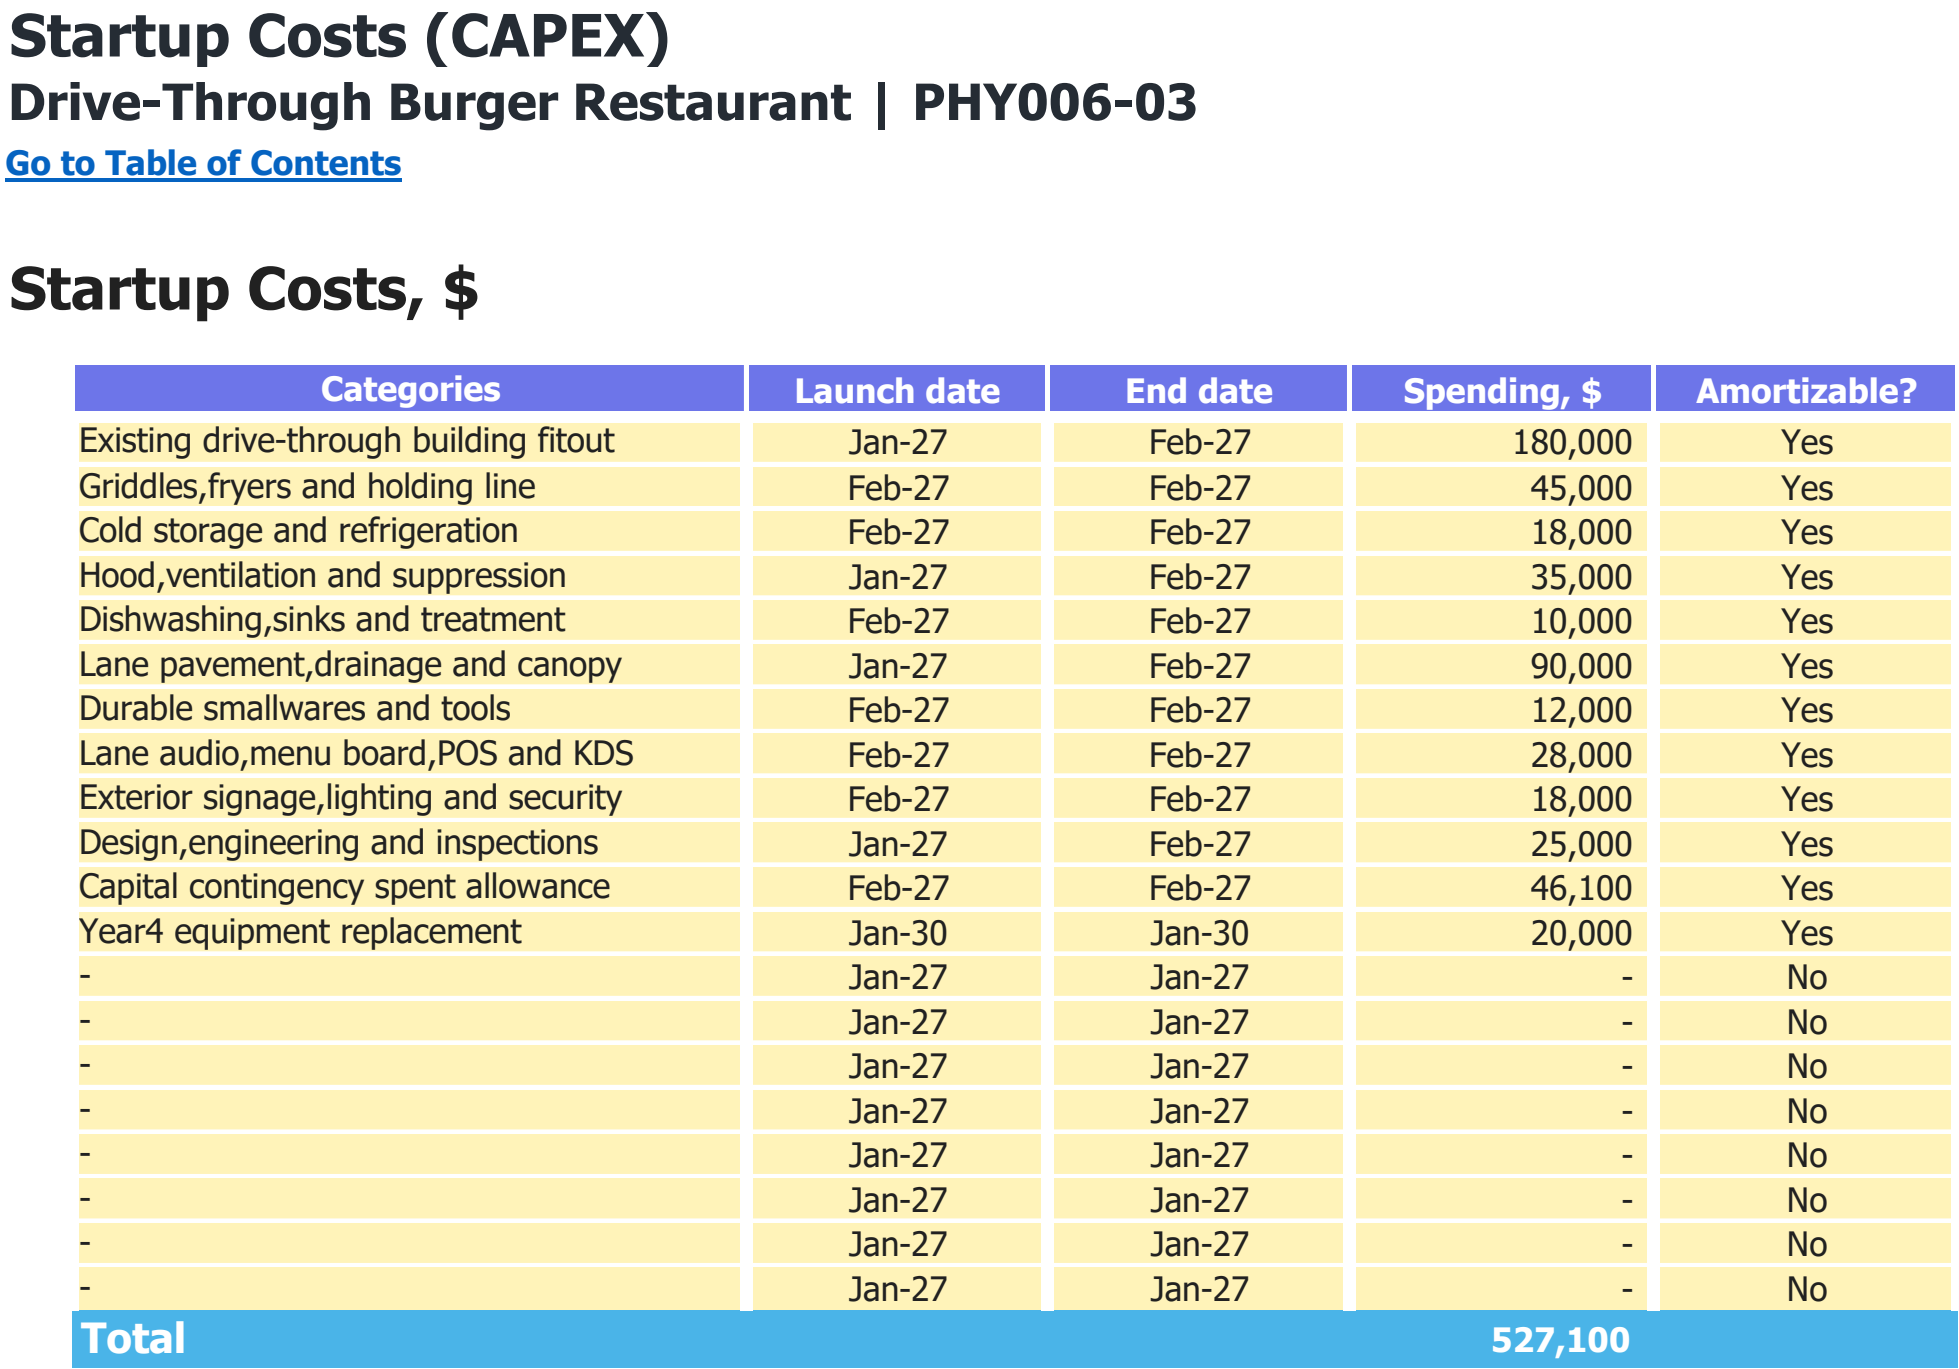
Asset categories, purchase dates and spending assumptions in USD. The total includes every scheduled purchase shown, including later replacements where present.
Enlarge image in a new tab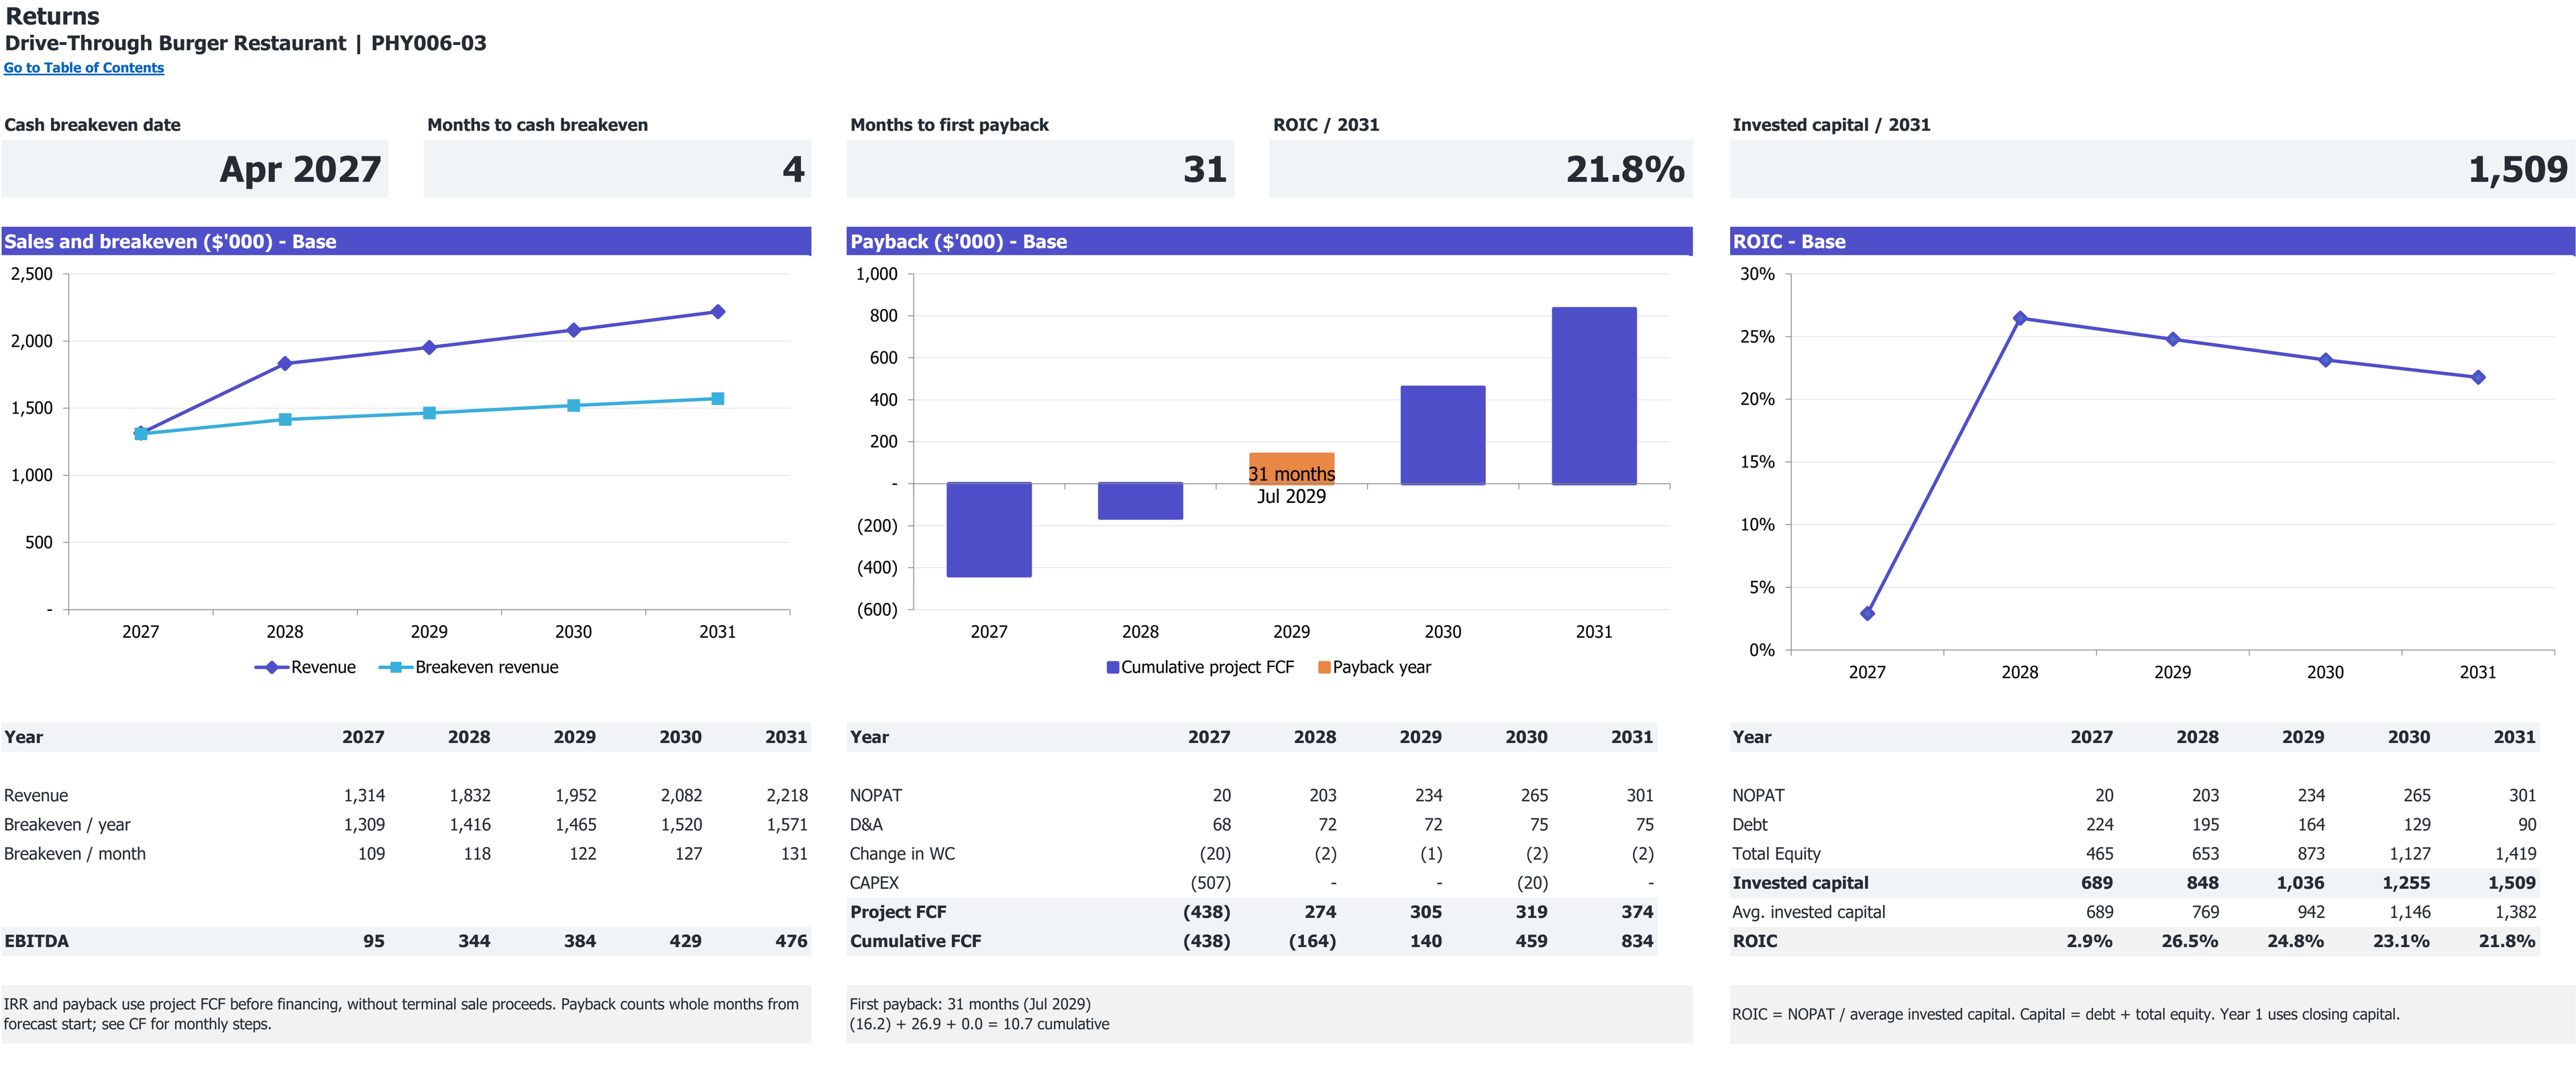
Excerpt from Returns: cumulative project free cash flow and first payback, if reached. 2027–2031 base case; dollar amounts in thousands.
Open full Returns view in a new tabExcerpt from Returns: revenue, annual and monthly break-even revenue, and EBITDA. 2027–2031 base case; dollar amounts in thousands.
Open full Returns view in a new tab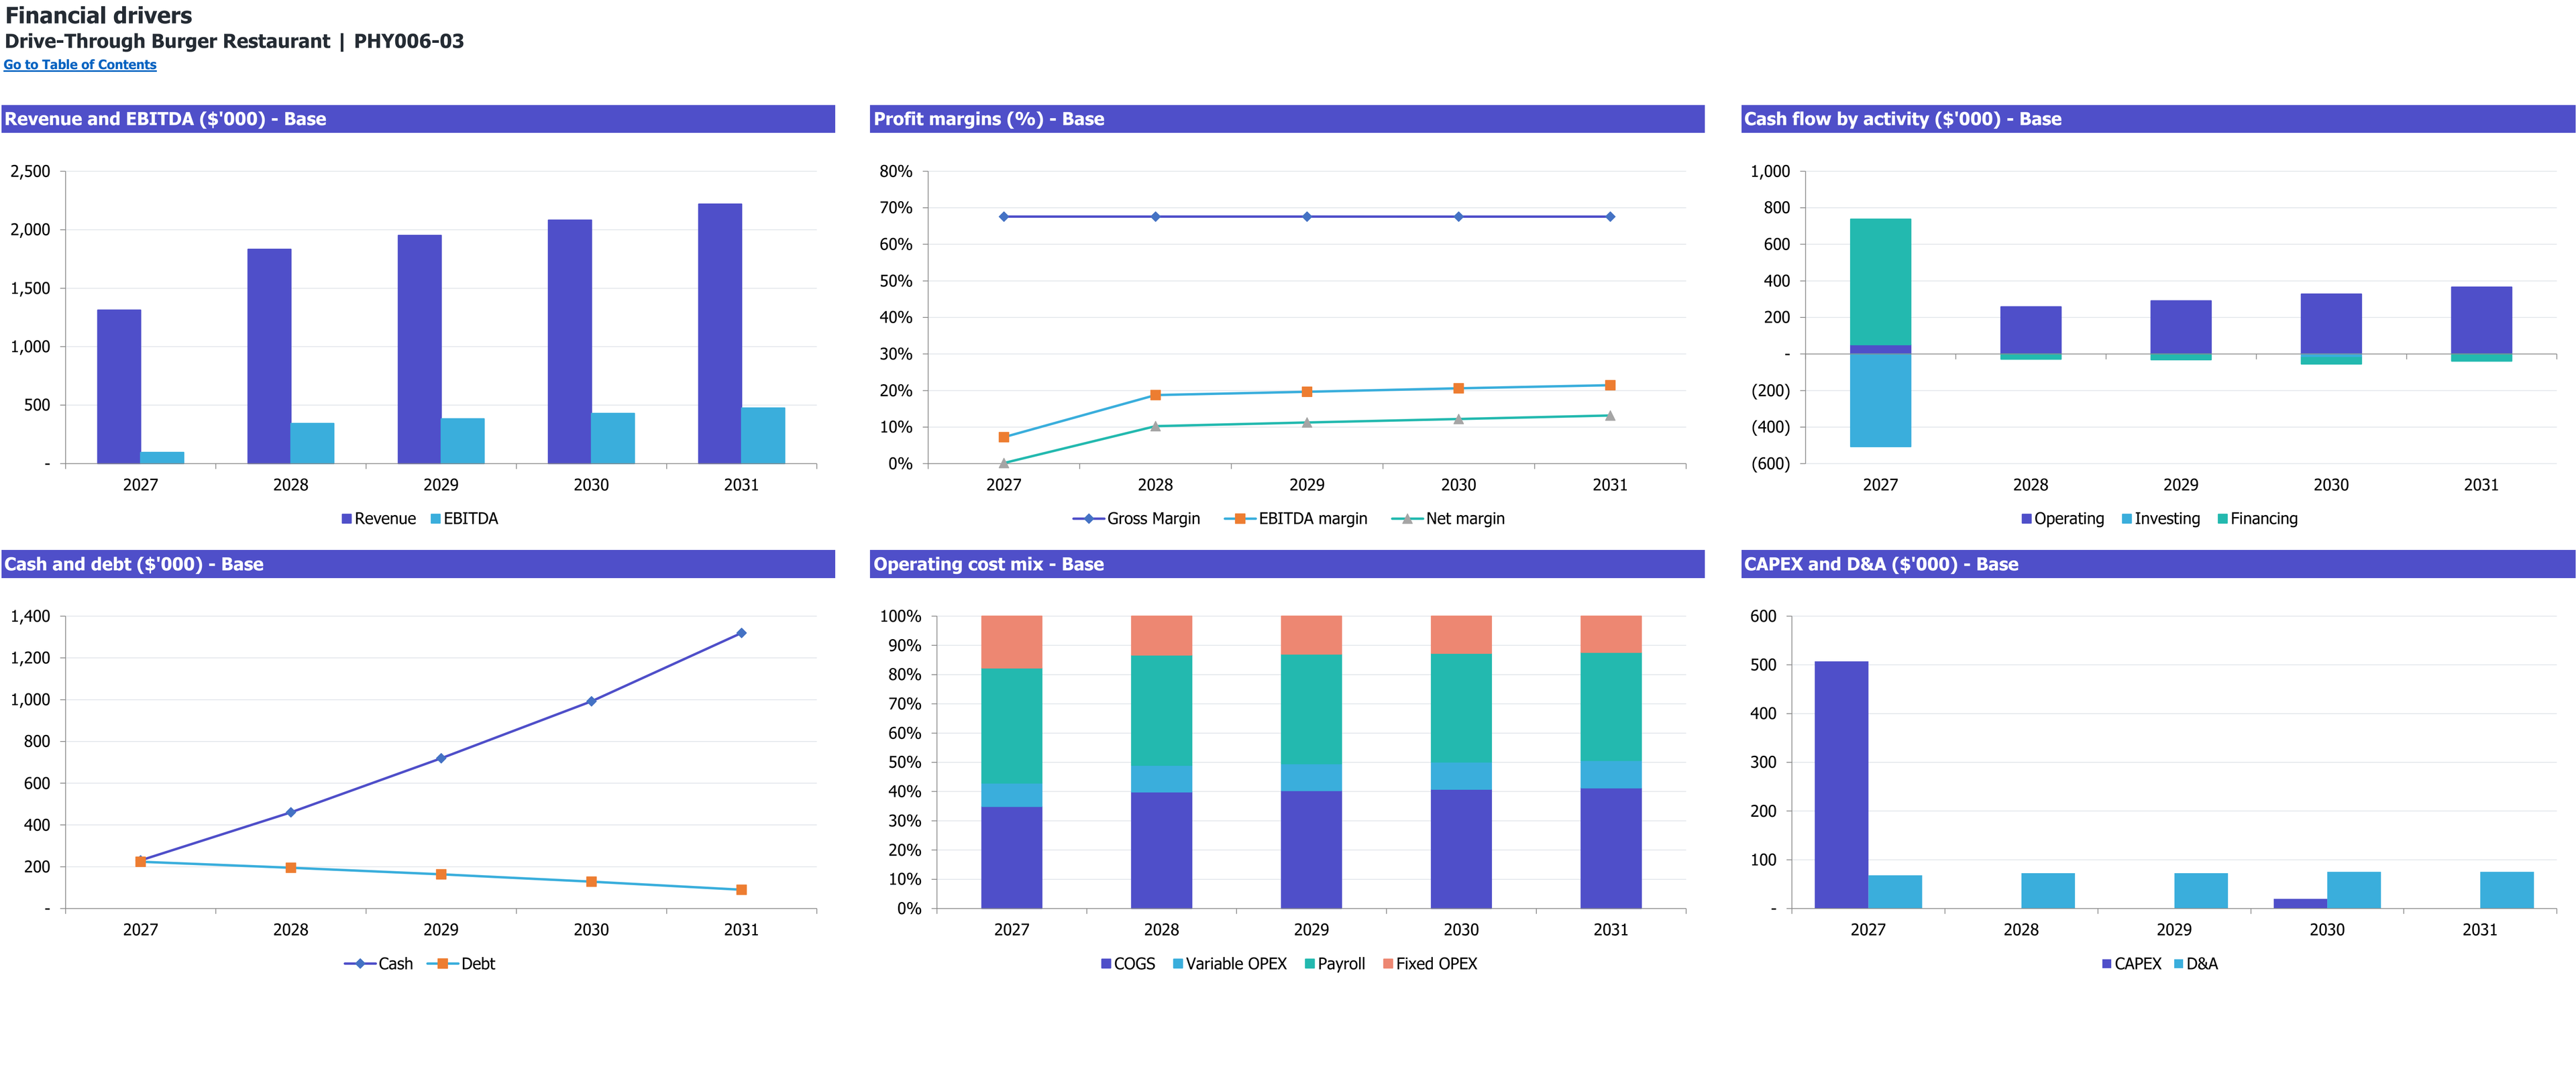
Six annual financial-driver charts for Drive-Through Burger Restaurant, 2027–2031 (Base scenario). Dollar amounts are in thousands; margins and cost mix are percentages.
Enlarge image in a new tab8 selected worksheet views. Figures show this workbook’s starting case.
Workbook overview
What is inside the Excel model
Find the stage that limits completed vehicle orders. This workbook separates peak and off-peak demand, then carries feasible sales through ingredient costs, paid staffing and cash.
Selected worksheets from the documented workbook. Forecast period: January 2027–December 2031. Model reference: PHY006-03.
Inputs you control. Results you can inspect.
On a small screen, scroll within the table to read every column.
| Planning area | Inputs you review | How they connect | Results to inspect |
|---|---|---|---|
| Demand by period | Vehicle requests, peak share, peak hours, open days and ramp. | Requests are split once between peak and off-peak time. | Served and lost orders by period. |
| Station capacity | Ordering and handover cycle times, stations and paid staff. | Physical points and productive staffing jointly cap each stage. | Practical lane throughput. |
| Kitchen and order size | Meals per vehicle, equipment output and productive cooks. | Meal production capacity converts into vehicle-order capacity. | Feasible completed orders. |
| Unit costs | Ingredient basket, yield, packaging, card terms and tender factor. | Physical costs derive annual expense ratios for the retained reports. | Food, packaging and transaction expense. |
| Premises and cash | Building/pad rent, site works, capital, settlement, inventory and funding. | Dated costs, debt service and working capital flow through monthly cash. | Funding reserve and capital recovery. |
Is this the right model for your business?
Check the starting case before changing the assumptions.
The starting operation
- An independent restaurant with one ordering station and one handover window.
- An existing 1,000-square-foot building on a 21,875-square-foot pad.
- A March 2027 opening after refurbishment, with all operating roles paid.
Check the boundary
Greenfield development, a dining room, delivery or a franchise operation needs additional premises, timing and operating assumptions.
Compare the other burger restaurant typesHow this business makes money
Connect the unit sold to the resources required by this operating case.
Revenue logic
Revenue = fulfilled vehicle orders × net order value.
Peak and off-peak requests are constrained separately. Lost peak demand does not move into spare off-peak capacity.
Why can unused off-peak capacity coexist with lost sales?
Customers arriving during the peak need service in that period. The model does not shift rejected vehicles into quieter hours. Ordering, kitchen and handover capacity must therefore support the peak mix as well as the daily total.
- Unit sold
- One completed vehicle order.
- Time split
- Peak and off-peak demand are constrained separately.
- Slowest stage
- Ordering, kitchen or handover can bind.
What to establish for your own operation
- Time each station separately from total customer waiting time.
- Observe peak arrivals and meals per order.
- Validate staff coverage and access/stacking constraints at the site.
Follow the plan from demand to cash
Open each section for the assumptions, calculations, and limits of this workbook’s starting case.
Check the slowest stage during the busy periodRevenue
The starting case requests 280 vehicles per open day, with half arriving in three peak hours. The remaining half arrives in seven off-peak hours. Both ordering and handover use selected 90-second station cycles.
Kitchen equipment and productive cooks constrain meal output. One vehicle buys 1.5 meal equivalents at an initial $18 net ticket. The slowest stage caps each period independently; rejected peak demand is lost.
- The case operates all seven weekdays with a six-month opening ramp.
- Station cycles are assumptions, not measured total customer-journey times.
- Monthly coverage does not simulate minute-by-minute queues or stacking-space spillback.
Fund the people behind the lane capacityPayroll
The initial 11.5-FTE team grows to 12.3 FTE. The owner, preparation, utility, ordering, handover and kitchen roles are all paid. Only the designated bottleneck crews create their respective productive capacity.
Ingredients start at $3.50 per meal before a 90% usable yield. Packaging is $0.75 per vehicle. Card expense uses 90% card share, a 2.6% rate, $0.15 per transaction and the selected gross-tender factor.
- Annual expense shares are derived from physical Base costs.
- Monetary scenarios scale financial budgets independently; they do not rerun physical meals.
- Payroll load and a separate employee-benefit pool are counted once.
Include the pad and lane in the opening budgetCAPEX
Initial CAPEX is $507,100, including $46,100 spent contingency. A separate $90,000 allowance covers lane pavement, drainage and canopy; the compact building does not remove these site costs. January 2030 adds $20,000 replacement capital.
January funding is $713,000: $463,000 equity and $250,000 debt. The loan assumes 10% fixed interest and 84 monthly annuity payments. Funded minimum cash is $90,390 in April 2027.
- The property is assumed secured and entitled before the forecast.
- Receivables use two sales days; food inventory uses seven COGS days; payable days are zero.
- The retained reserve is cash, separate from spent capital contingency.
Compare operating coverage with project recoveryCF
Base 2027 revenue is $1,313,532 and EBITDA is $95,169 across ten service months and two pre-opening months. EBITDA and operating cash first become nonnegative in April 2027; EBIT follows in May, with all three remaining nonnegative thereafter.
Project payback is July 2029, month 31 from January 2027. It uses cumulative undiscounted unlevered cash, including project deficits and replacement investment, with no exit sale or owner distributions.
- Money-only Low and High cases are separate from physical lane tests.
- Daily capacity can look adequate while the peak period still loses orders.
- The forecast depends on local traffic, prices and productive staffing.
Selected results from the starting case
Modeled results in USD unless stated otherwise. These describe the selected inputs, not an estimate for your location or a guaranteed outcome.
- First-year revenue
- $1,313,532Base · USD · calendar 2027, including ten service months.
- First-year EBITDA
- $95,169Base · USD · calendar 2027, including pre-opening expenses.
- Initial CAPEX
- $507,100Base · USD · January–February 2027, including site works and spent contingency.
- Minimum funded cash
- $90,390Base · USD · April 2027 after the selected equity and debt.
- Project payback
- July 2029Base · month 31 from January 2027; undiscounted unlevered project cash, excluding financing and exit.
Make the case your own
Work from the operating plan toward the cash requirement.
Set demand, peak concentration, open hours and the launch ramp.
Review station cycles, kitchen output and funded crews together.
Replace meal, packaging, premises and installed-site budgets.
Inspect monthly cash and resize fixed funding before interpreting payback.
Interpretation and scope
- This U.S. planning case assumes an existing entitled site, not a greenfield permitting schedule.
- Cycle times, demand and staff productivity require local validation.
- The model does not simulate minute-by-minute queues, spillback or detailed rosters.
- Monetary scenarios do not recalculate physical meal economics; zero revenue with positive fulfilled orders is invalid.
- No land purchase, delivery, franchise royalty, tax-loss carryforward, owner distribution or terminal sale is included.
The workbook is an Excel file for local planning. Learn how to interpret assumptions and evidence.
Other burger restaurant types
Each operating type calls for its own financial structure.
Questions
Does a five-minute customer journey imply twelve vehicles per hour?
No. Elapsed journey time differs from the cycle of a station that overlaps with other work. The model uses separate ordering, kitchen and handover limits.
Can off-peak capacity serve rejected peak orders?
No. Rejected peak demand is lost in this case.
Is food cost simply a chosen percentage of sales?
The Base percentage is derived from meals, ingredient purchase budgets and usable yield. The retained reports receive annual shares; money scenarios operate separately.
Does the small building remove site investment?
No. The budget separately includes lane pavement, drainage, canopy and other access infrastructure.
Does project payback measure owner distributions?
No. It measures unlevered project recovery; no shareholder distributions are scheduled.
What if a purchased file is damaged or cannot be downloaded?
See the refund and replacement policy for file correction, replacement and download assistance. Keep the product name and your order reference when requesting help.
Which software does the workbook use?
The documented file is an Excel workbook (.xlsx). Compatibility with other spreadsheet applications is not established by the file extension.
Read the planning guides
Explore the relevant operating questions and how to interpret a workbook’s assumptions.
What limits drive-through sales: the lane, the crew, or production?
Compare two drive-through planning cases to see how peak demand, ordering, handover, and paid production capacity determine fulfilled vehicle orders.
Read the guideIs a drive-through burger restaurant the right business idea for you?
Assess a drive-through burger concept through its customer occasion, site, menu, paid team and evidence before choosing this operating format.
Read the guideHow to open a drive-through burger restaurant from site to service
Verify the drive-through site, access, lane workflow, kitchen and crew before tying an opening date and funding plan to a compact burger restaurant.
Read the guideEvidence and scope
Operationally specified by the analyst. An active local operator, commercial demand and legal permission require separate validation.
The links below provide operating-format context; they do not verify the workbook’s selected inputs or calculated returns.
The workbook guide and figures describe model PHY006-03, revision r01, for January 2027–December 2031. These are a documented planning case, not observed results for a particular business.