The dinner-show restaurant case models a U.S. venue with a 150-guest ceiling and an internally produced original comedy or mystery. Its Base forecast covers January 2027–December 2031, opening in March 2027. The selected prices, ticket mix, show frequency, and workload budgets are analytical case assumptions in USD.
What does one inclusive ticket buy?
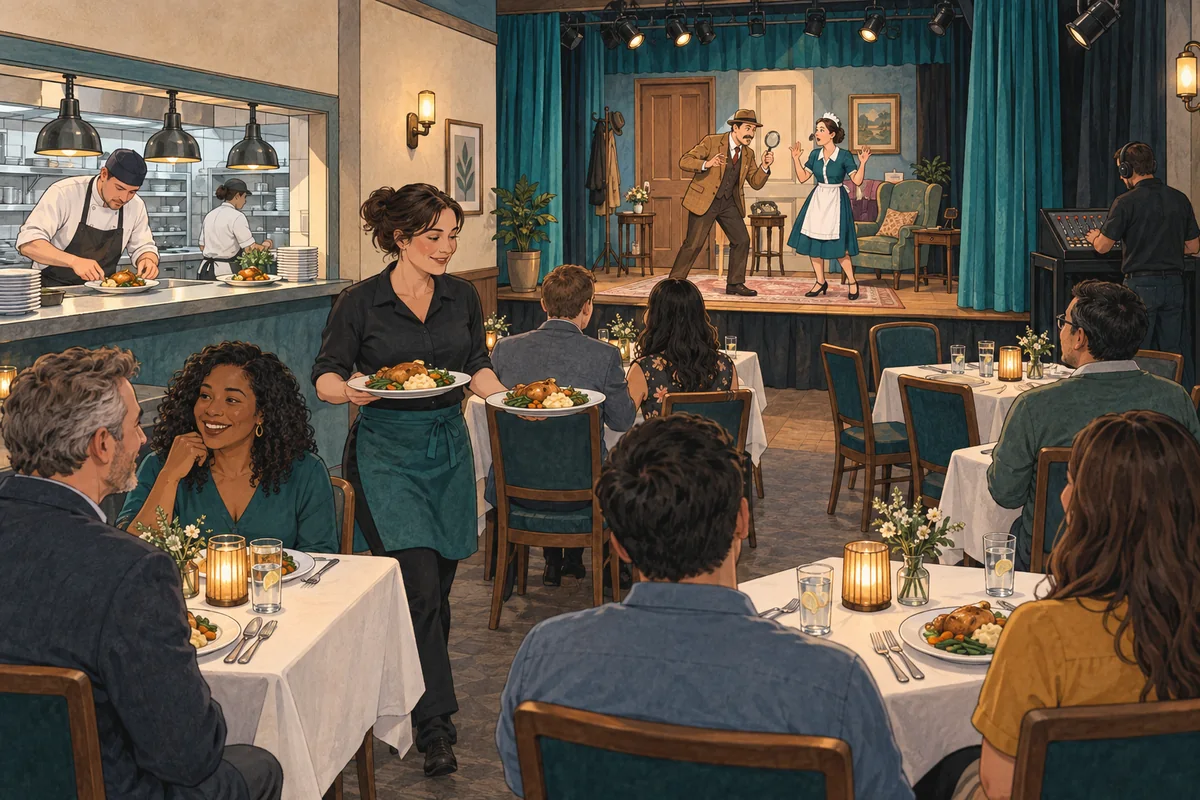
Each paid ticket includes one performance and a complete chicken dinner, with sides, dessert, and specified nonalcoholic beverages. Revenue is earned once when the show is delivered. The included meal does not generate a second restaurant sale, and the case does not include alcohol, licensed musicals, or show-only tickets.
The 2027 price mix is 75% adult tickets at $72, 15% senior/student tickets at $65, and 10% child tickets at $42. That produces $67.95 per paid guest: 75% × $72 + 15% × $65 + 10% × $42. This is the selected forecast mix, not a measured audience composition.
How do complimentary guests affect the seat and meal budget?
Complimentary attendance equals 2% of paid attendance in the case. Those guests earn no ticket revenue but occupy the same room and receive the same complete meal allowance. Paid attendance is a whole number at show level; tier and complimentary allocations are forecast expectations and can be fractional.
On a narrow screen, scroll within the table to read all columns.
| Quantity | Calculation | Result |
|---|---|---|
| Adult ticket revenue | 75 × $72 | $5,400 |
| Senior/student ticket revenue | 15 × $65 | $975 |
| Child ticket revenue | 10 × $42 | $420 |
| Total earned package revenue | 100 × $67.95 | $6,795 |
| Complimentary guests | 100 × 2% | 2 guests; no ticket revenue |
| Total seats and meals used | 100 + 2 | 102 |
| Meal food cost | 102 × $7.8647903983 | $802.21, rounded from the full-precision unit cost |
The room’s isolated paid-ticket ceiling is therefore 147, obtained by rounding 150 ÷ 1.02 down. At that level, expected total attendance is 149.94; 148 paid guests would imply 150.96 total guests. This is only the seating bound. Synchronized meal output and funded show staffing can set a lower limit.
The selected meal cost includes its procurement and waste allowance once. With complimentary meals included, food costs about $8.02 per paid guest, or 11.81% of the $67.95 package. That percentage uses meal-and-performance revenue as its denominator. It does not measure a standalone meal margin or show that the performance can be provided without cost.
Which performance hours must be funded?
The selected Wednesday–Sunday calendar normally creates 20–23 shows in a complete month, with one show per selected date. It is a planning expansion of the source format, not evidence that an audience exists for every added performance. Adding show dates has to be supported by both demand and the paid production budget.
The peak 23-show budget funds four concurrent actors and two technicians, each with 20 paid rehearsal hours per month. It also funds the kitchen, servers/ushers, dish staff, cleaning, management, writing/directing, and booking work. A paid relief and training allowance is already included; the relief roster does not create a second duplicate wage budget.
At full staffing and 2027 rates, the recurring loaded payroll input is $93,151.43 per month. That is a steady operating budget, not the first forecast year’s monthly average: hiring and preparation begin at different dates. Lower attendance does not automatically release those salaries or rehearsal hours. A licensed production would also need its own rights and cost assumptions; this case uses original work.
How do prepaid cohorts differ from earned show revenue?
After the initial no-opening-advance setup, the case assumes 60% of planned purchases are paid in full one month before the show and 40% are paid at service. These are separate order cohorts. The assumption does not mean every buyer pays a 60% deposit and then a 40% balance.
For an illustrative later show with the same 100 paid guests and $6,795 package value, the prepaid cohort contributes $4,077 and the service-paid cohort contributes $2,718. The table assumes the whole show is either delivered or canceled and keeps the ticket mix constant.
On a narrow screen, scroll within the table to read all columns.
| Event | Cash movement | Earned revenue or obligation |
|---|---|---|
| Prior-month purchases | Receive $4,077 from fully prepaid orders | $4,077 remains a customer advance until delivery or refund. |
| Show delivered | Receive the service-paid cohort's $2,718 | Earn $6,795 in total and release the prepaid obligation. |
| Alternative: entire show canceled | Refund the original $4,077; collect no $2,718 | Earn no revenue from that canceled show. |
Original successful-charge processing fees remain expenses after a refund. The forecast has no separate no-show input, so it should not be used to infer a no-show revenue policy. Both the customer terms and the collection timing must match the offer actually being planned.
What should be checked before expanding the schedule?
Check funded rehearsal, performance, meal-release, and support hours alongside the total guest ceiling. Then examine the cash obligations created by future shows. The saved case closes December 2031 with $121,751 of advances for January 2032 performances; the future delivery or refund obligation remains even though those shows fall outside the forecast.
Use the dinner-show model to trace these linked commitments. The event deposit guide describes a different partial-deposit arrangement; its payment rules should not be substituted for this case’s fully prepaid and service-paid cohorts.