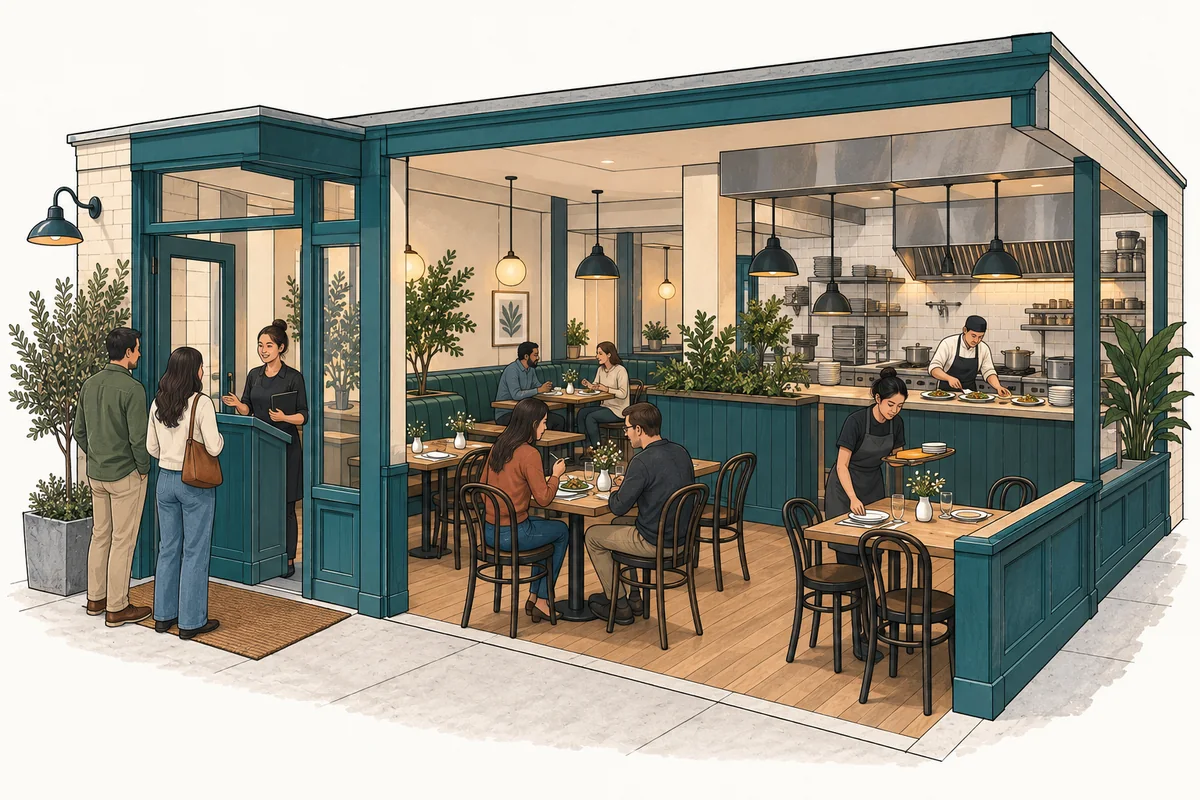
Two selected U.S. 2027 Base cases illustrate the distinction: a 90-seat buffet and a guest-cooked Korean BBQ restaurant with 20 private tables. Their quantities and tariffs are planning assumptions for those cases. Their food units, billing rules, and capacity calculations are different, so the same loss percentage cannot simply be copied between them.
What earns revenue when refills are included?
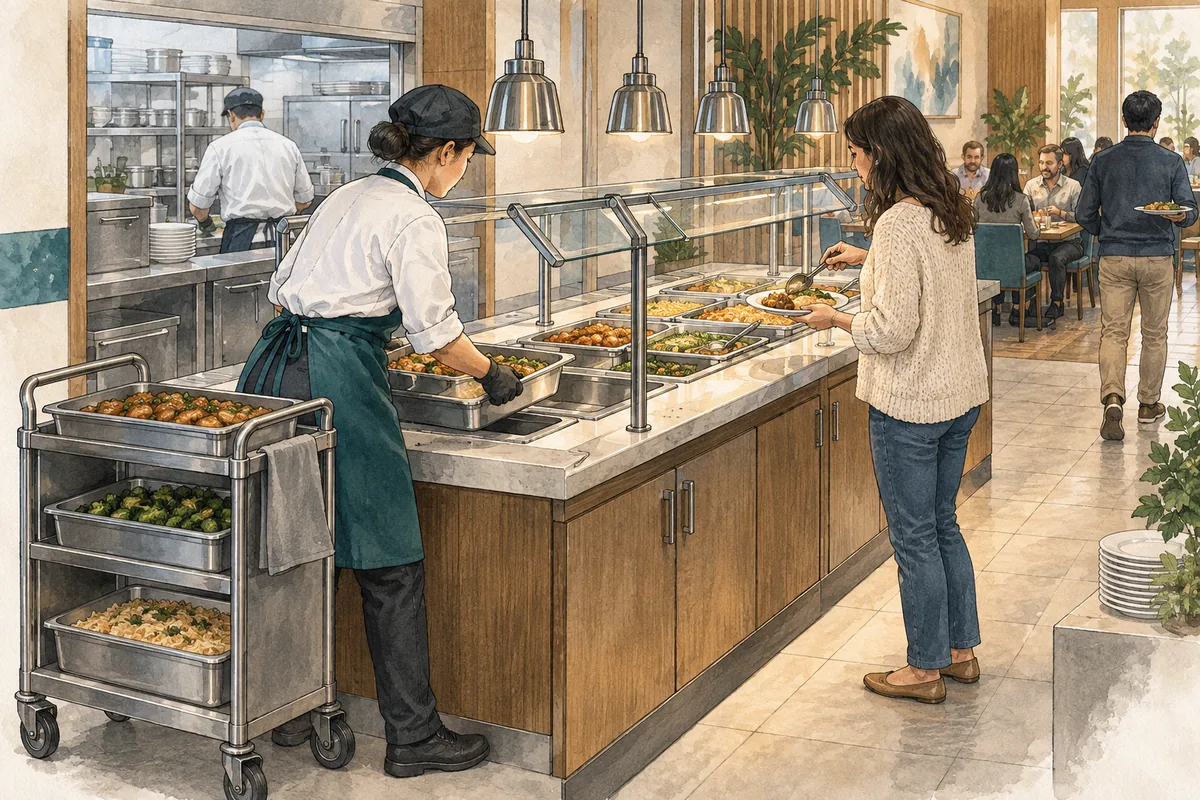
The buffet charges $22 per adult and $11 per paid child, with a separate complimentary-guest category. Included food, desserts, and soft drinks do not generate separate refill sales. Adults consume a selected 0.50 kg in first portions plus 0.30 kg in repeats; paid children consume 0.30 + 0.15 kg. Complimentary guests consume 0.25 kg each.
All three buffet guest classes use seats, food, and service consumables. Leaving free visits out of the operating forecast would understate required resources even though those visits contribute no admission revenue. The kilogram inputs are homogeneous food-equivalent planning quantities, not measured appetite averages.
The Korean BBQ case sells one $32.99 dinner package per paid guest. Optional drinks add $3.75 at an expected 0.55 purchases per guest, giving $35.0525 of expected net revenue per guest. That average is not the amount of every individual bill. Included meat reorders do not create another package sale, and this case has no separate child or complimentary category.
Why do the two cases use different food-loss formulas?
For the buffet, an adult’s 0.80 kg of consumption requires 0.80 ÷ 90% ÷ 90% = approximately 0.988 raw-equivalent kg. The first division allows for buffet holding and plate loss; the second allows for preparation yield. These losses affect different stages. Adding them together as a generic 20% uplift would produce a different quantity.
Korean BBQ instead starts with 16 usable raw ounces delivered per guest, already including food left on guests’ plates. A 5% additive post-preparation excess is prepared relative to that delivered recipe. Dividing by the 90% raw-trim yield gives 16 × 1.05 ÷ 0.90 = approximately 18.667 purchased raw ounces. Cooking shrinkage and plate waste are not charged again.
On a narrow screen, scroll within the table to compare both selected formats.
| Operating decision | Buffet | Guest-cooked Korean BBQ |
|---|---|---|
| Billable unit | One adult or child admission | One paid-guest package, plus optional drinks |
| Complimentary diners | Separate food and seat demand | No complimentary category modeled |
| Included consumption | Adult 0.80 kg; child 0.45 kg; complimentary 0.25 kg | 16 usable raw protein ounces per guest; reorders included |
| Loss calculation | Consumption ÷ 90% holding survival ÷ 90% preparation yield | Delivered raw protein × 1.05 excess ÷ 90% trim yield |
| Paid food-handling work | Cooking and buffet replenishment in prepared kilograms | Prep handles 4.2 four-ounce equivalents; runners deliver four per guest |
| Dining constraint | Shared seat-minutes across all guest classes | Integer private-table visits with readiness, service, and reset scheduling |
The Korean BBQ excess is 5% of the served recipe, not 5% of purchases. Its prep team handles 4.2 four-ounce equivalents per guest, while runners deliver four. Keeping those quantities separate identifies where work and loss occur instead of applying one inflated food quantity to every task.
Which resources limit the number of visits?
Buffet demand encounters three shared limits: dining seat-minutes, prepared food from the kitchen, and staffed buffet replenishment. Replenishment uses a selected two productive minutes per prepared kilogram. One common fulfillment fraction applies across adult, child, and complimentary demand, followed by rounding down to whole visits. Repeats can therefore constrain admissions through food-handling demand.
The Korean BBQ case needs a feasible table schedule as well as food and staff capacity. Target fill is three guests per private-table visit, without sharing tables between unrelated parties. Consequently, 179 fulfilled guests still require 60 visits. Four physical seats at each table do not imply four paid guests at every visit.
Its selected table cycle totals 135 minutes: 120 dining minutes, five active reset minutes, and ten passive minutes. The baseline daily schedule supports 60 visits, or at most 180 guests at target fill, within eight service hours. Paid readiness, grill changes, preparation, runners, servers, and warewashing must also fit. Guest cooking does not eliminate that work.
What should be measured before comparing the economics?
For a buffet, measure first portions, repeat consumption, guest-class mix, and losses at the stages where they occur. For Korean BBQ, distinguish raw trim, prepared excess, delivered protein, table fill, and repeated handling. Pooling these observations into a single “food waste” percentage hides the operating decision that could change the cost.
The buffet model and guest-cooked Korean BBQ model provide separate structures for those decisions. Compare each case’s admission contribution with its own paid staffing, occupancy, and capital needs. A larger package price or lower ingredient percentage alone cannot establish stronger economics.
These planning calculations do not prescribe food handling or determine actual demand. The buffet uses monthly aggregate resource limits, while Korean BBQ explicitly schedules private-table visits. Neither structure establishes that a particular location will sell every available visit or recover its initial investment.