
Restaurant Financial Model: Fixed-Menu Session Restaurant
Plan scheduled sittings, synchronized courses, attendance, no-show food costs and optional pairings for a fixed-menu restaurant.
- Excel (.xlsx)
- Room: 1,800 sq ft / 32 seats
- Offer: Five courses / $125 starting menu
- Schedule: Two evening sessions Wednesday–Sunday
- Opening: March 2027 / 60-month financial forecast
Planning several types? Compare 17 restaurant formats
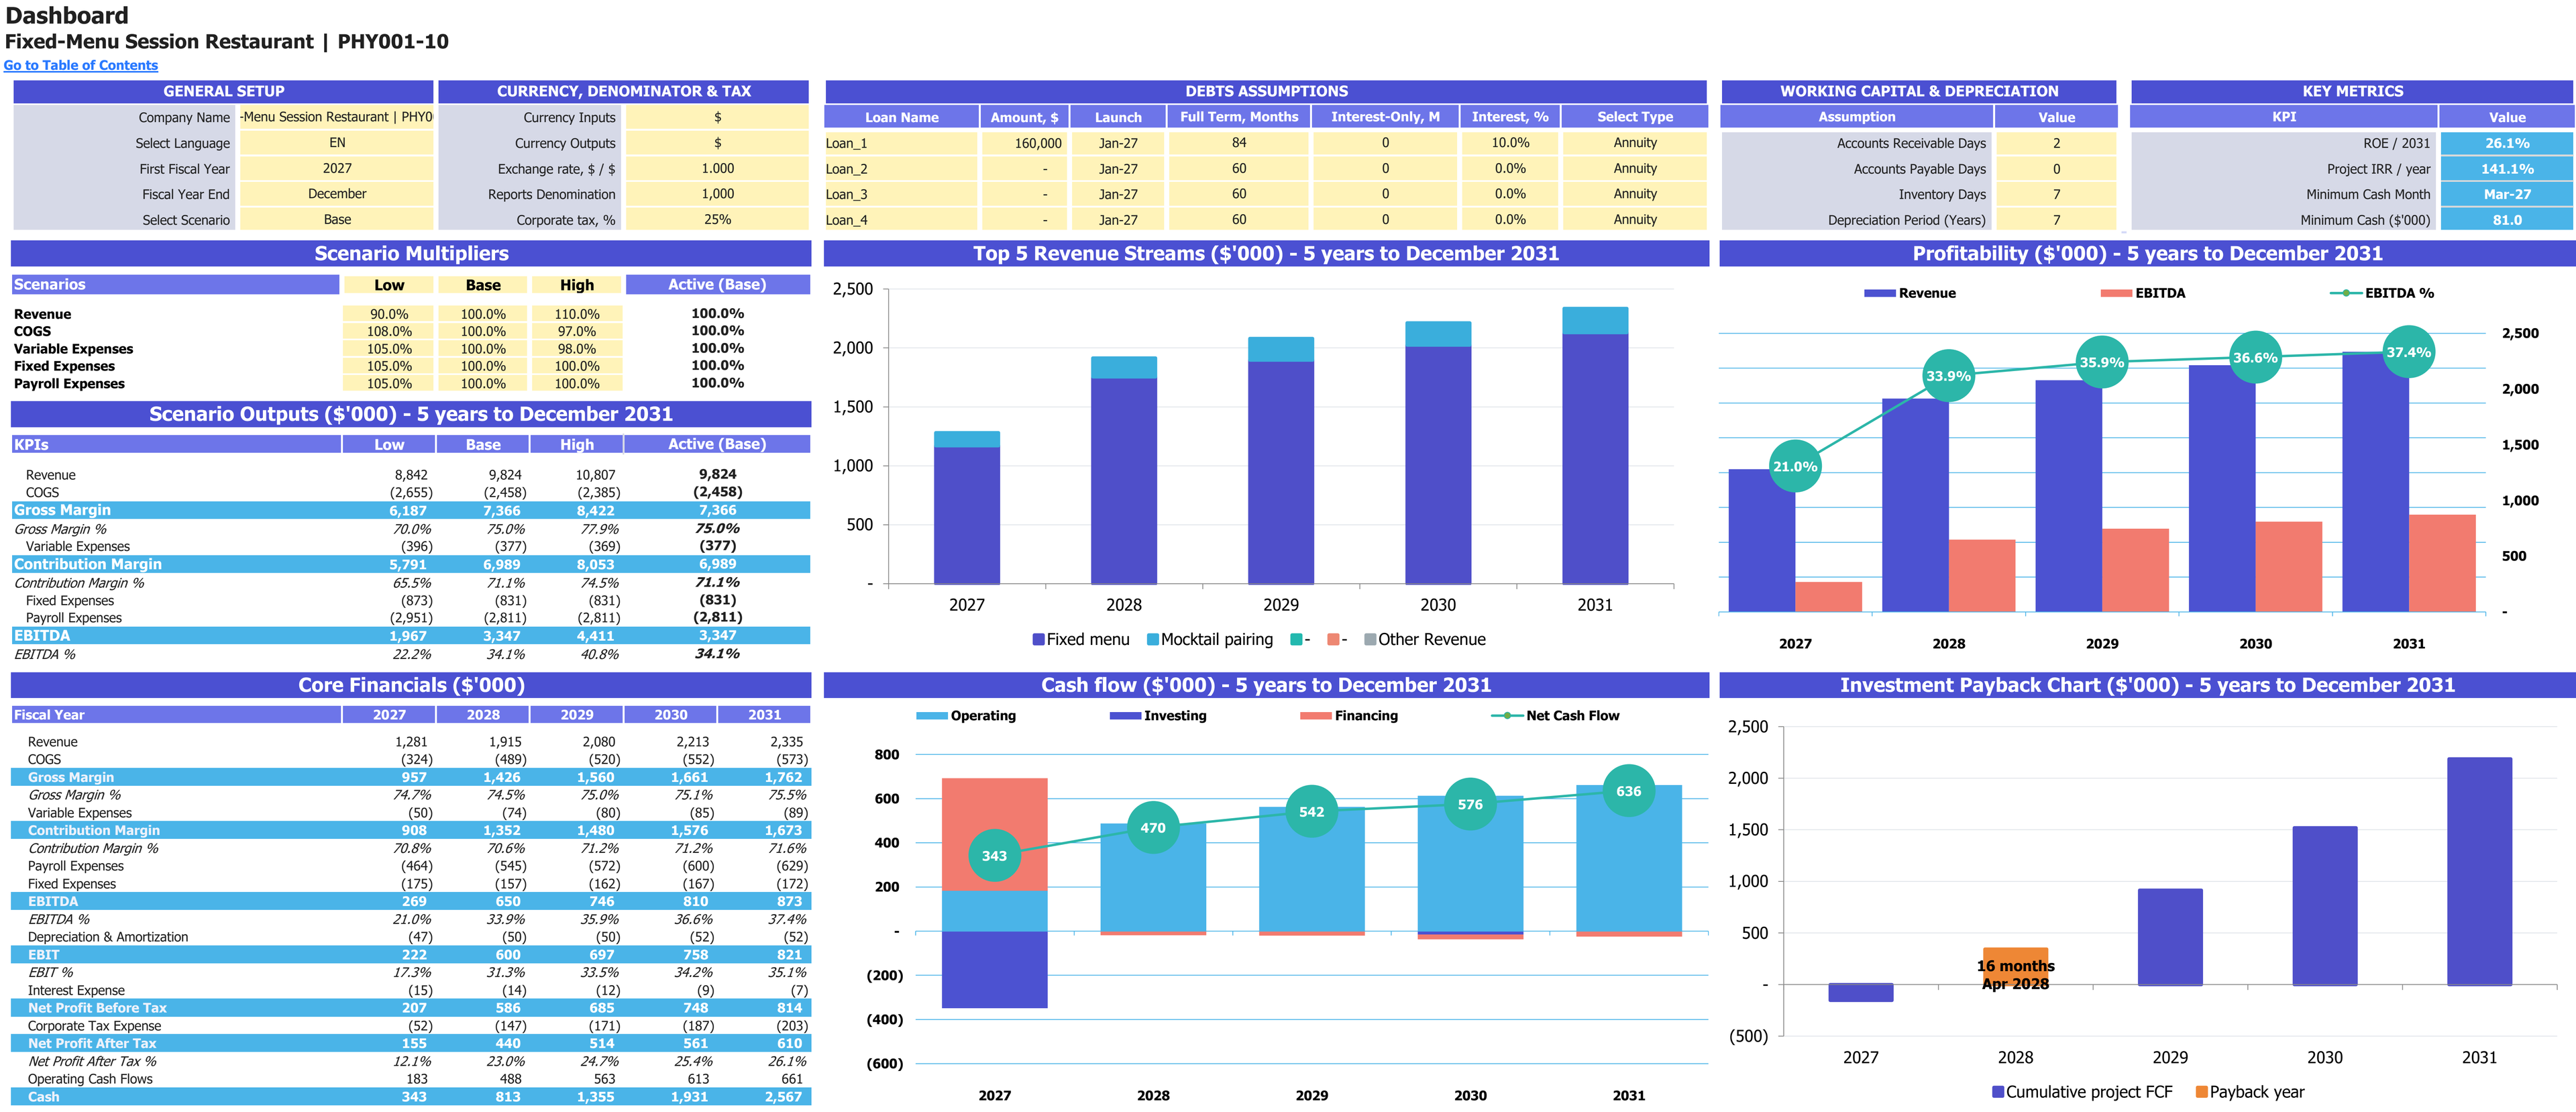
Base-case scenario controls, annual financial results and charts for 2027–2031. Financial report amounts are shown in thousands of USD; percentage measures retain their own units.
Enlarge image in a new tab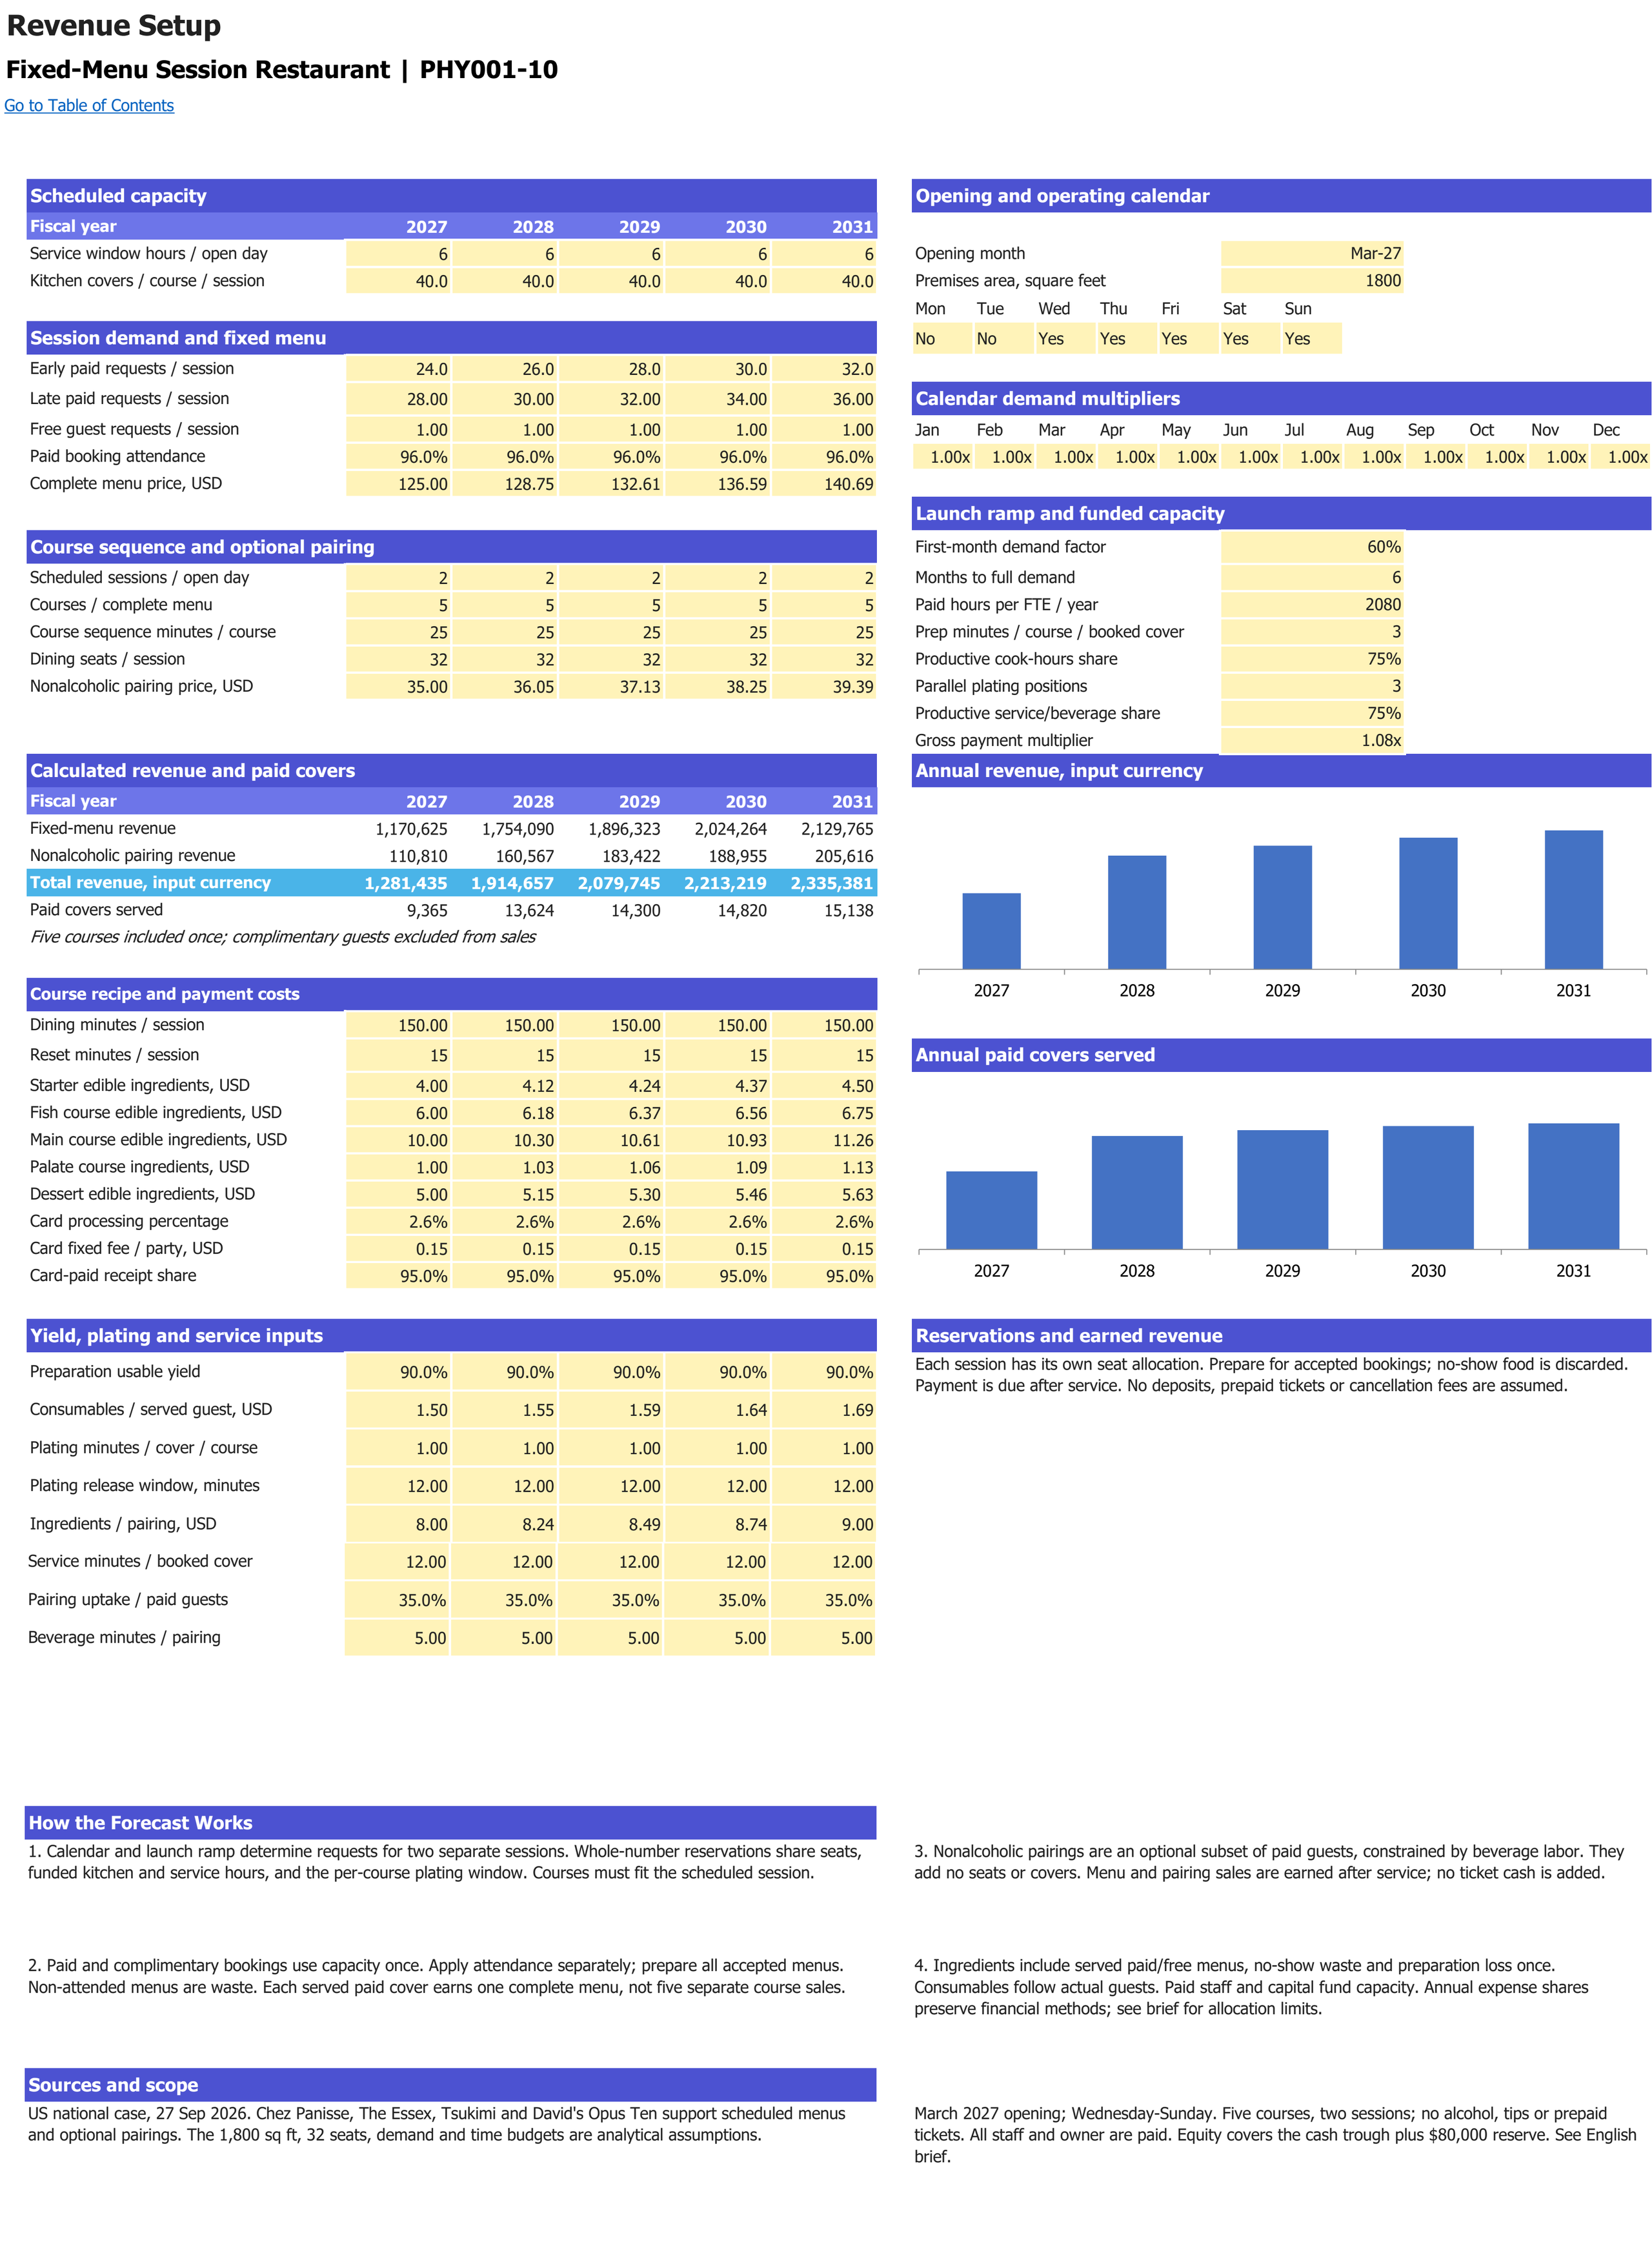
Scheduled dining sessions, guest demand and included fixed-menu service assumptions. Monetary inputs and sales use USD; operating volumes retain their labelled units. Forecast years are 2027–2031.
Enlarge image in a new tab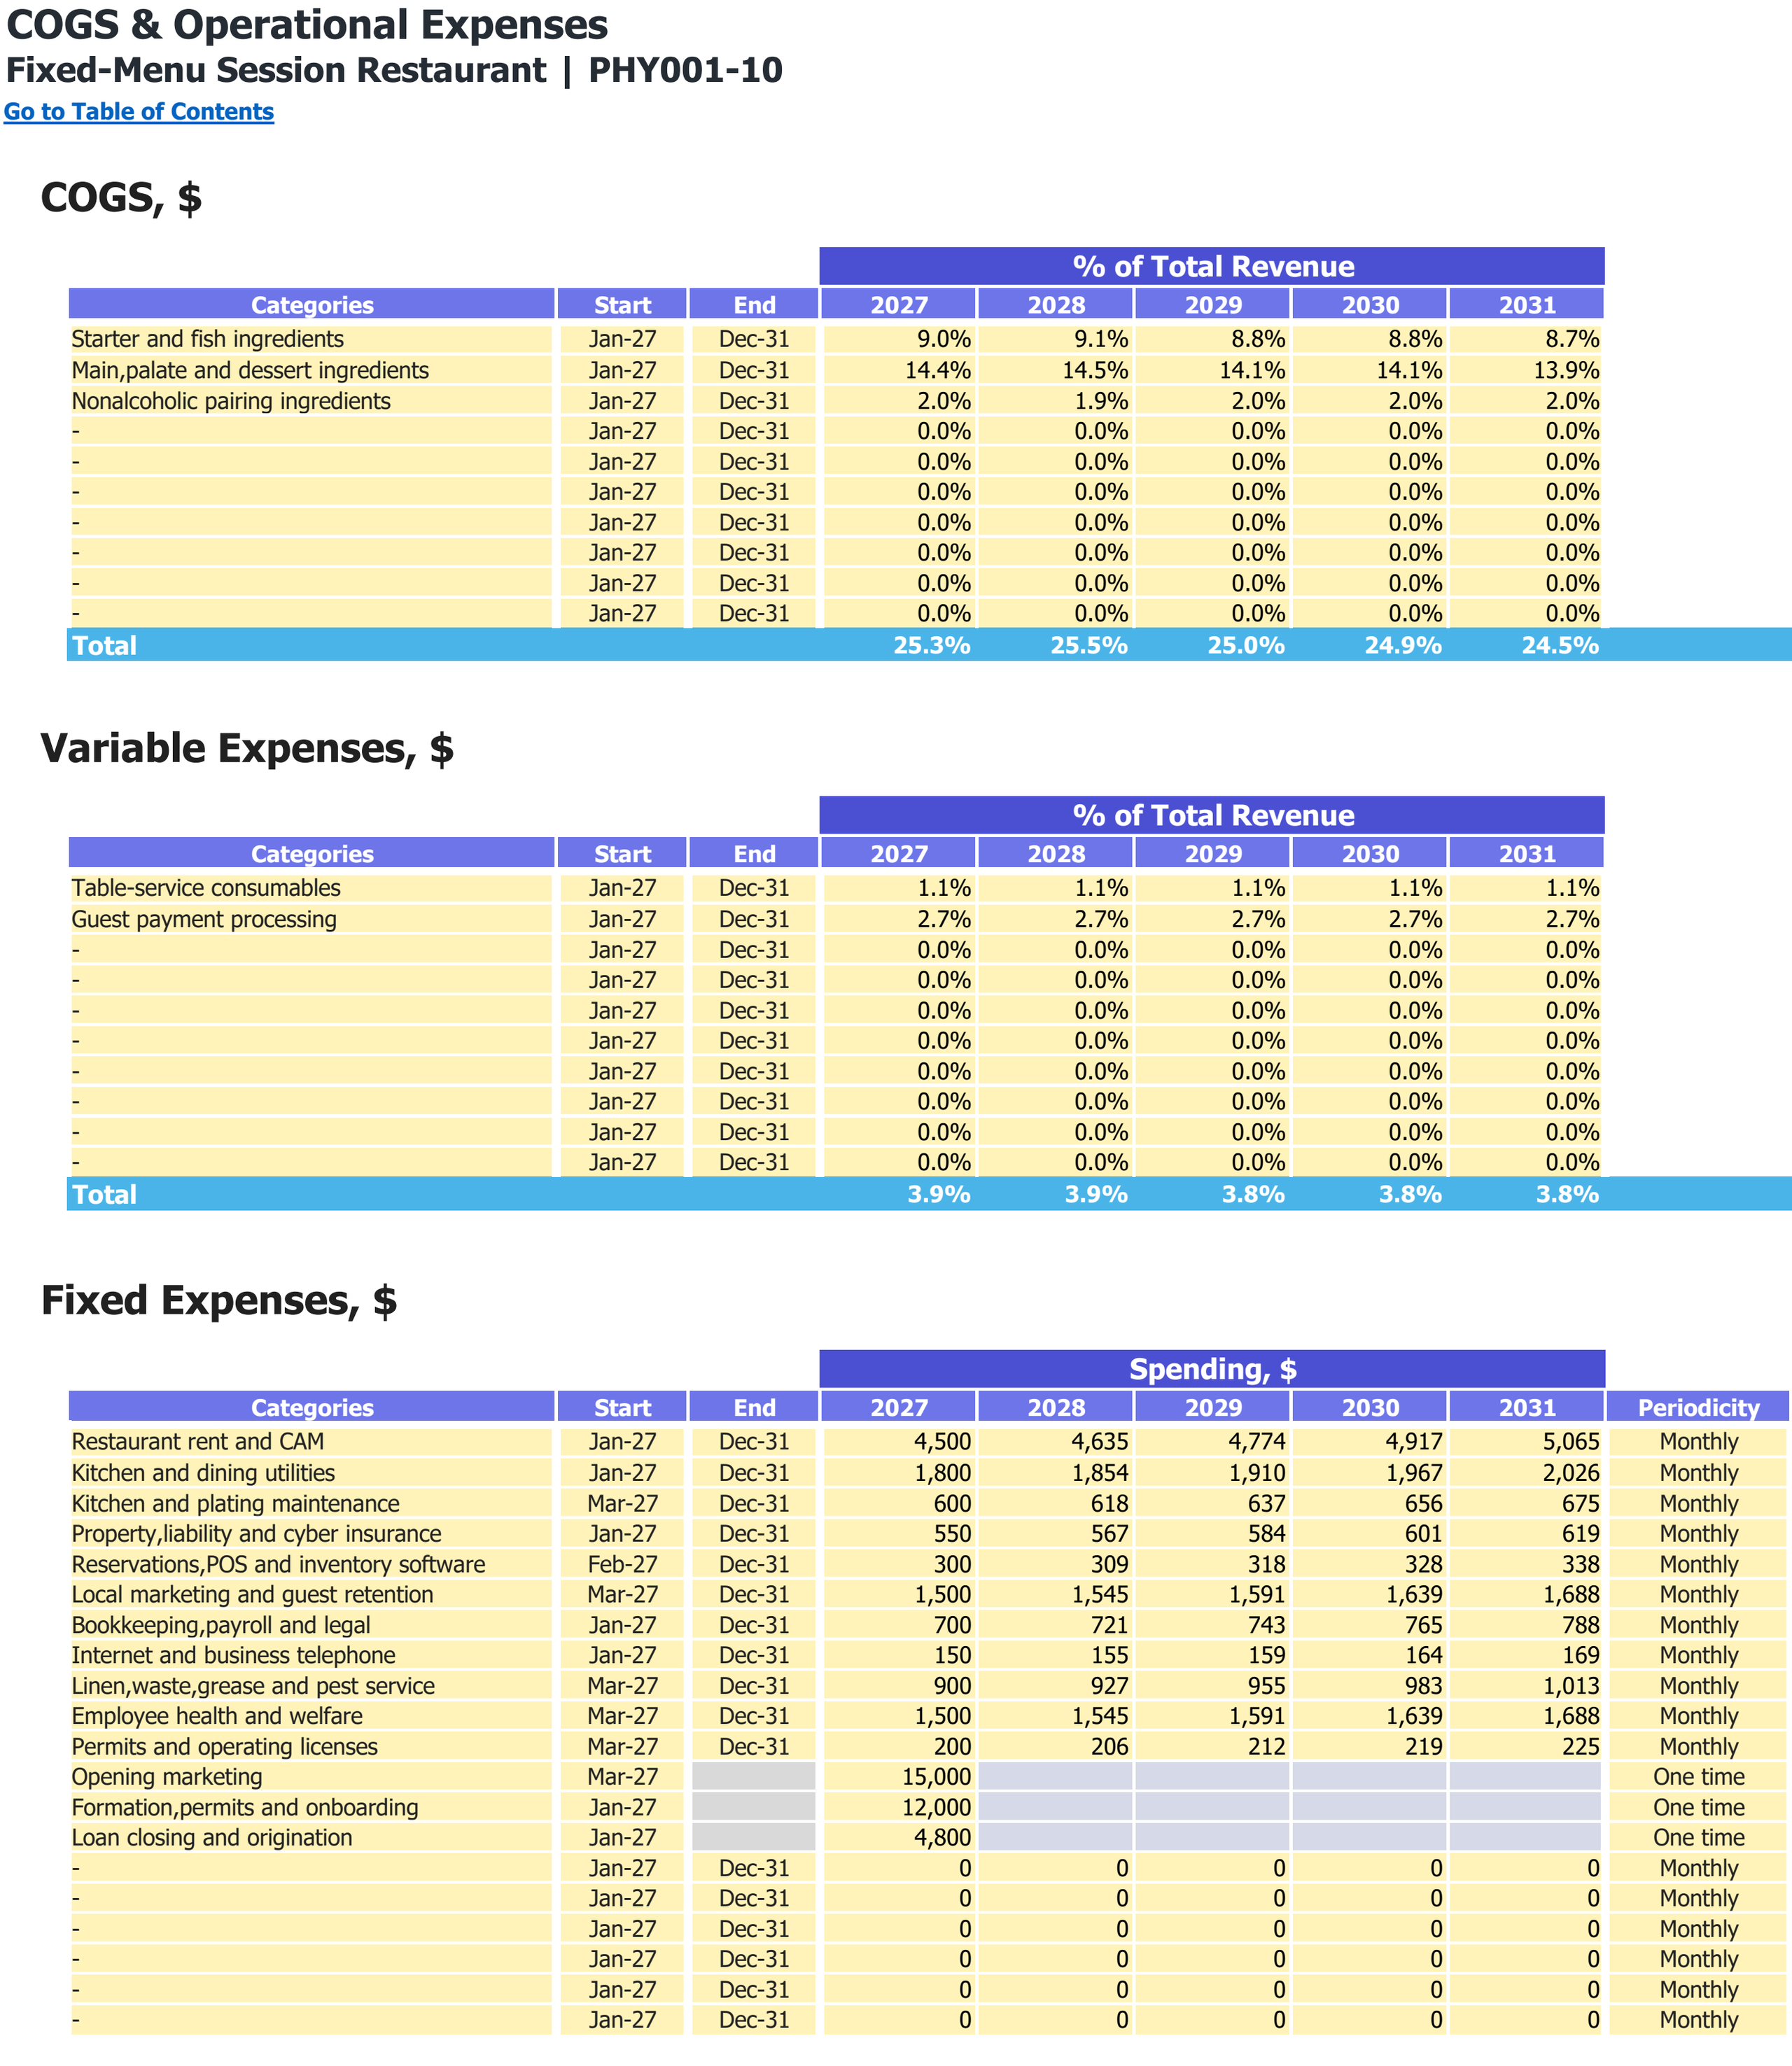
Food and other direct-cost categories, variable expense shares and fixed operating expenses. Monetary inputs are USD; the annual percentage columns are cost shares of revenue.
Enlarge image in a new tab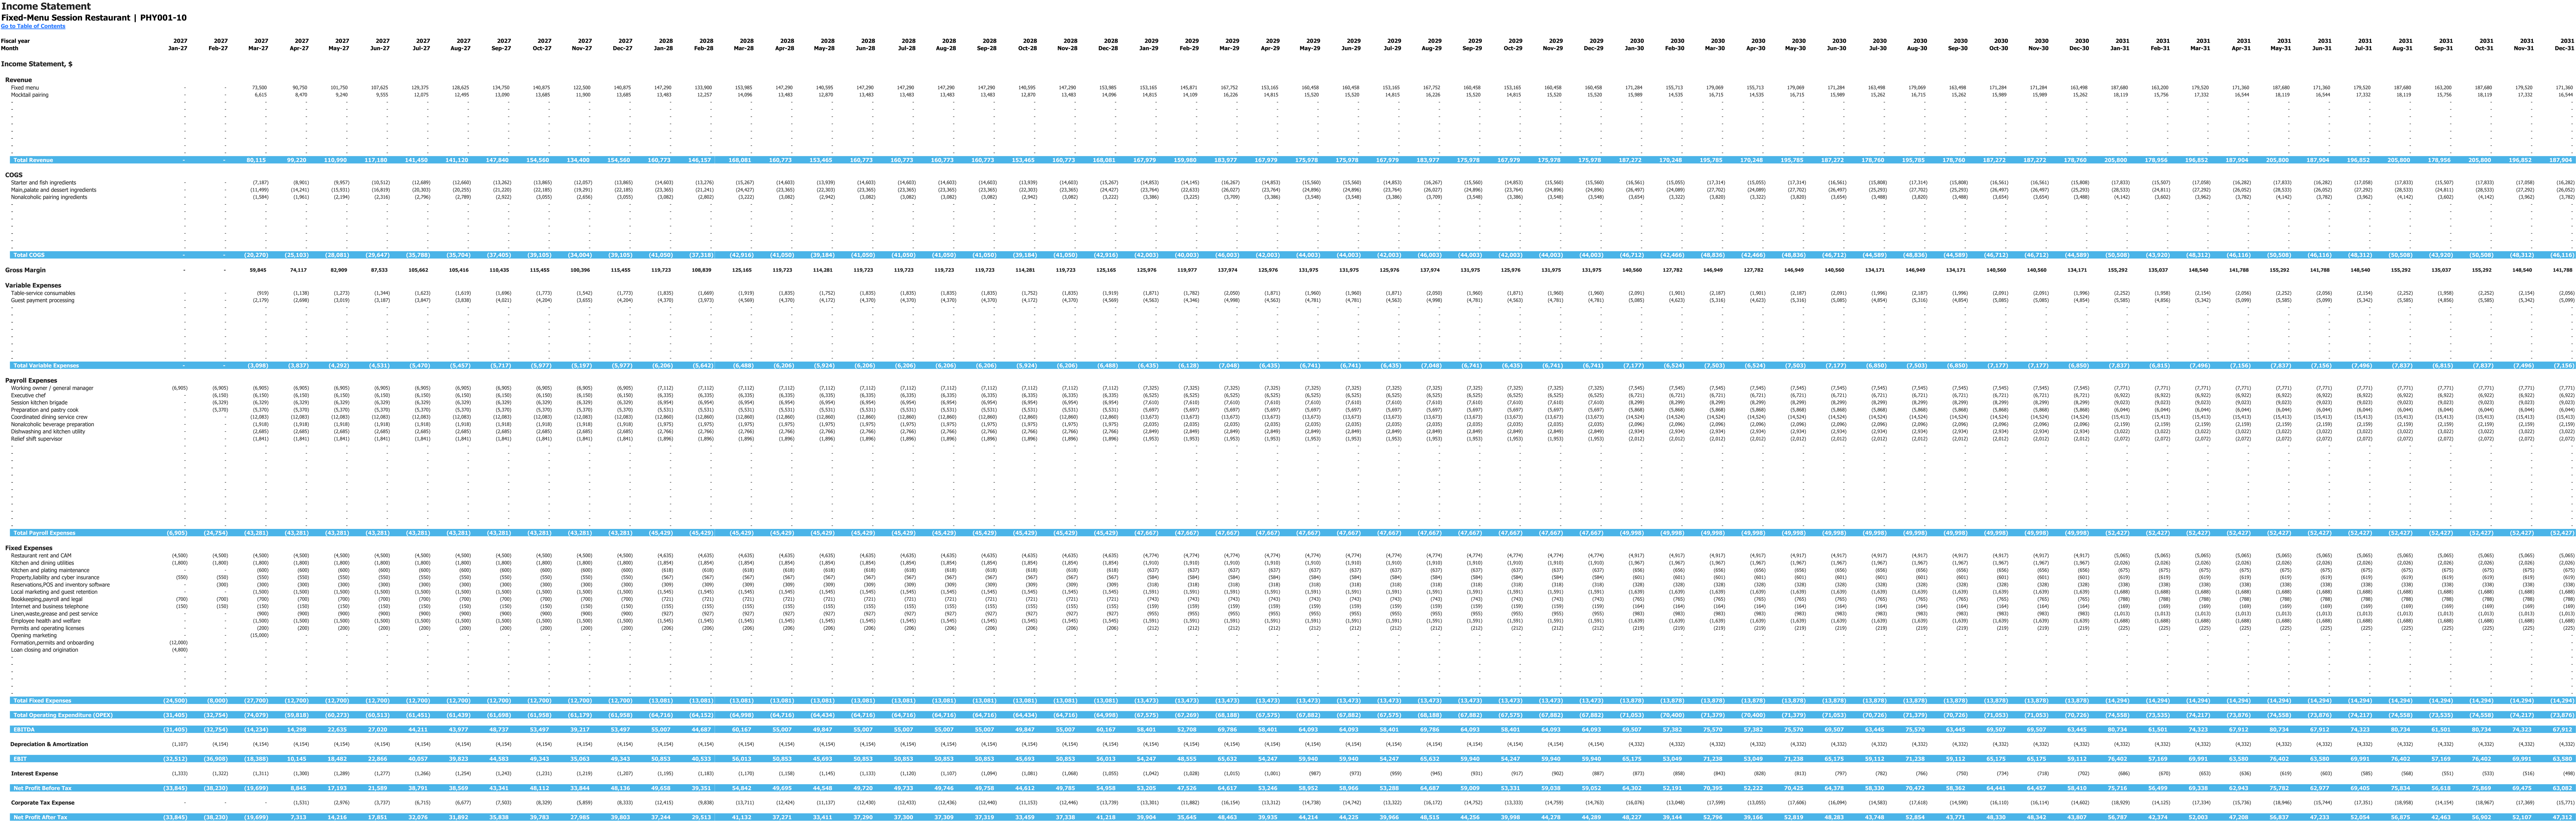
Monthly income statement for 2027–2031, in USD. This is an income statement view; it does not show payroll setup inputs. Enlarge to inspect the wide monthly table.
Enlarge image in a new tab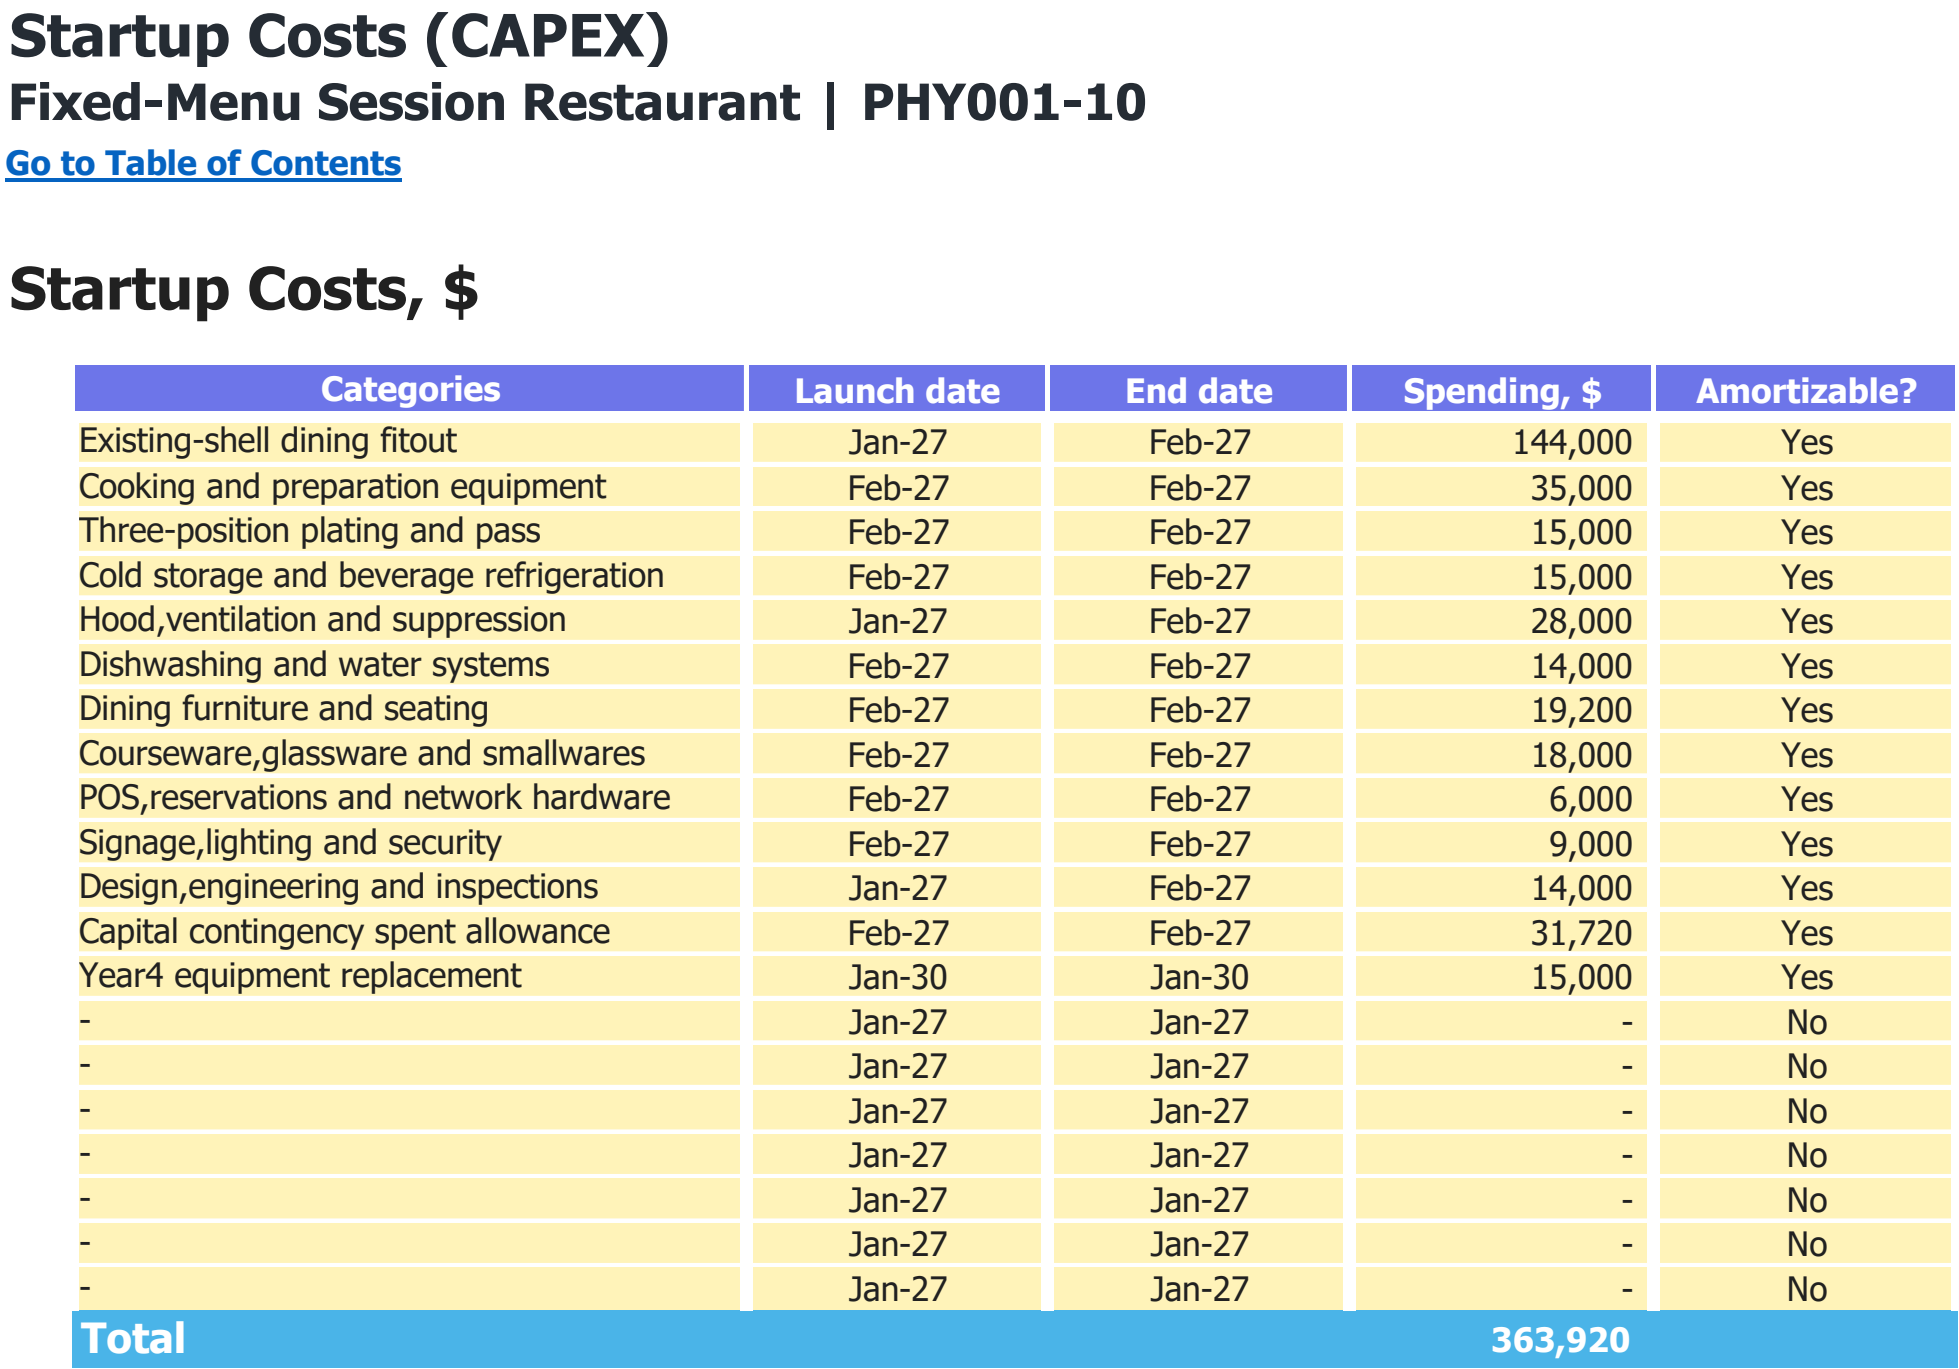
Asset categories, purchase dates and spending assumptions in USD. The total includes every scheduled purchase shown, including later replacements where present.
Enlarge image in a new tab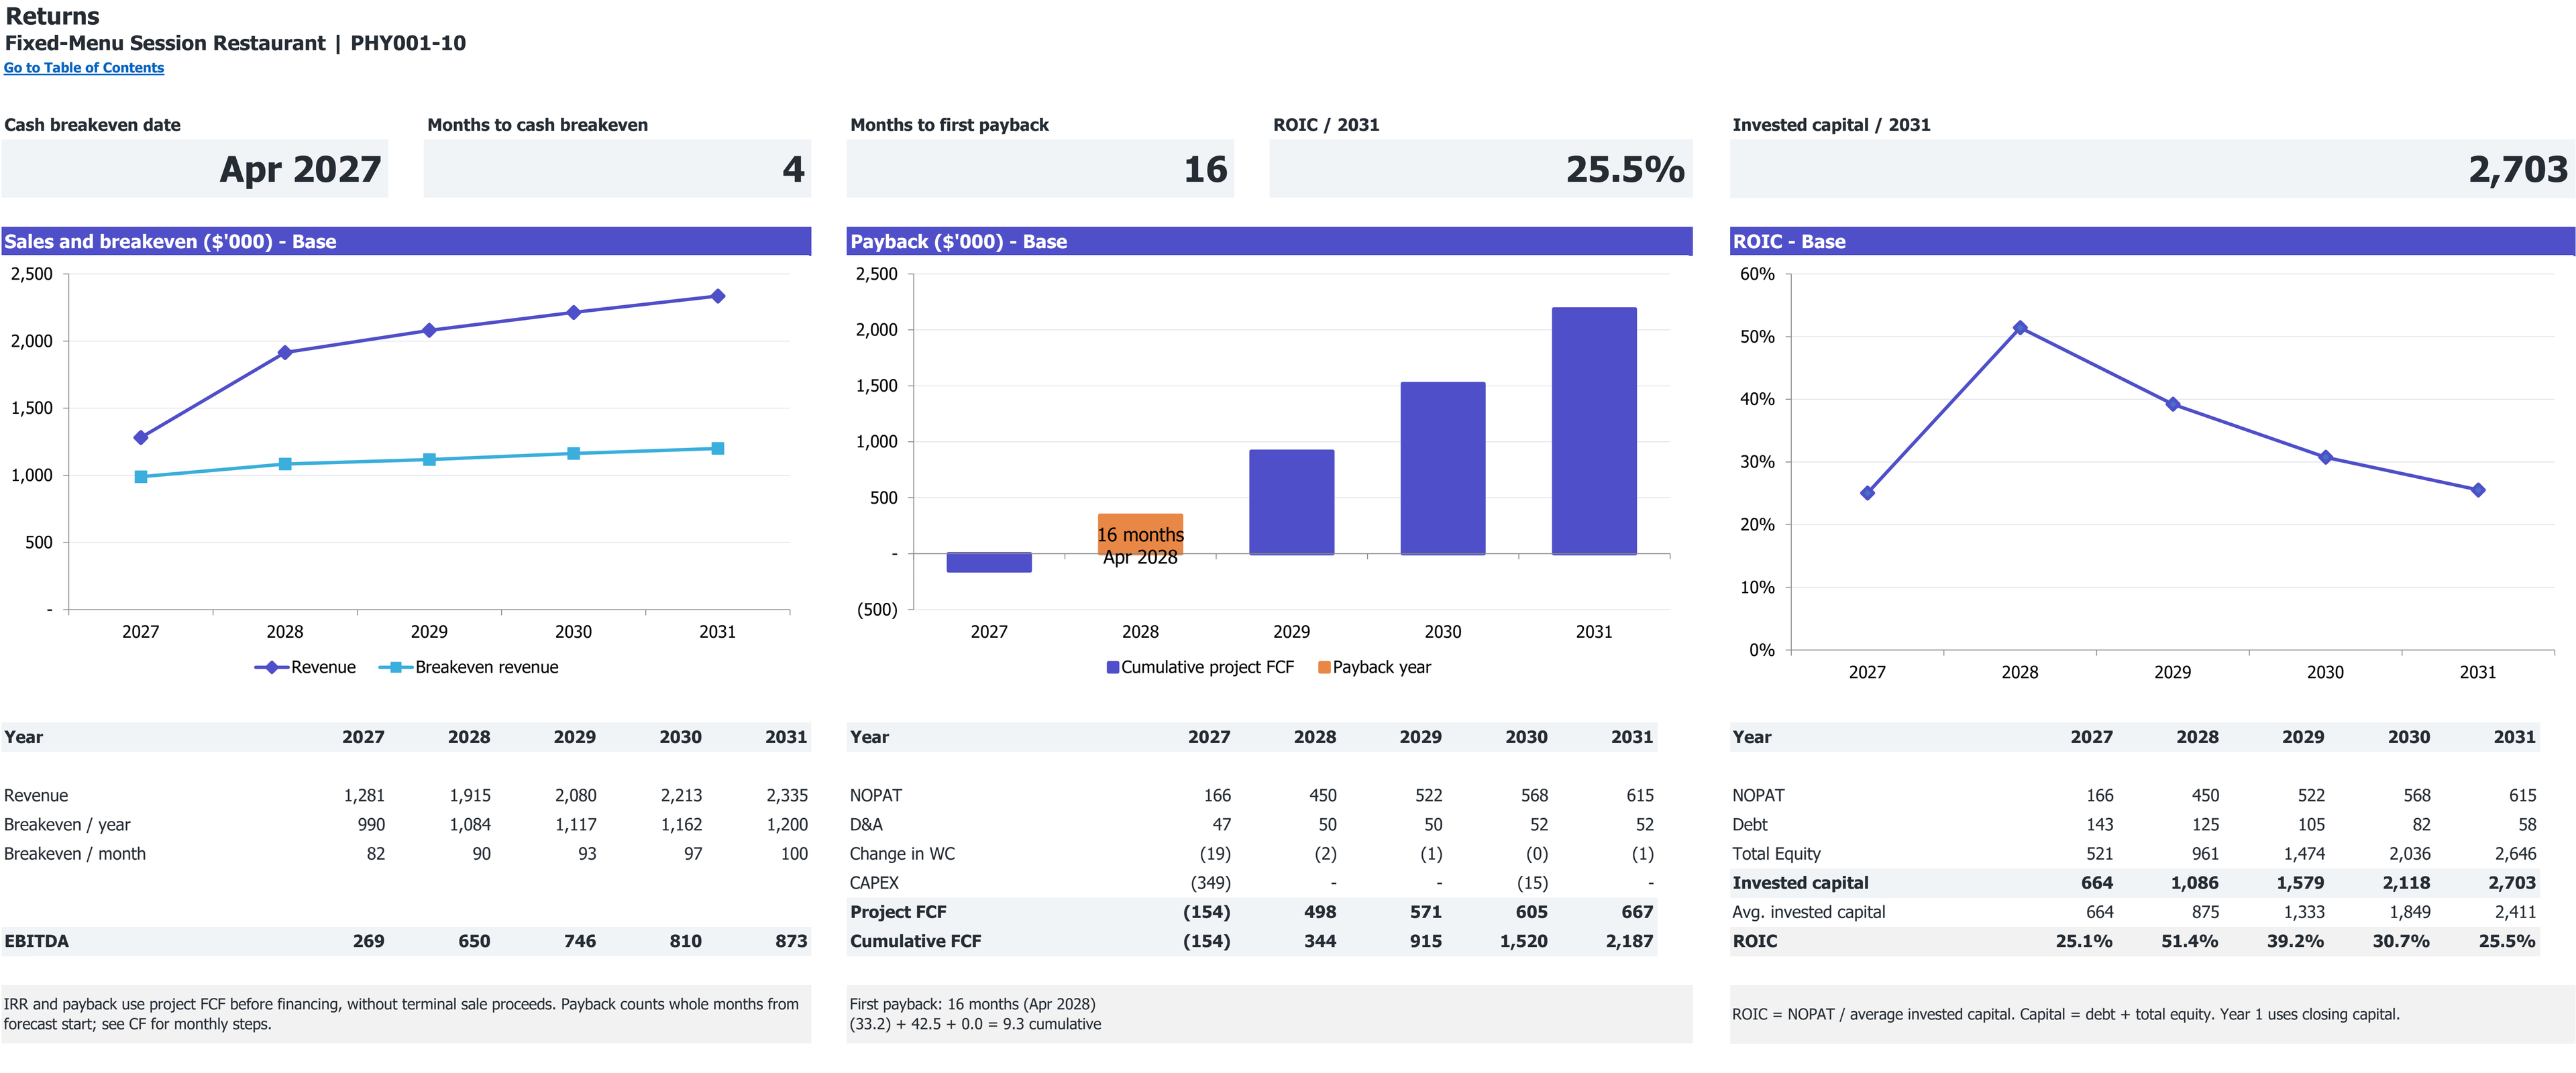
Excerpt from Returns: cumulative project free cash flow and first payback, if reached. 2027–2031 base case; dollar amounts in thousands.
Open full Returns view in a new tabExcerpt from Returns: revenue, annual and monthly break-even revenue, and EBITDA. 2027–2031 base case; dollar amounts in thousands.
Open full Returns view in a new tab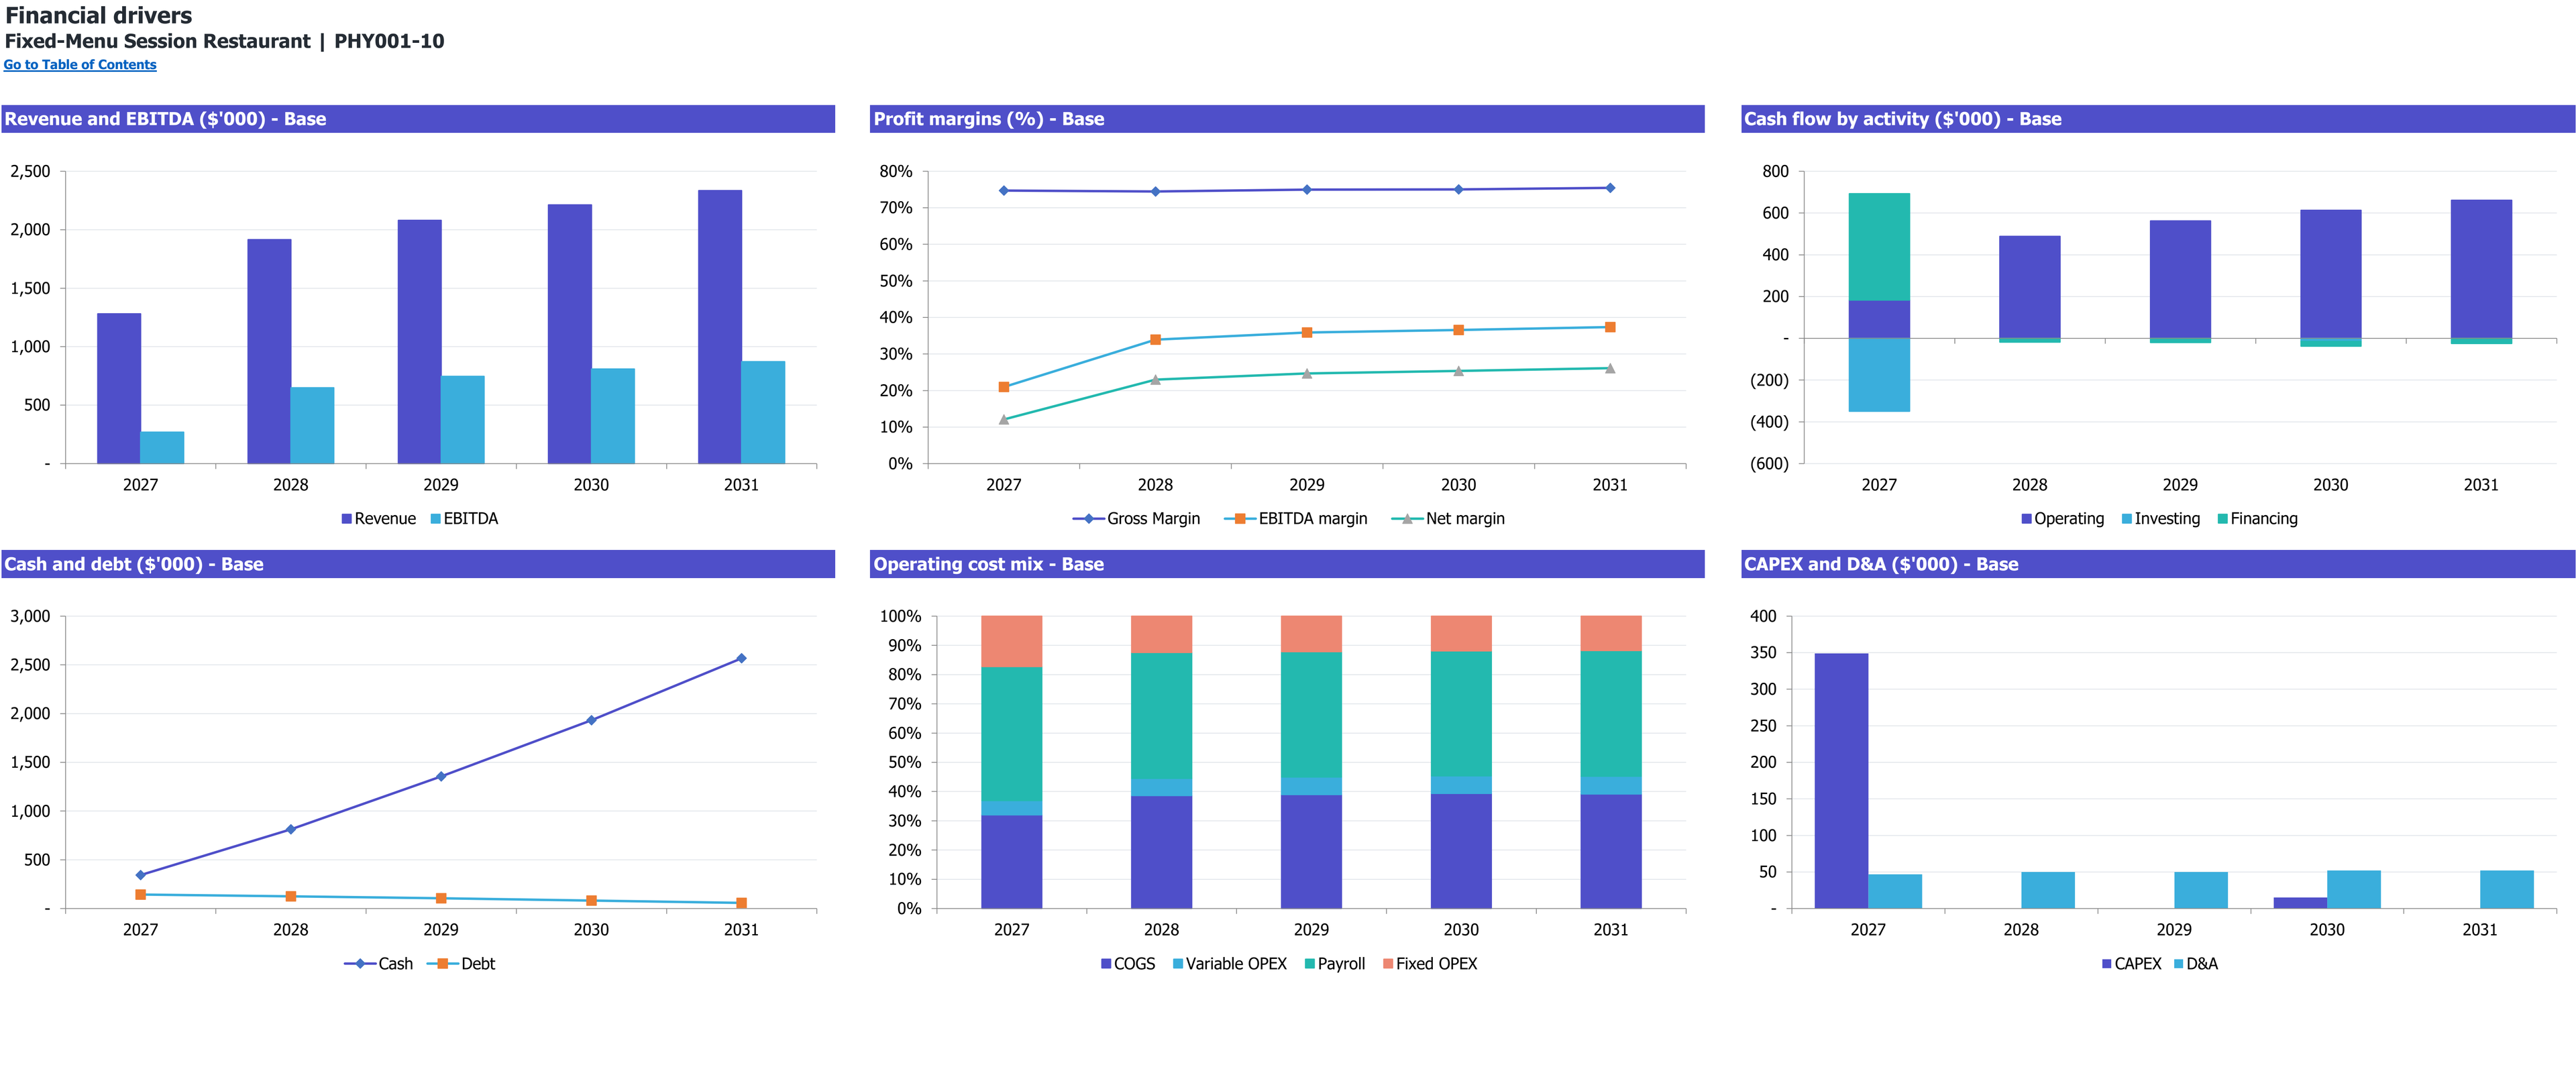
Six annual financial-driver charts for Fixed-Menu Session Restaurant, 2027–2031 (Base scenario). Dollar amounts are in thousands; margins and cost mix are percentages.
Enlarge image in a new tab8 selected worksheet views. Figures show this workbook’s starting case.
Workbook availability
What is inside the Excel model
Test scheduled sittings against dining seats, course-release timing and funded service labor. Follow accepted bookings, attendance and optional pairings through ingredients, investment and monthly cash.
Selected worksheets from the documented workbook. Forecast period: January 2027–December 2031. Model reference: PHY001-10.
Inputs you control. Results you can inspect.
On a small screen, scroll within the table to read every column.
| Planning area | Inputs you review | How they connect | Results to inspect |
|---|---|---|---|
| Session demand | 24 early and 28 late mature paid requests; one free request per session. | Actual operating days and a 60% opening ramp generate separate sitting demand. | Requested paid and complimentary bookings. |
| Timing | 150 dining minutes plus 15 reset; six-hour window; five 25-minute courses. | Session and course schedules must fit the offered service window. | Valid one- or two-session operation. |
| Capacity | 32 seats; 40 kitchen covers/course; three plating positions. | Seats, course release and equally allocated kitchen/service labor limit bookings. | Accepted bookings per sitting. |
| Attendance and pairings | 96% paid attendance; 35% pairing uptake; $35 pairing. | Whole-cover attendance earns menus; beverage minutes cap pairings. | Served paid covers and separately priced pairing units. |
| Recipe and labor | $26 edible five-course basket; 90% yield; 9.6 initial FTE. | All accepted menus consume food, including complimentary and no-show bookings. | Ingredient purchases, waste and funded service capacity. |
| Startup and funding | $348,920 initial CAPEX; $366,000 equity; $160,000 loan. | Cash flow covers opening spending, startup deficits, settlement and loan service. | Reserve, operating milestones and project recovery. |
Is this the right model for your business?
Check the starting case before changing the assumptions.
The starting operation
- An independent restaurant selling a complete fixed menu in scheduled sittings.
- A team assessing synchronized preparation, plating and service instead of continuous table turns.
- An operator separating reservations, actual attendance, no-show food waste and optional nonalcoholic pairings.
Check the boundary
The saved case does not include prepaid tickets, deposits, cancellation fees, alcohol, tips, delivery or extra service-charge revenue.
Compare the other restaurant typesHow this business makes money
Connect the unit sold to the resources required by this operating case.
Revenue logic
Served paid guests earn one complete-menu price, with optional paid nonalcoholic pairings.
Courses are included in the menu. Pairings add sales without adding guests or seats.
What limits a restaurant that releases the same courses to a whole sitting?
A daily cooking total is insufficient. Every course must pass the kitchen and plating line inside a release window, while the complete sequence and reset must fit the session. This design limits bookings by those synchronized constraints, then distinguishes accepted reservations from guests who attend. No-shows still consume prepared-menu ingredients under the selected policy.
- Release window
- Three plating positions × 12 minutes / one minute per plate = 36 covers
- Session schedule
- 150 dining minutes + 15 reset minutes
- Attendance
- 96% paid factor, rounded down separately per sitting
What to establish for your own operation
- Run a full course-release time study rather than relying only on daily kitchen output.
- Validate attendance and premium-price demand with actual booking evidence.
- Keep pairings, menus, guests and prepaid cash as separate concepts; this case has no prepayment.
Follow the plan from demand to cash
Open each section for the assumptions, calculations, and limits of this workbook’s starting case.
Keep booking, attendance and earned revenue separateRevenue
Two scheduled sessions each use 150 dining minutes plus 15 reset minutes inside a six-hour window. Five 25-minute courses fit the sitting. A booking limit takes the lowest of 32 seats, 40 installed kitchen covers per course, 36 plating-release covers and funded kitchen/service budgets allocated equally across the offered sessions.
Paid and complimentary requests share that limit proportionally. Accepted paid bookings then receive a 96% attendance factor and round down per sitting. Only served paid covers earn the $125 starting menu price. Optional $35 nonalcoholic pairings are a subset of served paid guests, constrained by beverage labor. They do not add seats or guests.
- Unused capacity in one session is not automatically reassigned to the other.
- One enabled session admits early demand only; zero sessions stop service.
- Payment is after service. No prepaid ticket or deposit revenue is counted.
Count ingredients for every accepted bookingPayroll
The five-course edible basket is $4 starter, $6 fish, $10 main, $1 palate course and $5 dessert: $26 total. Dividing by 90% usable yield gives $28.8889 raw ingredients per accepted menu. Food is prepared for both regular and complimentary bookings, including no-shows that earn no menu revenue. Preparation loss and discarded no-show menus are measured separately without charging either twice.
The starting 9.6 paid FTE includes the owner, executive chef, kitchen brigade, preparation/pastry cook, dining service, beverage preparation, dishwashing and relief. Owner salary is $74,880 from January. Chef and kitchen preparation start in February; guest service starts in March. Employer load is 10.65%, with a separate $1,500 monthly welfare pool.
- Each sold pairing uses an $8 ingredient allowance; each served guest uses $1.50 consumables.
- Initial rent/CAM is $4,500/month; full wages are paid without tip credit.
- Annual cost shares reconcile yearly totals but can alter monthly costs; maximum Base ingredient allocation difference is $655.65.
Fund the synchronized service setup and reserveCAPEX
Initial CAPEX is $348,920: $317,200 base assets plus $31,720 spent contingency. It includes a $144,000 reused-shell fitout, cooking, a three-position plating/pass setup, refrigeration, ventilation, warewashing and courseware. January 2030 adds $15,000 replacement spending. Actual installed prices and service performance need confirmation.
The financing package is $526,000 in January: $366,000 equity and a $160,000 loan at assumed 10% fixed interest over 84 monthly annuity payments, without grace. The $4,800 fee is expensed. Cash without owner equity reaches −$285,027. Adding an $80,000 retained reserve and rounding upward produces the equity requirement; costs in the trough are not added again.
- Minimum funded cash is $80,973 in March 2027.
- Receivables use two days, food inventory seven days and payables zero.
- Book depreciation uses seven years; terminal valuation is excluded from project payback and cash ROI.
Interpret the premium-price result without confusing unitsCF
Base 2027 revenue is $1,281,435 from 9,365 paid dining covers and 3,166 pairings. Total served guests are 9,801 after complimentary attendance. The 12,531 sold menu-and-pairing units used by the financial report are therefore not a guest count. Base 2027 EBITDA is $268,697.
Monthly EBITDA, EBIT and operating cash first become and remain nonnegative in April 2027. Project payback is April 2028, month 16, without later reversal. The 60-month simple project cash ROI is 500.3%: $2,186,630 net unlevered project FCF divided by $437,059 absolute negative monthly project FCF. This strong scenario depends on the premium tariff, recipe budget and productive time.
- The project measure is undiscounted and nonannualized; it excludes financing and terminal sale proceeds.
- Low monetary stress has $58,615 minimum cash, below the $80,000 reserve objective.
- No shareholder distributions are scheduled; retained business cash is not a realized investor return.
Selected results from the starting case
Modeled results in USD unless stated otherwise. These describe the selected inputs, not an estimate for your location or a guaranteed outcome.
- 2027 revenue
- $1,281,435USD, Base; delivered menus and paid pairings after March opening.
- 2027 paid dining covers
- 9,365Served paid diners; separate from 3,166 pairings and 436 complimentary guests.
- 2027 EBITDA
- $268,697Base operating result before interest, tax, depreciation and amortization, including setup months.
- Minimum cash
- $80,973Funded Base monthly balance in March 2027.
- Project payback
- April 2028 / month 16Cumulative undiscounted unlevered project FCF recovery from January 2027.
- Low-case minimum cash
- $58,615Monetary stress with fixed funding and physical sessions; below the selected $80,000 reserve.
Make the case your own
Work from the operating plan toward the cash requirement.
Enter the actual menu, offered sessions, service window and expected reservations.
Validate preparation, plating, dining-service and beverage time budgets against paid staff.
Update recipe costs, attendance, installed assets and premises expenses.
Review discarded no-show menus, monthly reserve coverage and cumulative project cash recovery.
Interpretation and scope
- The national case is not a local booking study or an operator's actual financial performance.
- Representative monthly service days and equal labor allocation omit party-to-table packing and peak variation.
- Whole-cover rounding can reduce realized attendance below 96% and round a small complimentary allocation to zero.
- Annual expense allocation affects monthly margins, working capital and exact break-even timing. The 25% tax rate has no chosen jurisdiction or loss carryforward.
The workbook is an Excel file for local planning. Learn how to interpret assumptions and evidence.
Other restaurant types
Each operating type calls for its own financial structure.
Questions
Are the five courses five separate sales?
No. A served paid guest earns one complete-menu price. Pairings are the only separately priced addition in the saved offer.
Are reservations prepaid?
No. Payment follows service, with two receivable days approximating settlement. Deposits and unearned ticket revenue are absent.
Why do no-shows still cost food?
The kitchen prepares a complete menu for every accepted booking. A no-show menu is discarded and earns no menu sale.
Can unused early-session labor be moved to the late session?
Not automatically. The case divides paid kitchen and service capacity equally across offered sittings.
Does 96% attendance mean exactly 96% of annual bookings attend?
No. The percentage applies to each sitting and rounds down to whole covers, which can reduce realized attendance further.
Why are sold units higher than paid guest counts?
The financial product-volume total combines menus and pairings. A guest buying a pairing is still one diner occupying one seat.
Does the high cash ROI establish an achievable return?
No. It is an undiscounted model output driven by selected premium pricing and productivity. Validate those inputs; no shareholder payout is scheduled.
Can I buy this model now?
No. Purchasing and workbook downloads are not available on this site.
Which software does the workbook use?
The documented file is an Excel workbook (.xlsx). Compatibility with other spreadsheet applications is not established by the file extension.
Read the planning guides
Explore the relevant operating questions and how to interpret a workbook’s assumptions.
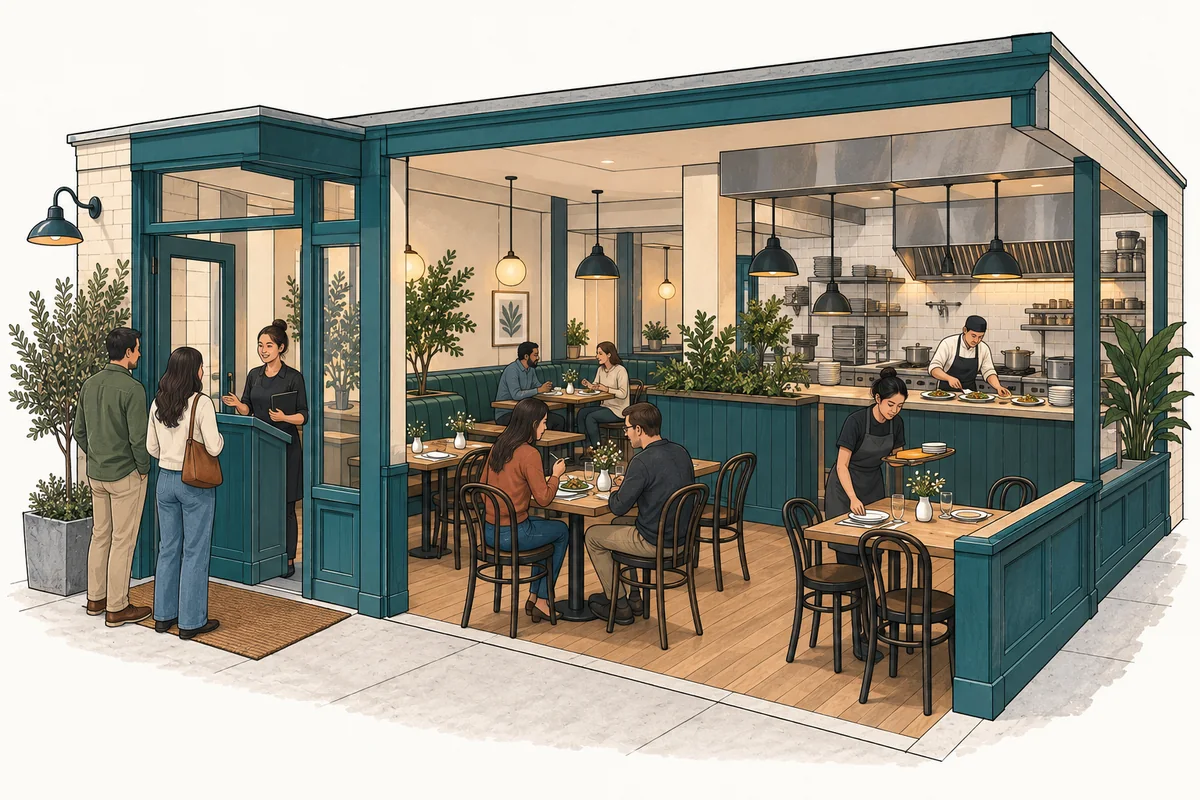
How do scheduled sittings and no-shows affect a fixed-menu forecast?
Follow fixed-menu reservations through synchronized service capacity, prepared menus, attendance, and optional pairings to see what becomes earned revenue.
Read the guide
How to read financial assumptions before editing an Excel model
Follow the chain from operating assumptions to calculated results, check units and timing, and keep a useful record of changes to a financial workbook.
Read the guideEvidence and scope
Primary operator examples support only the operating features described in the source registry. This full configuration, all formulas, local feasibility and numerical economics remain analyst-authored and unverified.
The links below provide operating-format context; they do not verify the workbook’s selected inputs or calculated returns.
The workbook guide and figures describe model PHY001-10, revision r01, for January 2027–December 2031. These are a documented planning case, not observed results for a particular business.