
Restaurant Financial Model: Food-Court Restaurant Concession
Model a food-hall stall from host footfall and customer conversion through shared kitchen capacity, tenant costs and startup cash.
- Excel (.xlsx)
- Tenant area: 600 sq ft
- Common seating allocation: 18 seats for capacity planning
- Opening: March 2027 / ten hours daily
Planning several types? Compare 17 restaurant formats
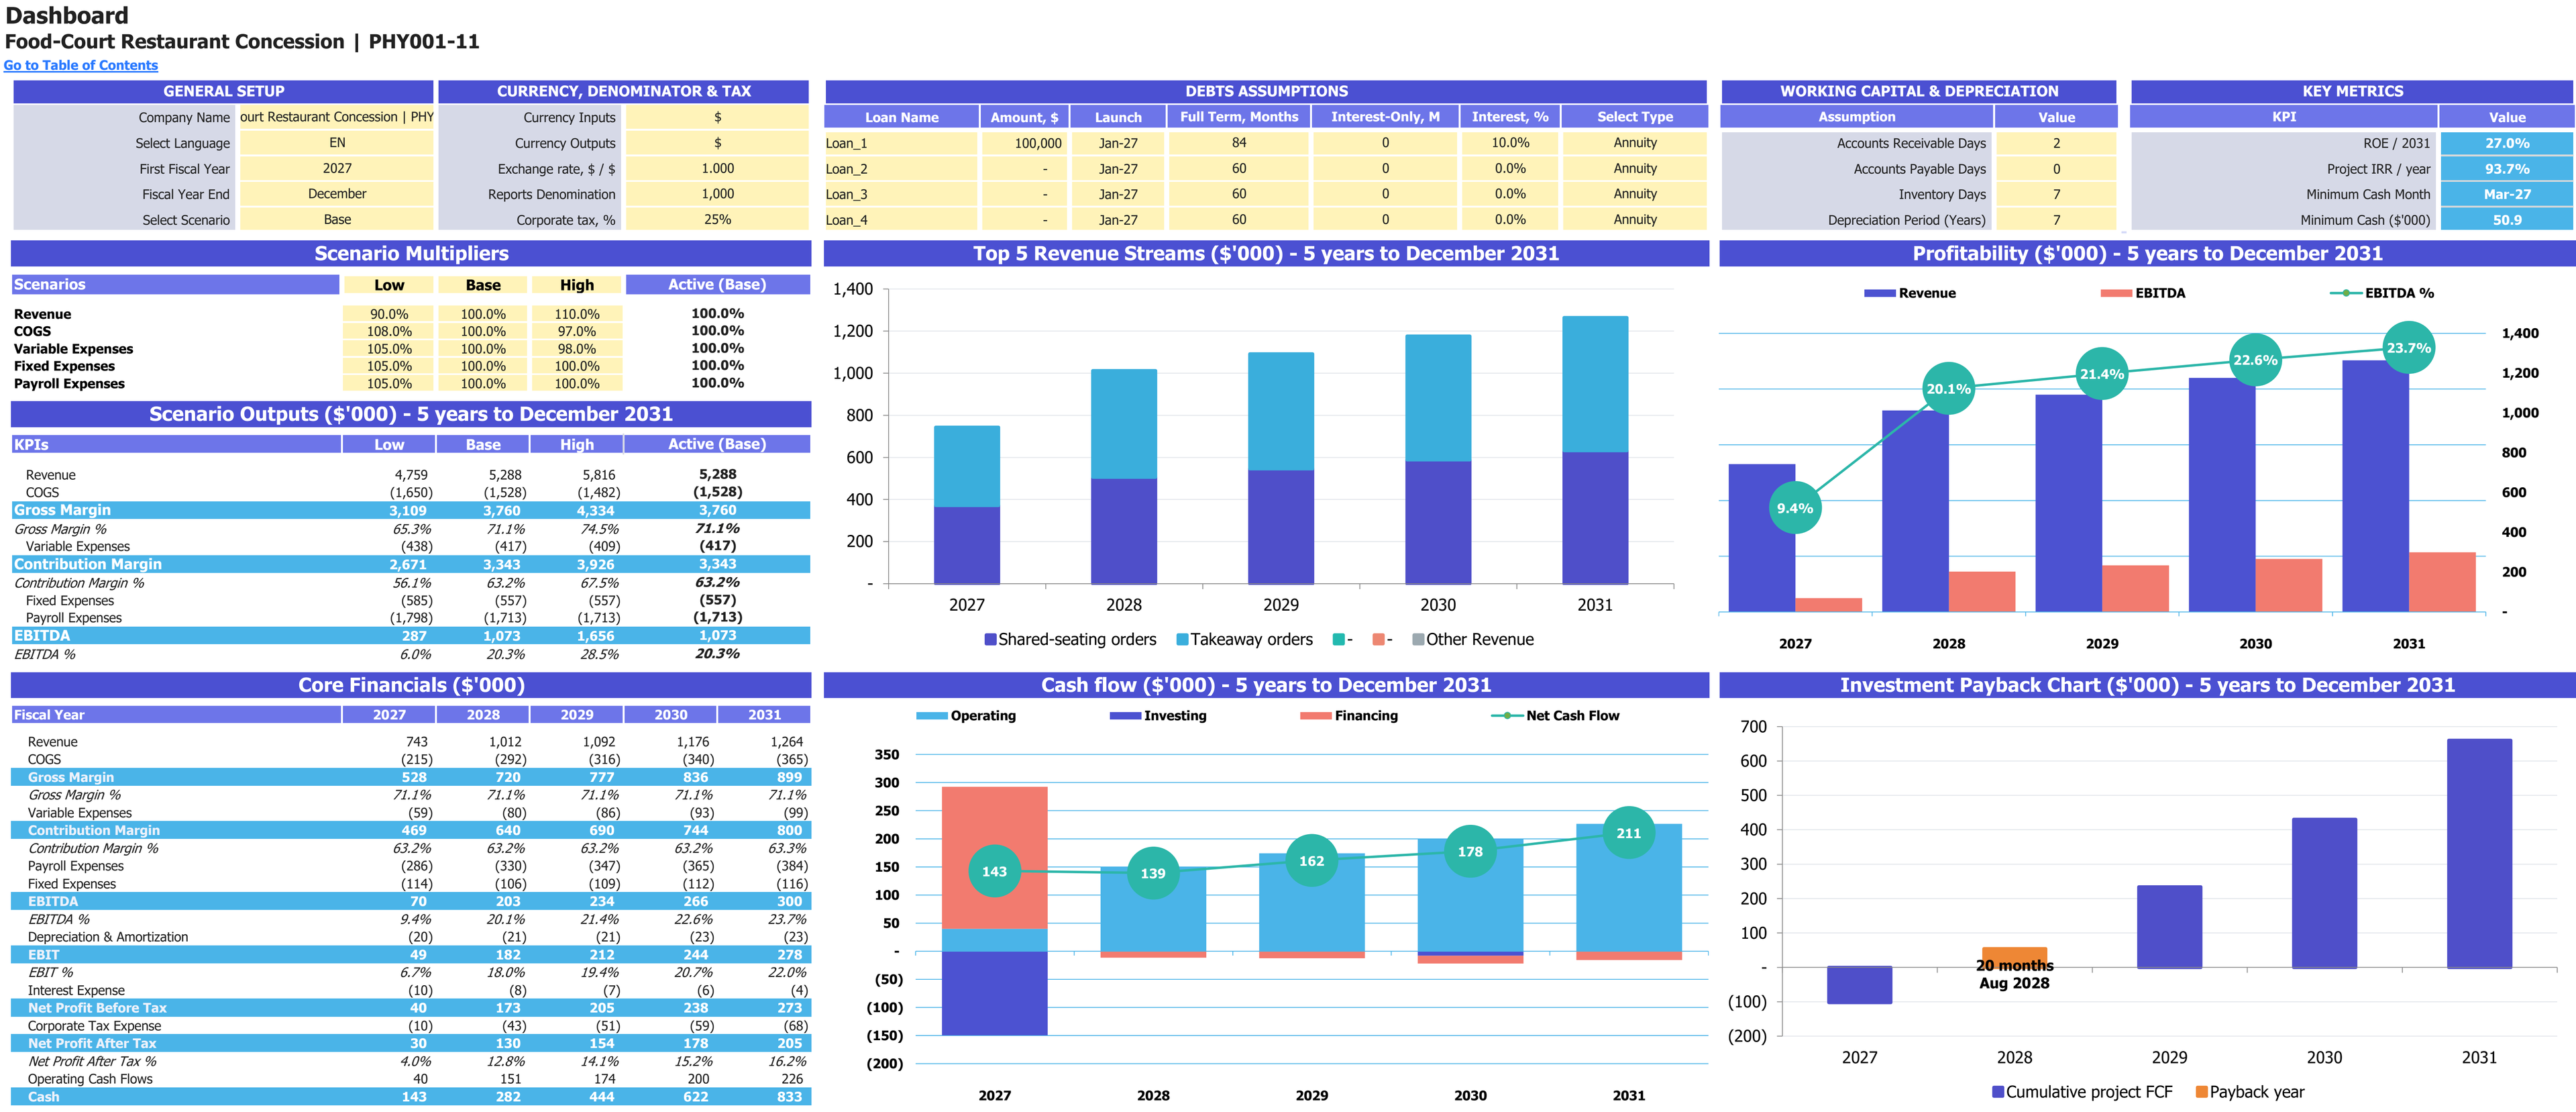
Base-case scenario controls, annual financial results and charts for 2027–2031. Financial report amounts are shown in thousands of USD; percentage measures retain their own units.
Enlarge image in a new tab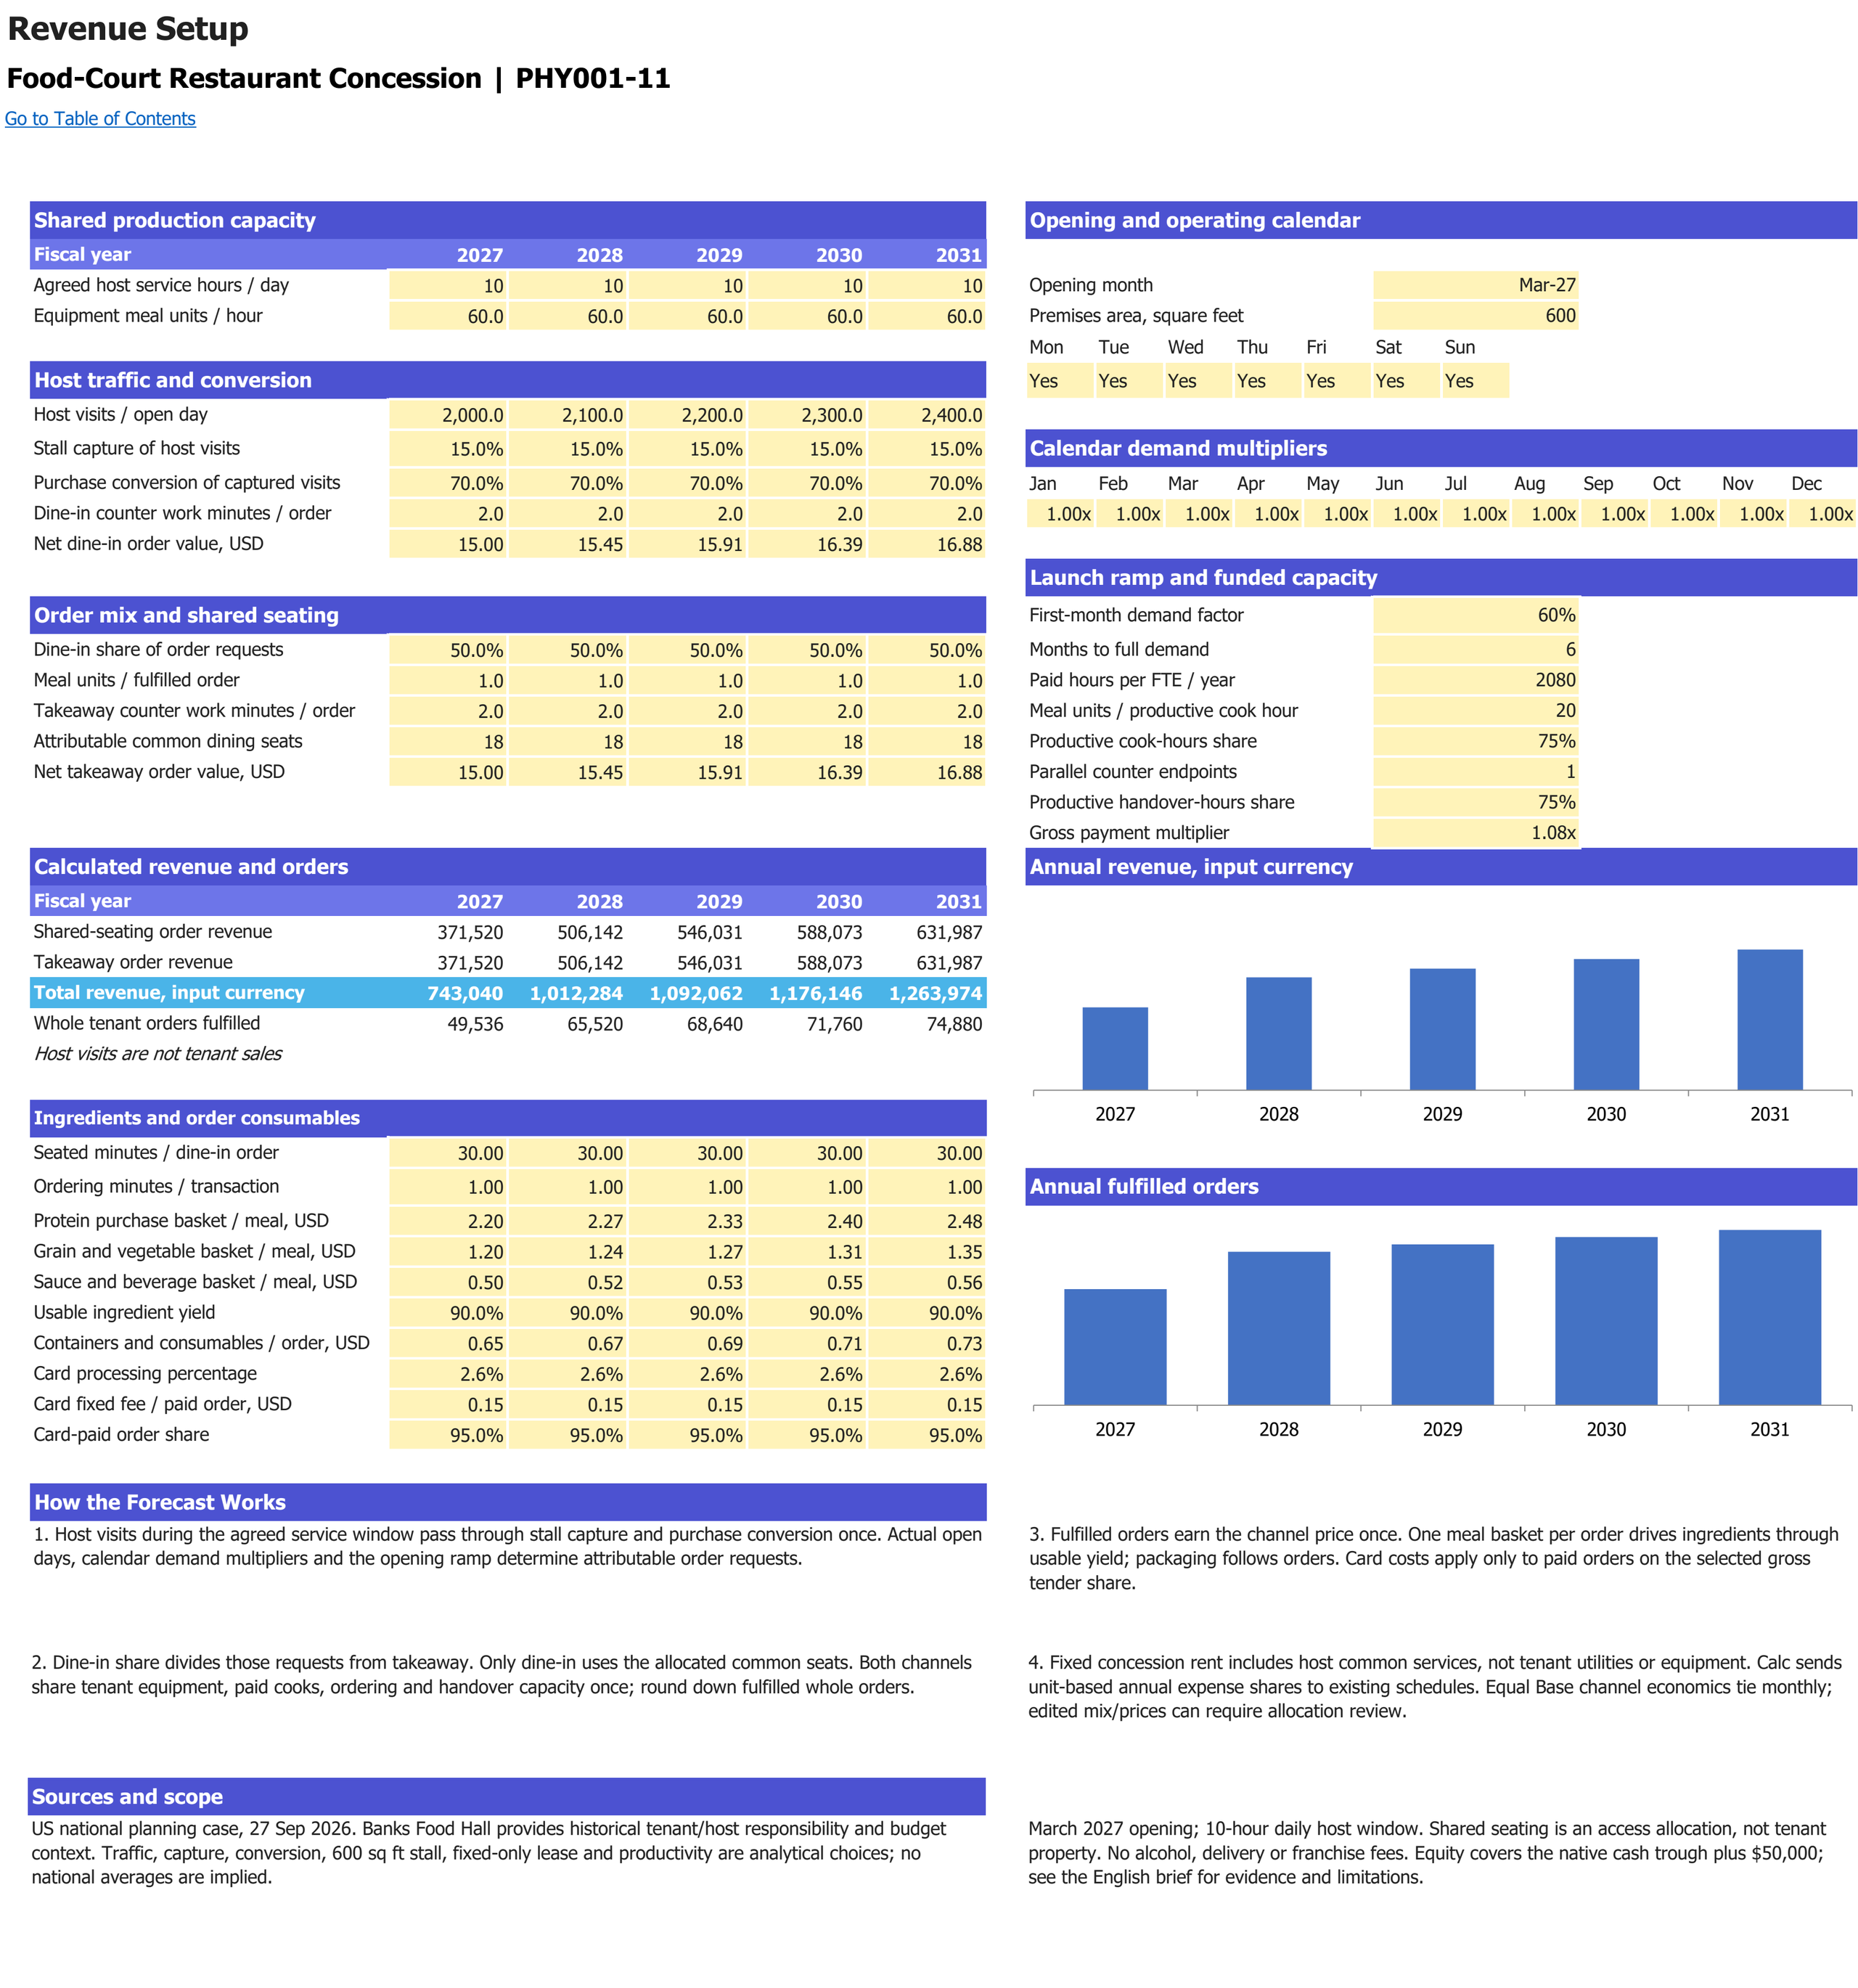
Food-hall footfall, tenant conversion and meal-stall production and service constraints. Monetary inputs and sales use USD; operating volumes retain their labelled units. Forecast years are 2027–2031.
Enlarge image in a new tab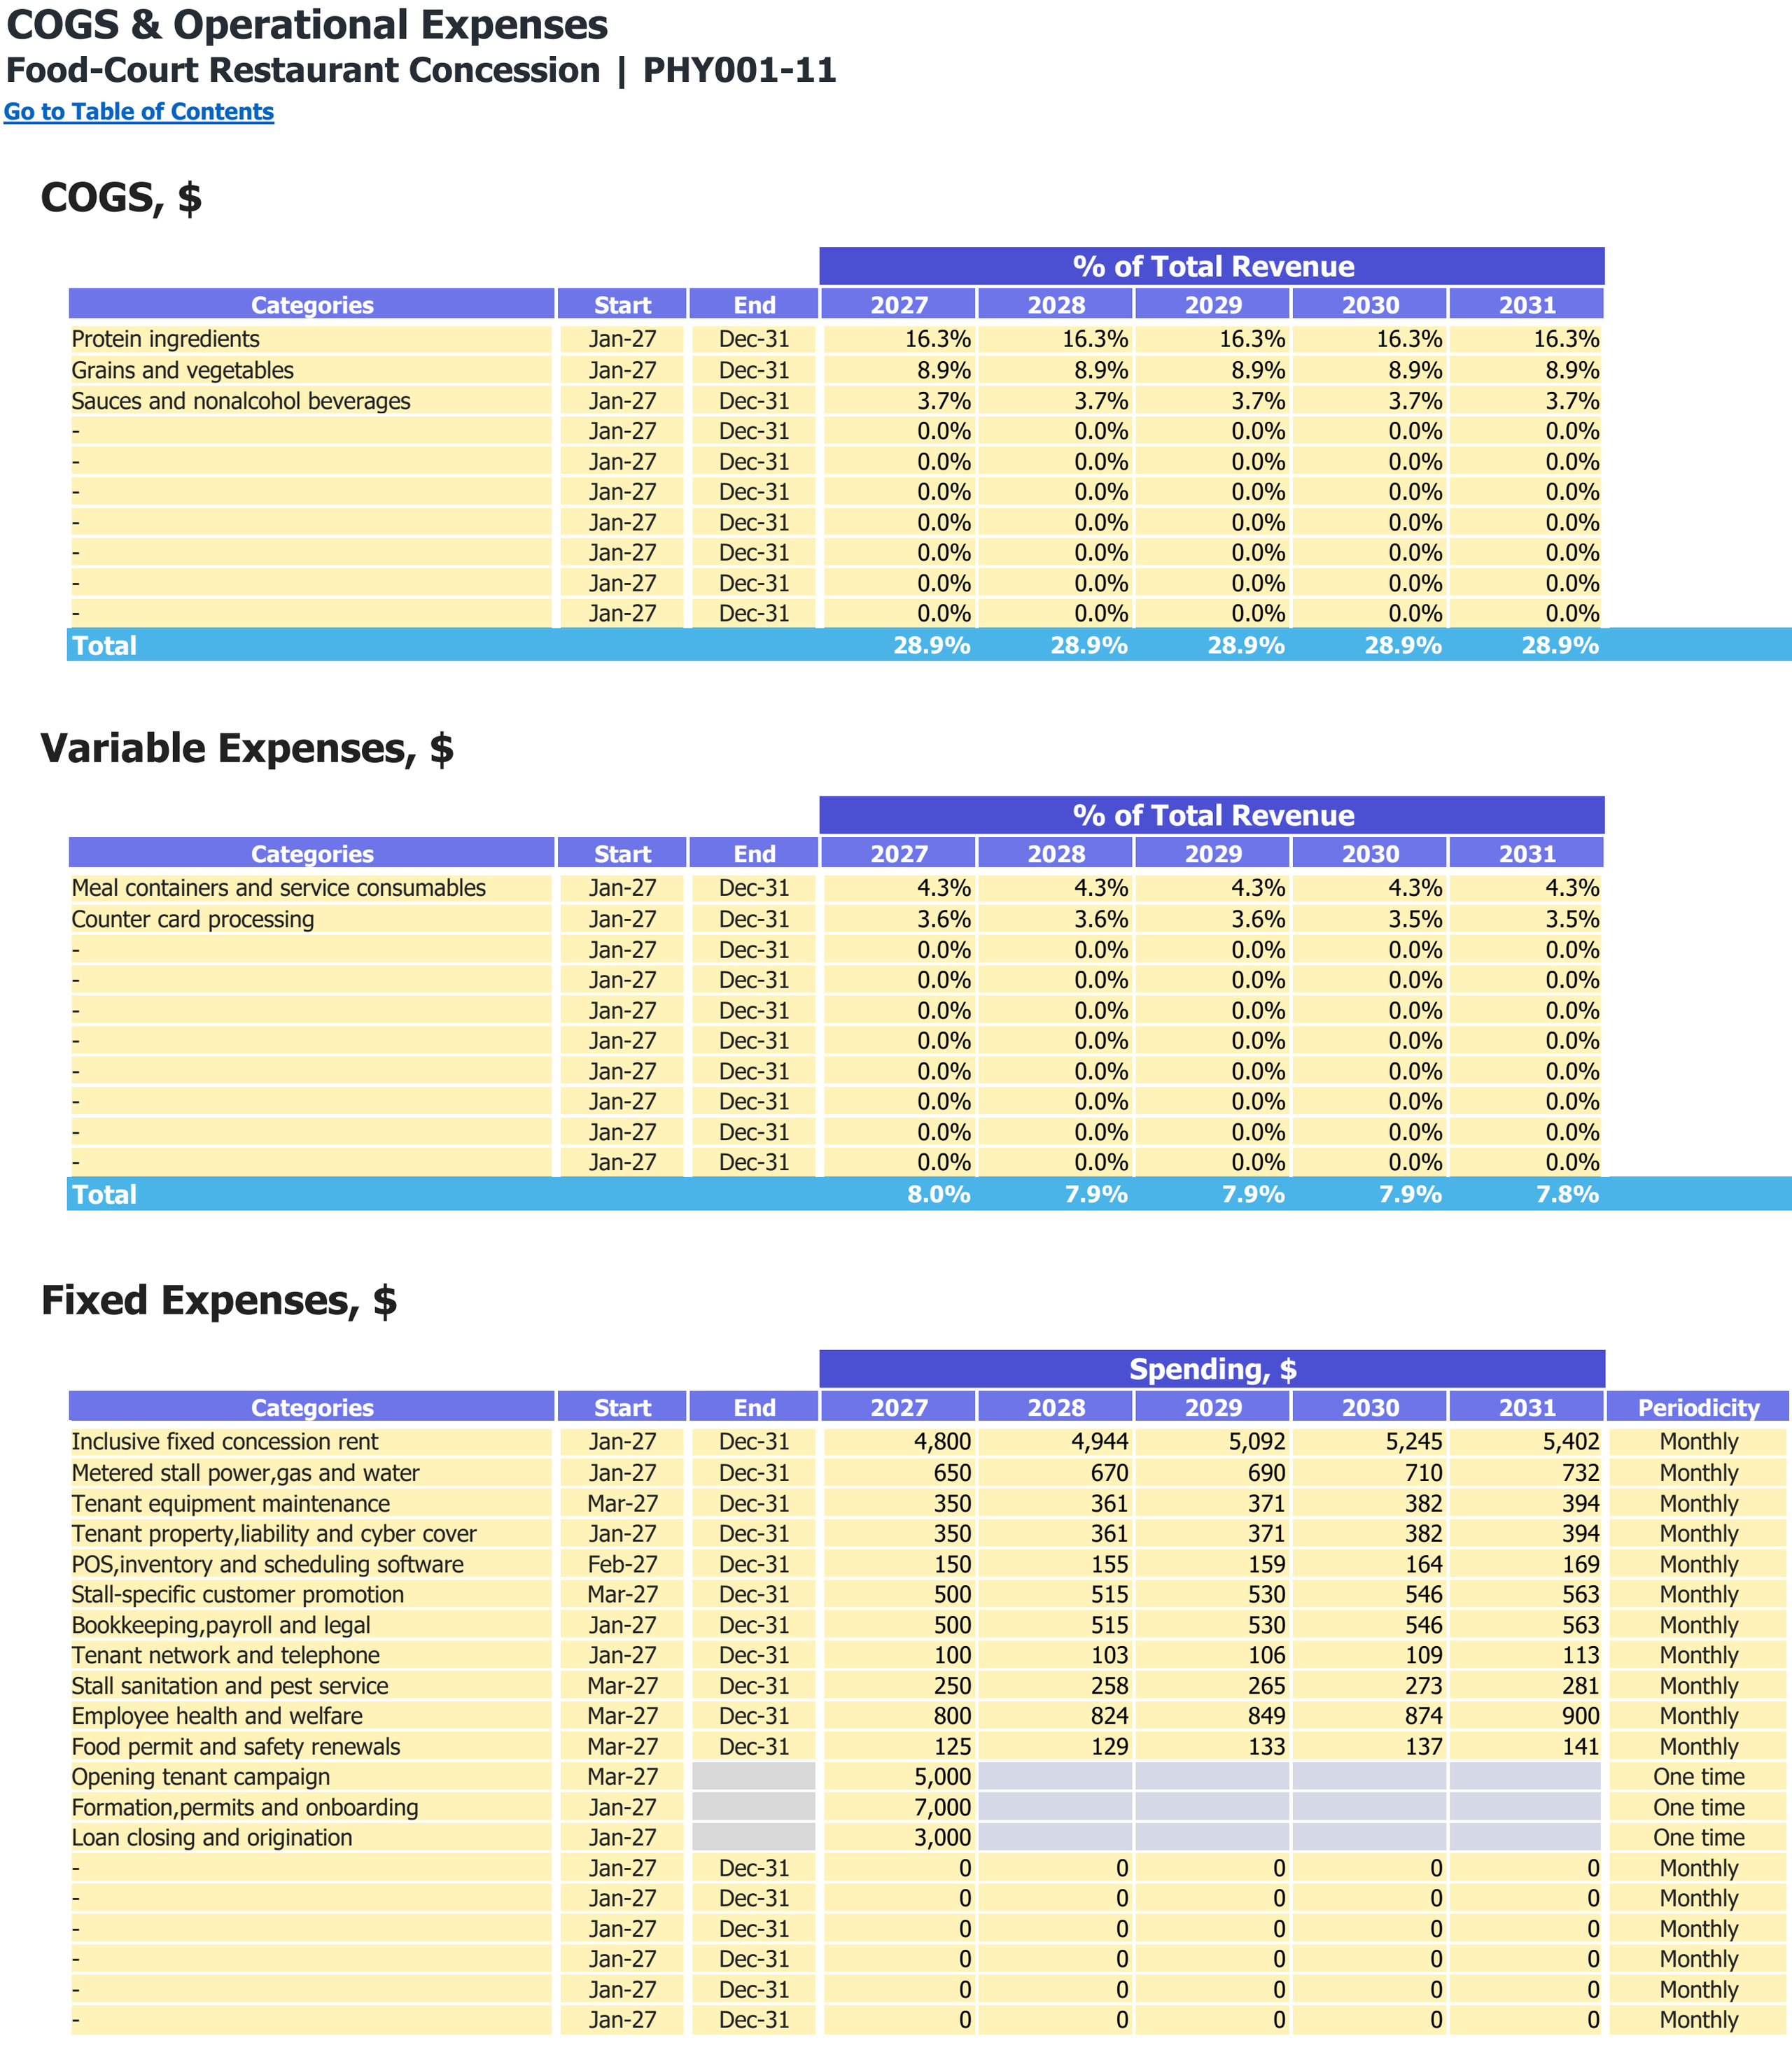
Food and other direct-cost categories, variable expense shares and fixed operating expenses. Monetary inputs are USD; the annual percentage columns are cost shares of revenue.
Enlarge image in a new tab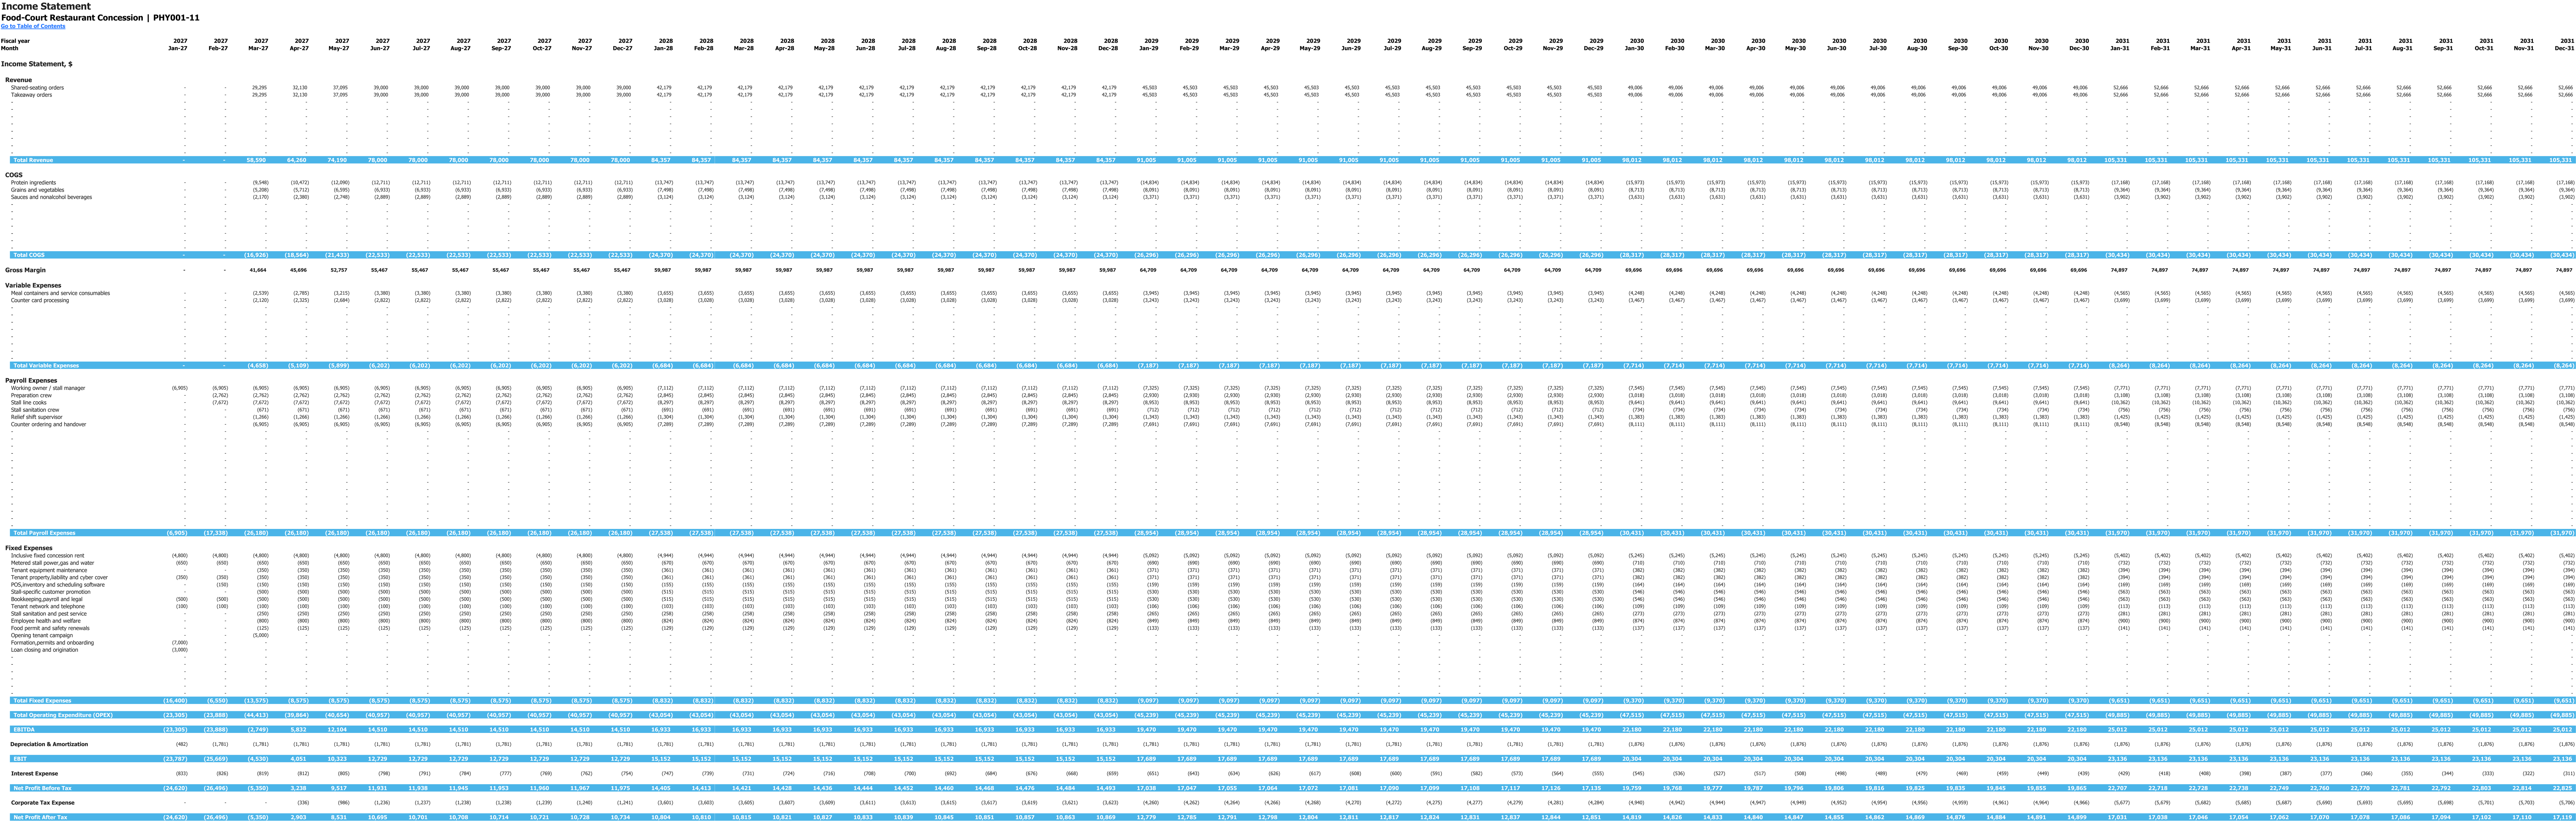
Monthly income statement for 2027–2031, in USD. This is an income statement view; it does not show payroll setup inputs. Enlarge to inspect the wide monthly table.
Enlarge image in a new tab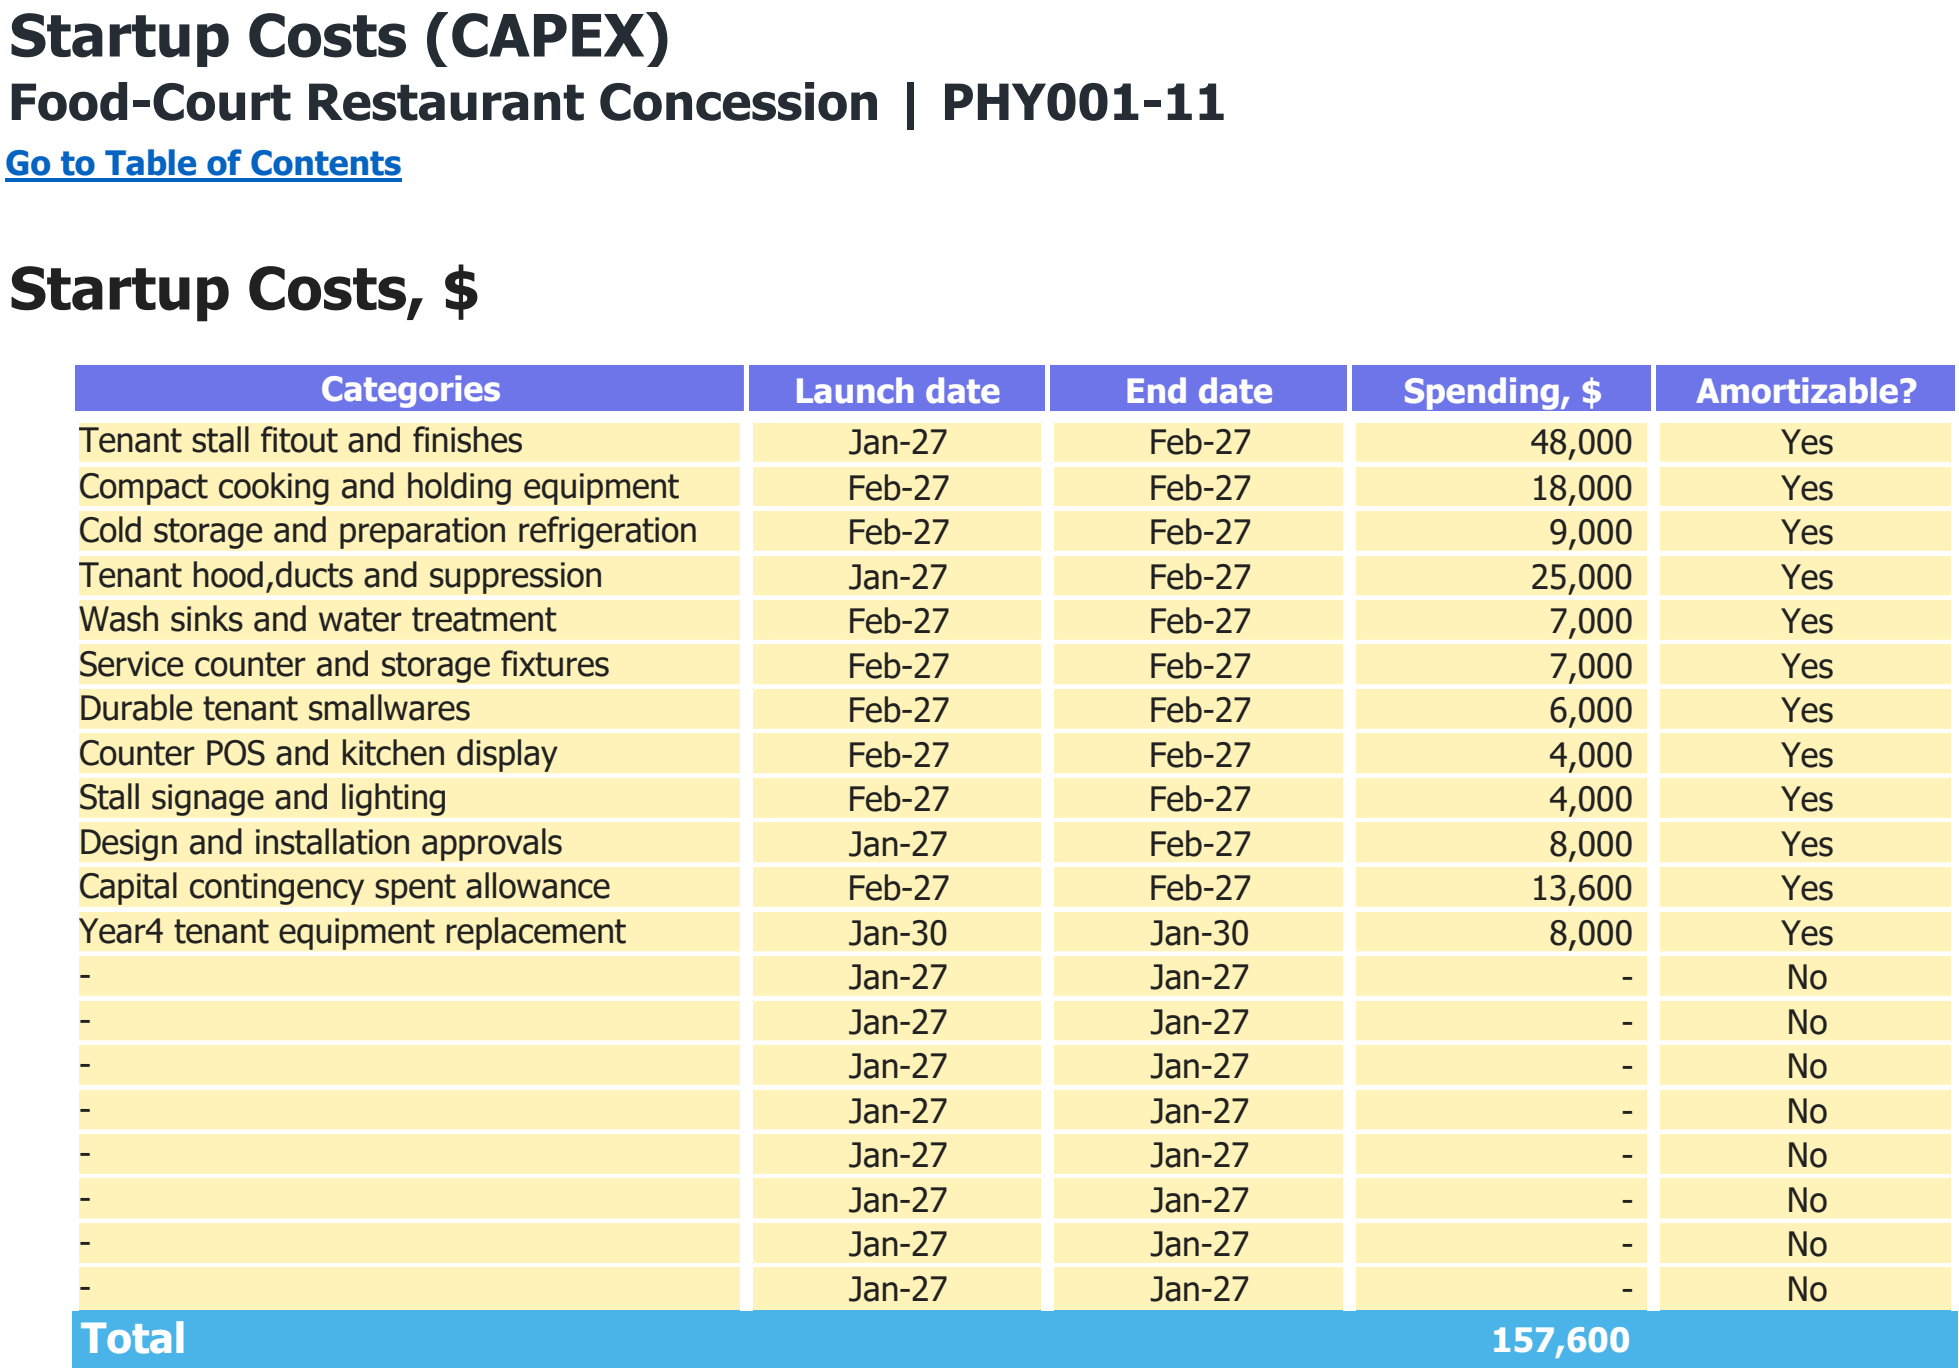
Asset categories, purchase dates and spending assumptions in USD. The total includes every scheduled purchase shown, including later replacements where present.
Enlarge image in a new tab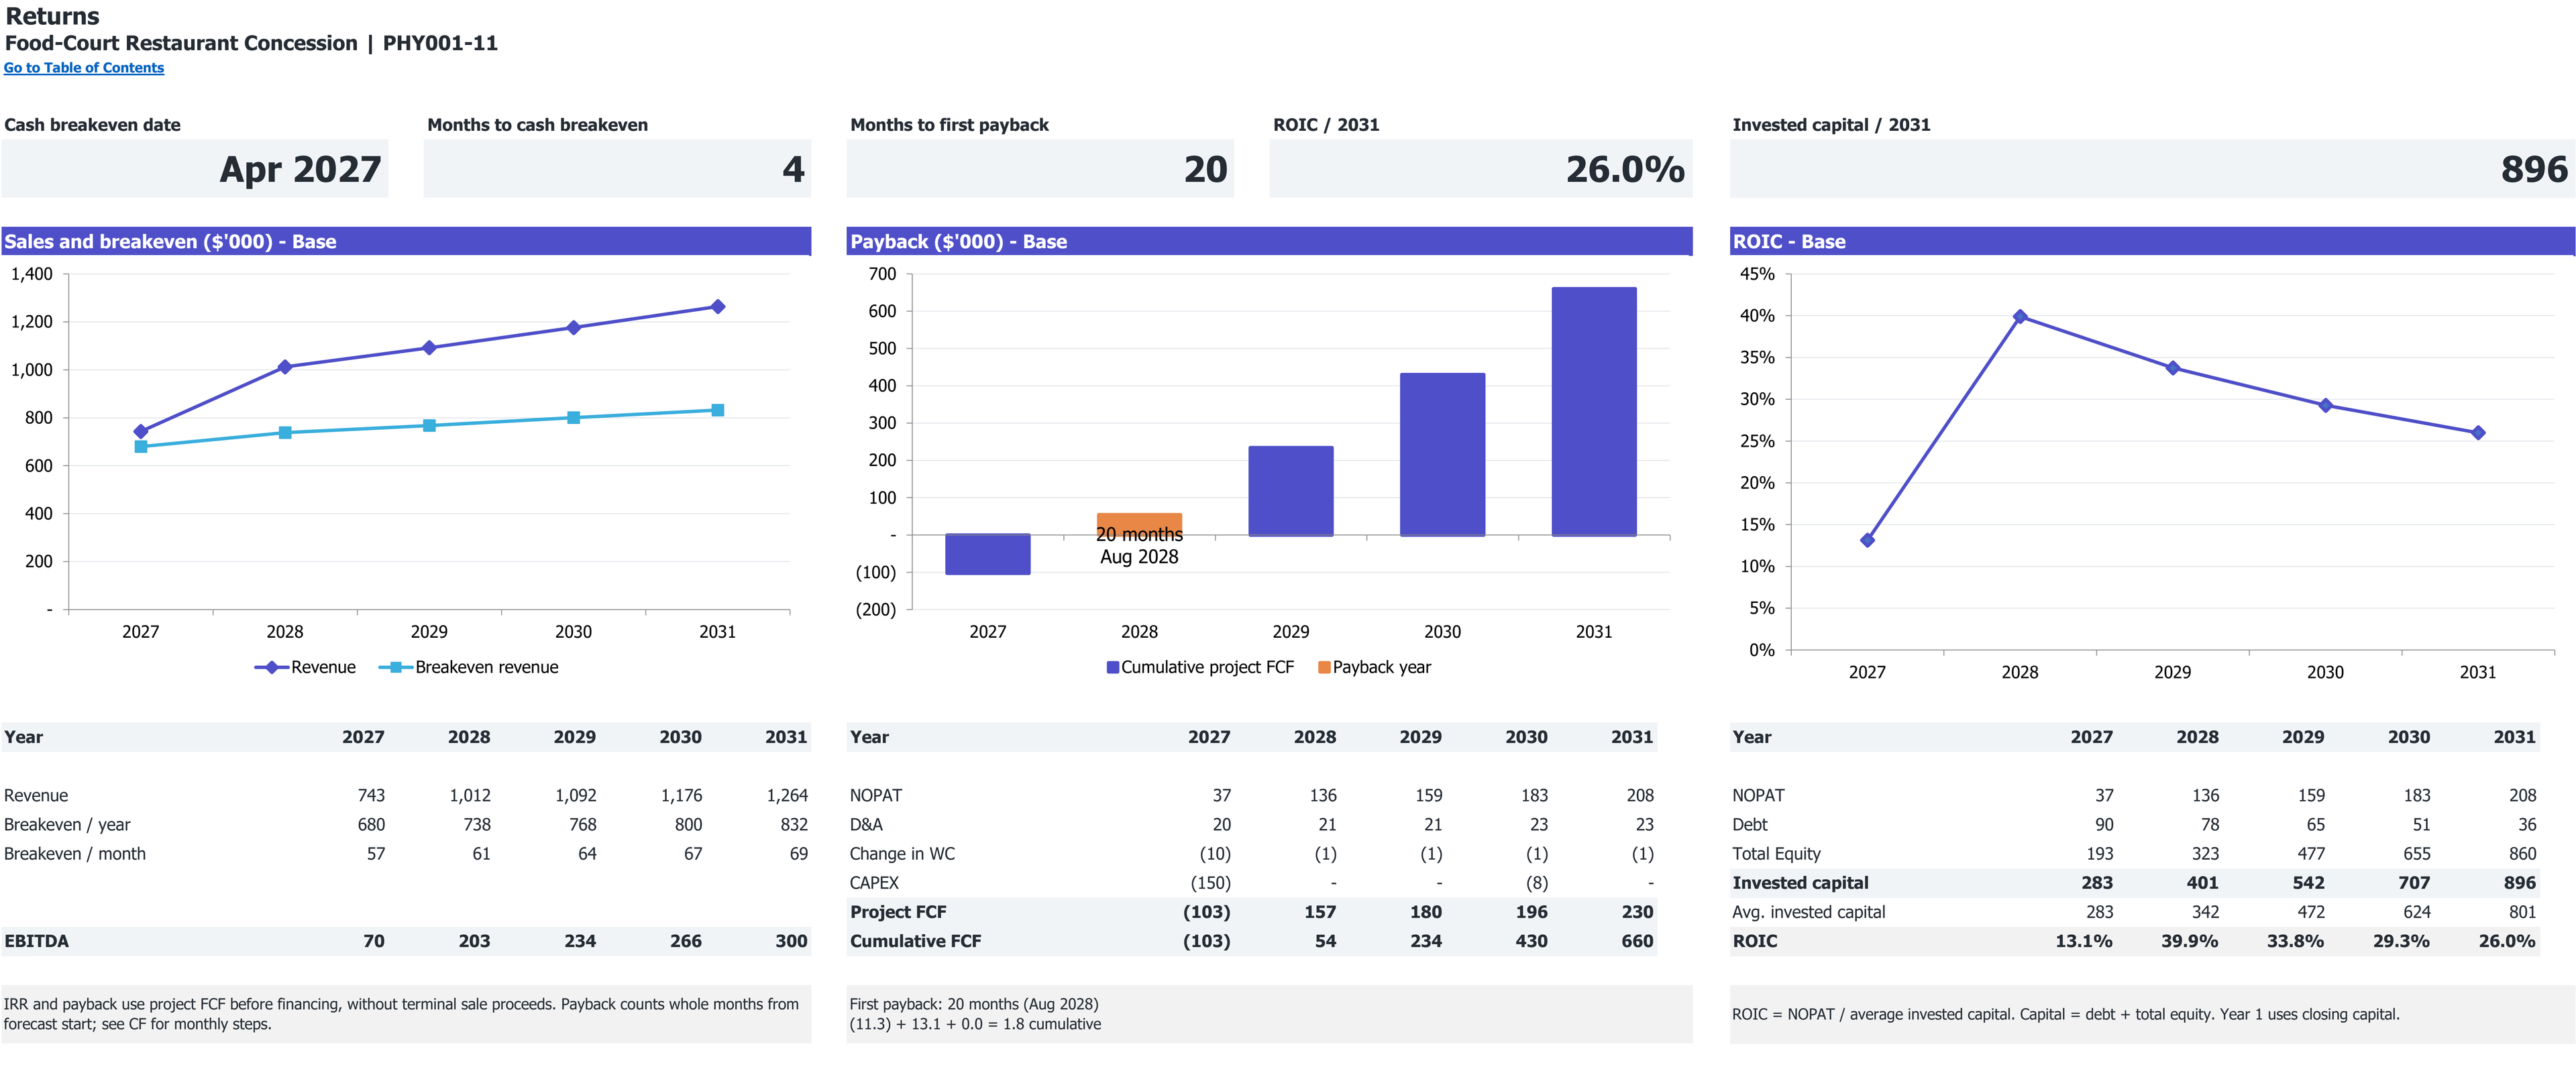
Excerpt from Returns: cumulative project free cash flow and first payback, if reached. 2027–2031 base case; dollar amounts in thousands.
Open full Returns view in a new tabExcerpt from Returns: revenue, annual and monthly break-even revenue, and EBITDA. 2027–2031 base case; dollar amounts in thousands.
Open full Returns view in a new tab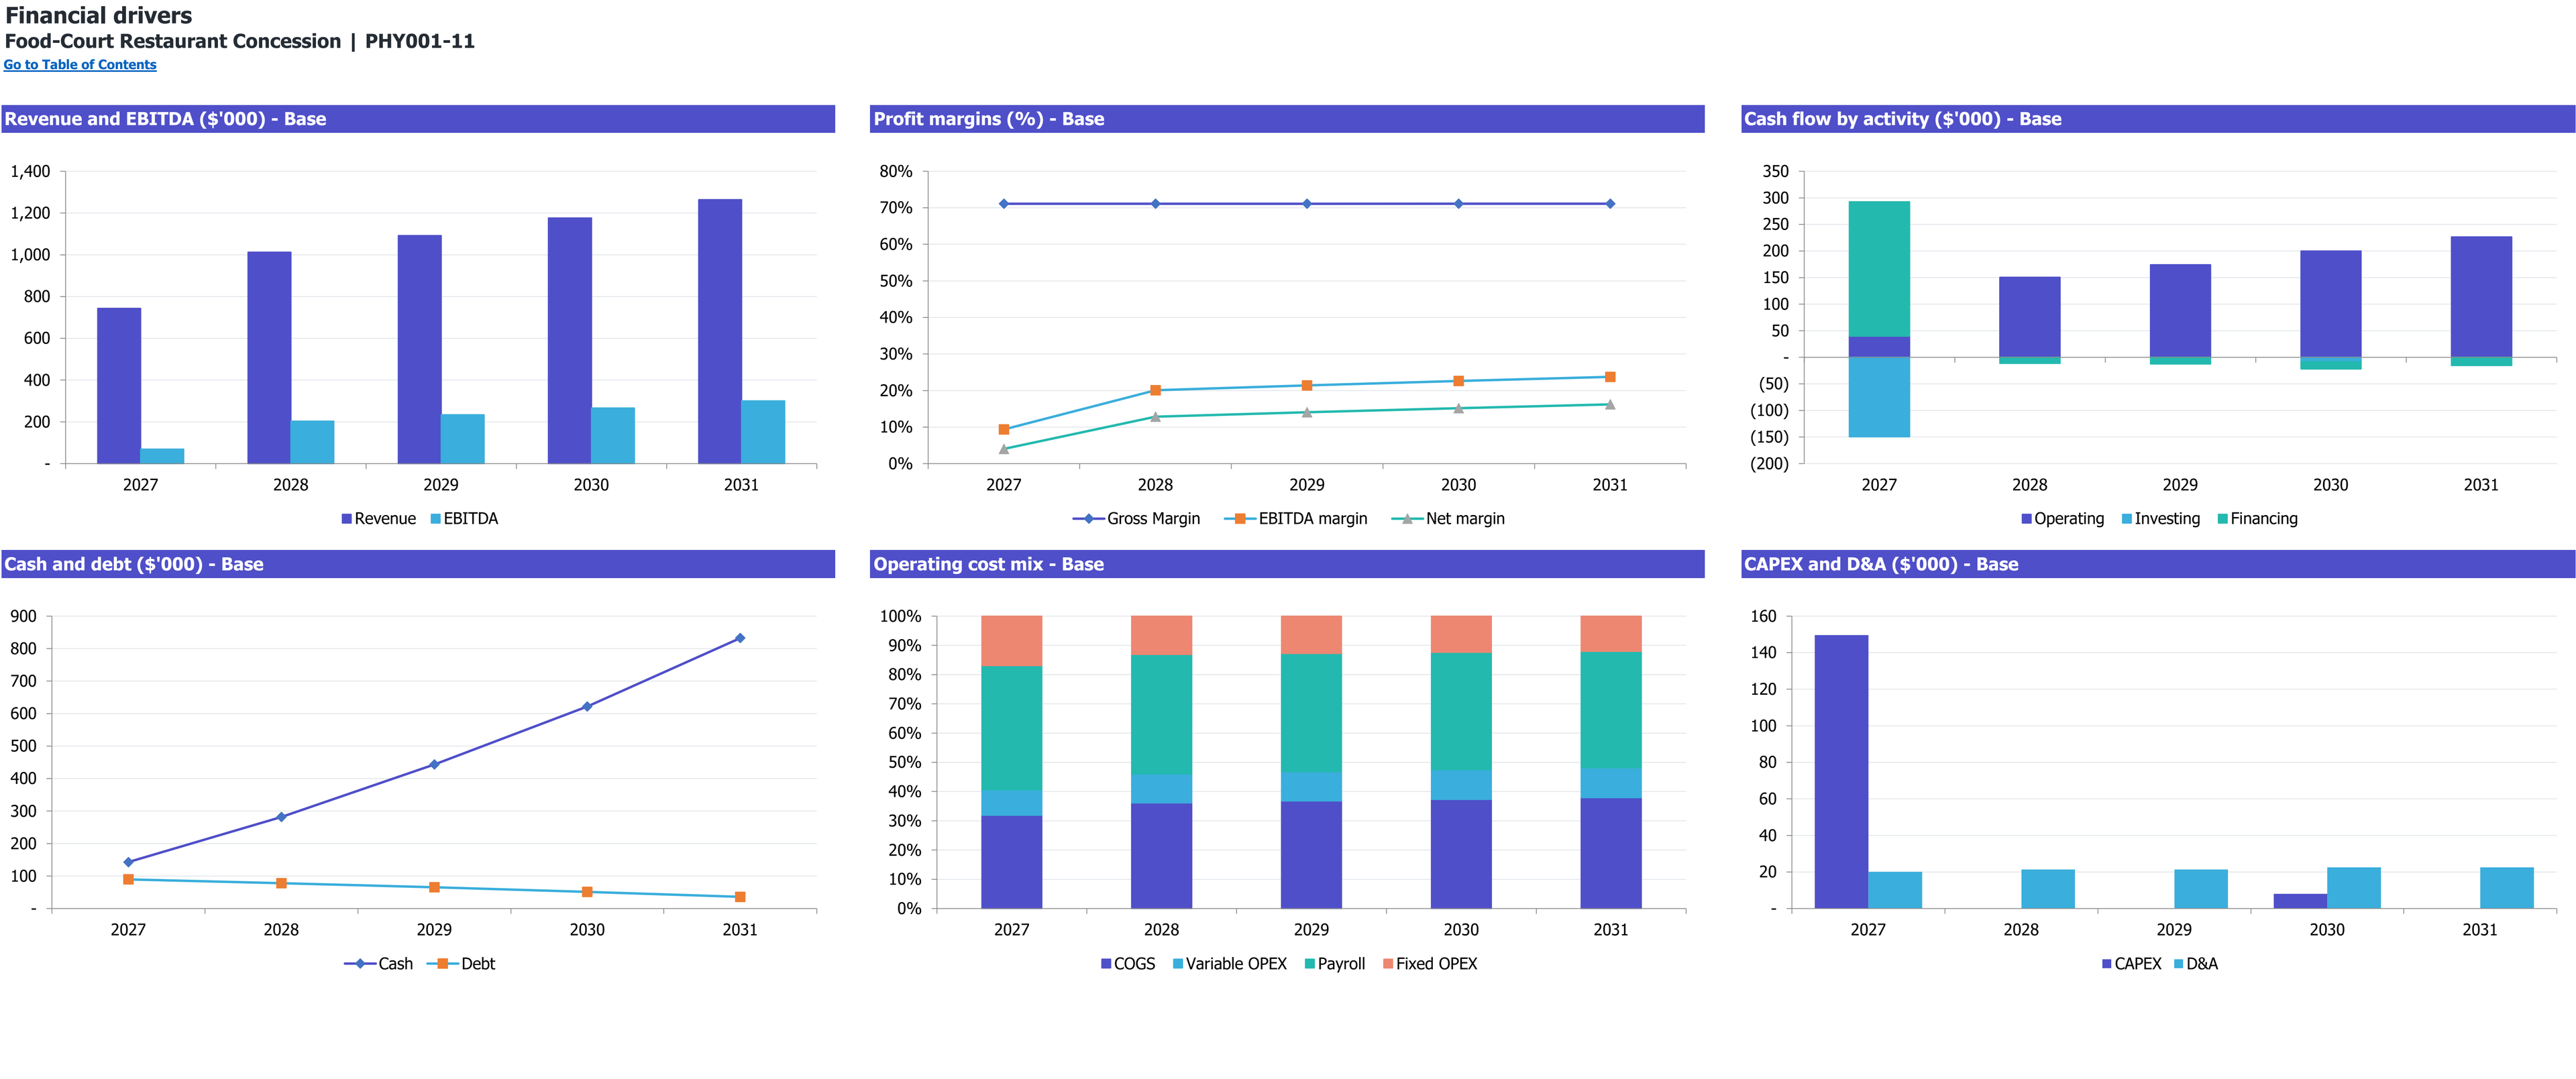
Six annual financial-driver charts for Food-Court Restaurant Concession, 2027–2031 (Base scenario). Dollar amounts are in thousands; margins and cost mix are percentages.
Enlarge image in a new tab8 selected worksheet views. Figures show this workbook’s starting case.
Workbook availability
What is inside the Excel model
Turn host traffic into fulfilled meal orders for a tenant-operated food-hall stall. Separate the host’s common services from the staff, equipment and cash commitments borne by the tenant.
Selected worksheets from the documented workbook. Forecast period: January 2027–December 2031. Model reference: PHY001-11.
Inputs you control. Results you can inspect.
On a small screen, scroll within the table to read every column.
| Planning area | Inputs you review | How they connect | Results to inspect |
|---|---|---|---|
| Host demand | 2,000 host visits/day; 15% capture; 70% conversion. | Apply capture and conversion once, then calendar and ramp factors. | Initial mature demand of 210 orders/day before constraints. |
| Channels and capacity | 50% dine-in; 18 attributed seats; 60 installed meals/hour. | Apply seating, paid cooking, counter work and endpoint limits. | Whole fulfilled orders by channel. |
| Meal economics | $15 net order; one meal/order; 90% ingredient yield. | Recipe purchases and order-level costs follow served volume. | Sales, ingredients, packaging and payment expense. |
| Paid operation | 6.3 initial FTE; $4,800 inclusive monthly concession rent. | Fund owner, production and counter roles; separate tenant services. | Payroll, fixed overhead and operating profit. |
| Startup funding | $149,600 initial CAPEX; $163,000 equity; $100,000 debt. | Timed investment and operating cash establish the monthly cash trough. | Reserve coverage and project recovery. |
Is this the right model for your business?
Check the starting case before changing the assumptions.
The starting operation
- A tenant-operated meal stall inside a shared food hall.
- An operator evaluating venue traffic conversion and shared seating access.
- A founder budgeting tenant assets separately from host facilities.
Check the boundary
The saved contract excludes turnover rent, host sales commissions, delivery, alcohol and ownership of common dining facilities.
Compare the other restaurant typesHow this business makes money
Connect the unit sold to the resources required by this operating case.
Revenue logic
Fulfilled dine-in and takeaway meal orders multiplied by the net order price.
Host visits pass through stall capture and purchase conversion; venue traffic is not tenant sales.
Does high food-hall traffic guarantee stall revenue?
No. Capture, purchase conversion and the tenant’s funded throughput sit between host visits and sales. Shared seating and inclusive rent also need contractual scrutiny: the stall neither owns every seat nor necessarily pays every venue expense.
- Traffic conversion
- 2,000 × 15% × 70% = 210 initial mature requests/day
- Shared capacity
- 18 attributed seats; common kitchen and counter resources
- Lease scope
- Selected fixed-only inclusive concession payment
What to establish for your own operation
- Obtain venue traffic observations and a realistic capture study.
- Verify host-provided services and any actual turnover-rent clause.
- Time counter work and validate paid shift coverage.
Follow the plan from demand to cash
Open each section for the assumptions, calculations, and limits of this workbook’s starting case.
Convert host visits into orders the stall can serveRevenue
The selected 600-square-foot stall starts with 2,000 host visits per open day. A 15% capture rate and 70% purchase conversion create 210 mature daily order requests, split equally between dine-in and takeaway. March demand starts at 60% and reaches full demand over six active months.
Only dine-in uses the 18 attributed common seats. Both channels then share cooking, paid counter work and the ordering endpoint. The $15 order contains one meal and earns revenue once; included accompaniments do not create additional sales.
- Shared seats are an assumed allocation, not guaranteed exclusive access.
- Counter work takes two paid minutes per order; the physical ordering gate uses one minute.
- Monthly proportional fulfillment omits peak queues and lost-demand carryover.
Identify which costs belong to the tenantPayroll
Initial ingredients total $3.90 per meal before the 90% yield adjustment, producing $4.33333 purchased food cost. Each fulfilled order uses $0.65 disposable service. The starting team totals 6.3 paid FTE, including a $74,880 annual owner salary from January.
The selected $4,800 monthly concession rent includes common cleaning, host marketing, common utilities, property taxes and building insurance. The tenant separately pays metered stall utilities, its own cover, maintenance, promotion, sanitation and administration. This hypothetical fixed-only agreement has no turnover rent.
- There is no additional CAM charge on top of the inclusive rent.
- Employer load is 10.65%; the separate welfare pool starts at $800/month.
- Annual cost-share allocation can approximate monthly unit costs if channel economics change.
Fund tenant assets and the opening cash requirementCAPEX
Initial CAPEX of $149,600 includes tenant fitout, cooking, refrigeration, ventilation, washing, counter fixtures and a $13,600 spent contingency. Host dining furniture, restrooms and common construction are excluded. January 2030 adds $8,000 of replacement investment.
January financing combines $163,000 equity and $100,000 debt. The assumed loan uses 10% fixed interest over 84 monthly annuity payments, with a separately expensed $3,000 fee. Equity covers the pre-equity trough plus a $50,000 retained reserve, rounded upward.
- Tenant ventilation is explicitly budgeted; it is not assumed to be supplied free.
- Initial assets and retained cash reserve are separate requirements.
- Receivables use two days, food stock seven cost days and payables zero.
Read cash recovery alongside the lease and demand assumptionsCF
Base 2027 revenue is $743,040 from 49,536 fulfilled orders; EBITDA is $69,565. Minimum funded cash is $50,876 in March 2027. Monthly EBITDA, EBIT and operating cash become and remain nonnegative in April.
Project payback occurs in August 2028, month 20 from January 2027. This cumulative undiscounted unlevered cash measure includes startup deficits and investment while excluding financing and terminal value. No owner distributions are scheduled.
- Low monetary stress leaves $30,695 minimum cash with original funding unchanged.
- The five-year result depends on traffic and pricing growing faster than staff and overhead.
- Confirm real concession terms before treating the selected margin as usable.
Selected results from the starting case
Modeled results in USD unless stated otherwise. These describe the selected inputs, not an estimate for your location or a guaranteed outcome.
- 2027 revenue
- $743,040USD, Base; ten sales months after March opening.
- 2027 EBITDA
- $69,565USD, Base; includes the two setup months.
- Initial CAPEX
- $149,600USD; tenant-owned opening assets including spent contingency.
- Minimum cash
- $50,876USD, funded Base balance in March 2027.
- Project payback
- August 2028 / month 20Cumulative undiscounted unlevered project cash recovery; no owner payout.
Make the case your own
Work from the operating plan toward the cash requirement.
Enter observed host traffic and stall conversion assumptions.
Set channel mix and validate shared seating and throughput.
Replace tenant lease, staffing and installed-asset allowances.
Review monthly funding, monetary downside and physical demand stresses separately.
Interpretation and scope
- This US national case is not a forecast for a named venue.
- The fixed-only concession contract is analytical; variable rent needs explicit modeling.
- Monthly averages omit queues and competition for common seats.
- The 25% tax allowance has no chosen jurisdiction or loss carryforward.
- Published historical operator and benchmark observations do not establish current local demand or prices.
The workbook is an Excel file for local planning. Learn how to interpret assumptions and evidence.
Other restaurant types
Each operating type calls for its own financial structure.
Questions
Does the model bill every food-hall visitor?
No. Only fulfilled tenant orders earn sales after capture, conversion and capacity limits.
Are common dining seats owned by the stall?
No. Eighteen seats are attributed for planning; shared access needs validation.
Is turnover rent included?
No. The selected contract is fixed-only; a real percentage-rent clause must be added before use.
Is owner labor paid?
Yes. The owner/stall manager has an initial $74,880 annual salary from January.
Does initial CAPEX cover all financing?
No. The $263,000 funding package also covers startup cash needs and a retained reserve.
Can I buy this model now?
No. Purchasing and workbook downloads are not available on this site.
Which software does the workbook use?
The documented file is an Excel workbook (.xlsx). Compatibility with other spreadsheet applications is not established by the file extension.
Read the planning guides
Explore the relevant operating questions and how to interpret a workbook’s assumptions.
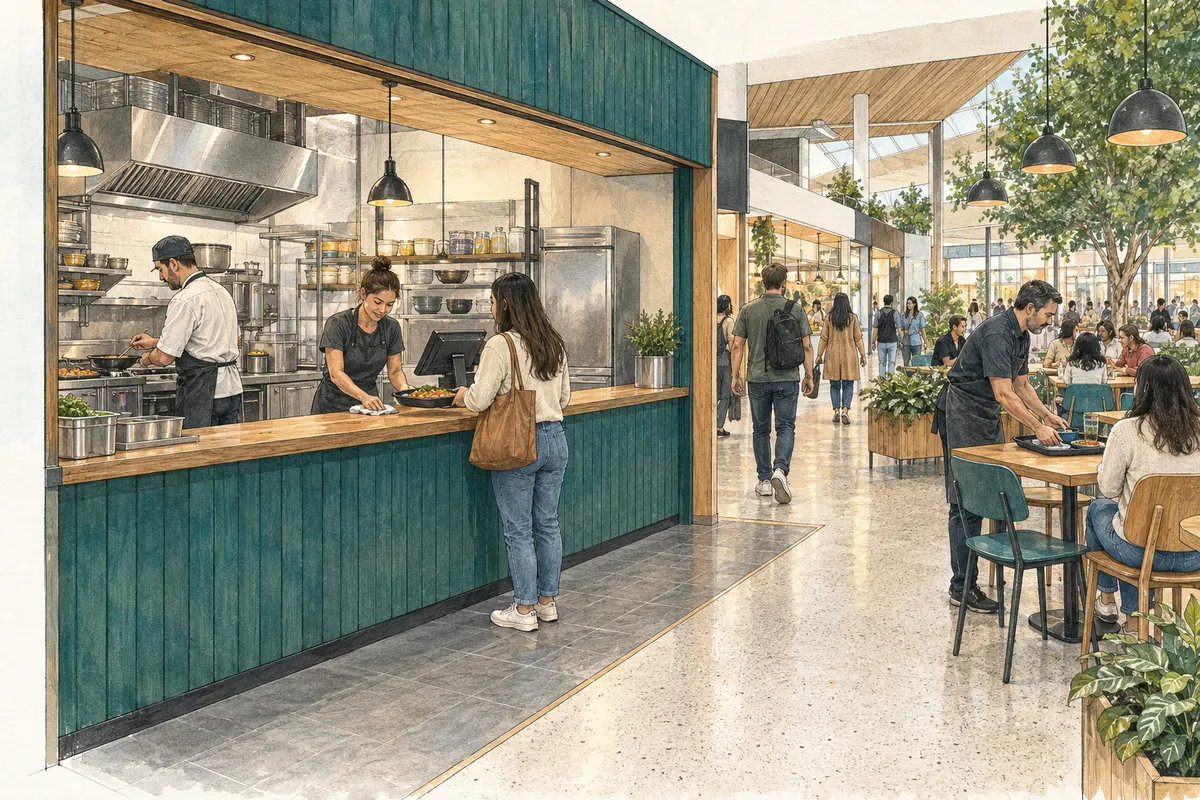
Which food-court costs belong to the stall and which belong to the host?
Separate inclusive concession rent from tenant expenses, then trace shared venue traffic through the stall's own demand, seating, kitchen, and counter limits.
Read the guide
How to read financial assumptions before editing an Excel model
Follow the chain from operating assumptions to calculated results, check units and timing, and keep a useful record of changes to a financial workbook.
Read the guideEvidence and scope
User-selected analytical restaurant configuration. No direct operator source was assigned; formulas and capacity assumptions are specifications rather than verified market facts.
The links below provide operating-format context; they do not verify the workbook’s selected inputs or calculated returns.
The workbook guide and figures describe model PHY001-11, revision r01, for January 2027–December 2031. These are a documented planning case, not observed results for a particular business.